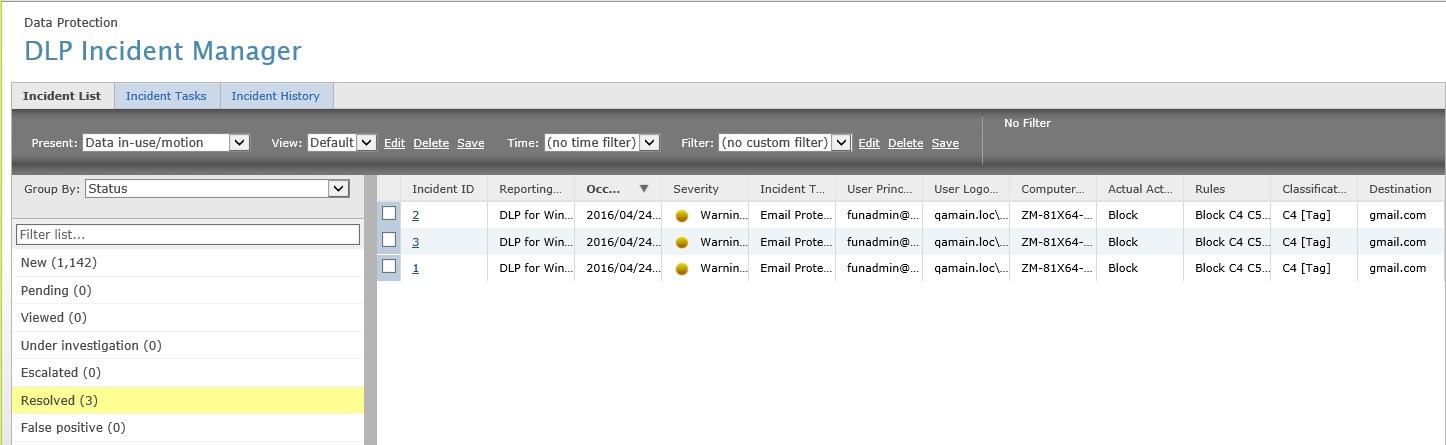
The Incident Manager Incident List tab has all the functionality required for reviewing policy violation incidents. Event details are viewed by clicking a specific event. You can create and save filters to change the view or use the predefined filters in the left pane. You can also change the view by selecting and ordering columns. Color-coded icons and numeric ratings for severity facilitate quick visual scanning of events.
Note
To display the User Principal Name and User Logon Name in Trellix DLP Network incidents, add an LDAP server to the DLP Appliance Management policy (Users and Groups category). You must do this even if your email protection rules do not use LDAP.
The Incident List tab works with ePO - On-prem Queries & Reports to create Trellix DLP Endpoint and Trellix DLP Network reports, and display data on ePO - On-prem dashboards.
Operations you can perform on events include:
Case management — Create cases and add selected incidents to a case
Comments — Add comments to selected incidents
Email events — Send selected events
Export device parameters — Export device parameters to a CSV file (Data in-use/motion list only)
Labels — Set a label for filtering by label
Release redaction — Remove redaction to view protected fields (requires correct permission)
Set properties — Edit the severity, status, or resolution; assign a user or group for incident review
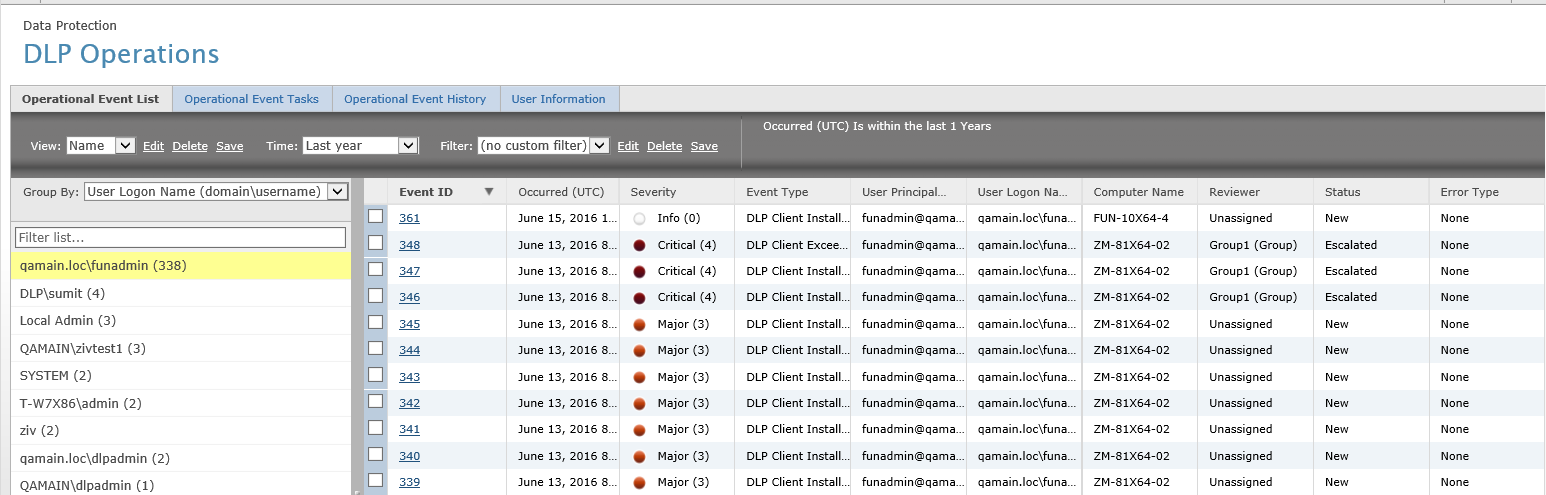
The DLP Operations page works in an identical manner with administrative events. The events contain information such as why the event was generated and which Trellix DLP product reported the event. It can also include user information connected with the event, such as user logon name, user principal name (username@xyz), or user manager, department, or business unit. Operational events can be filtered by any of these, or by other parameters such as severity, status, client version, policy name, and more.
Incident tasks/Operational Event tasks
Use the Incident Tasks or Operational Event Tasks tab to set criteria for scheduled tasks. Tasks set up on the pages work with the ePO - On-prem Server Tasks feature to schedule tasks.
Both tasks tabs are organized by the task type (left pane). The Incident Tasks tab is also organized by incident type, so that it is actually a 4 x 3 matrix, the information displayed depending on which two parameters you select.
Data in-use/motion | Data at-rest (Endpoint) | Data at-rest (Network) | Data in-use/motion (History) | |
|---|---|---|---|---|
Set Reviewer | X | X | X | |
Automatic mail notification | X | X | X | |
Purge events | X | X | X | X |
Purge evidence files | X | X | X | X |
Use case: Setting properties
Properties are data added to an incident that requires follow-up. You can add the properties from the details pane of the incident or by selecting Actions → Set Properties. The properties are:
Severity
Status
Resolution
Reviewing Group
Reviewing User
The reviewer can be any ePO - On-prem user. The reason severity can be changed is that if the administrator determines that the status is false positive, then the original severity is no longer meaningful.
Use case: Changing the view
In addition to using filters to change the view, you can also customize the fields and the order of display. Customized views can be saved and reused.
Creating a filter involves the following tasks:
To open the view edit window, click Actions → View → Choose Columns.
To move columns to the left or right, use the x icon to delete columns, and the arrow icons.
To apply the customized view, click Update View.
To save for future use, click Actions → View → Save View.
Note
When you save the view, you can also save time and custom filters. Saved views can be chosen from the drop-down list at the top of the page.