The Data Inventory tab in the DLP Discover module displays scan results from inventory, classification, and remediation scans.
Note
Results are displayed for the last time the scan was run.
The tab has three analytic views: dashboard, grid, and raw data.
Dashboard view
The Dashboard analytic view displays results as pre-set graphs. Data is displayed for the scan selected in the Scan Name drop-down list. The display depends on the Analytic Type selected: files or classifications.
For files, the graphs are:
Top repositories
Top containers
Top hosts
File sizes
Last modified time
Top file extensions
Top file extension groups
Last access time
For classifications, the graphs are:
Top repositories
Top containers
Top hosts
Top classifications
Top true file types
Last access time
Grid view
The Grid analytic view allows you to analyze files from scans. The tab uses an OLAP data model to display up to three categories to expose multidimensional data patterns. Use these patterns to optimize your classification and remediation scans.
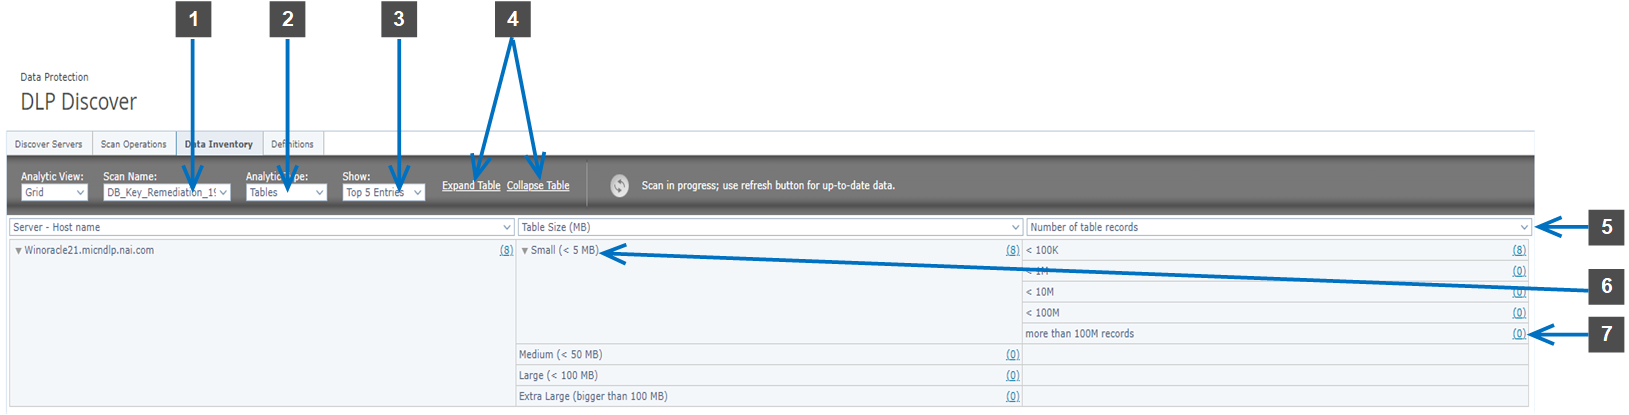
Scan Name — The drop-down list displays available scans for all types. Analysis can only be performed on a single scan.
Analytic Type — Select from Files or Classifications. For inventory scans, only Files is available. The analytic type determines the available categories.
Show — Controls how many entries are displayed.
Expand Table/Collapse Table — Expands the entire page. You can also expand or collapse individual groups.
Category selector — Drop-down list displays all available categories. You can select from the remaining categories in the second and third selectors to create a three-dimensional analysis of data patterns.
Item expansion — The arrow icon controls expansion/collapse of individual groups to clean up the screen display.
Count — Number of files (or classifications) in each group. Click the number to go to the Data Inventory tab and display details for that group.
Note
If the Analytic Type is set to Classifications and any files have more than one associated classification, this number might be larger than the total number of files.
Raw Data view
The Raw Data analytic view displays the inventory of files from scans with the File List option enabled. You can define and use filters to adjust the information displayed, which might reveal patterns or potential policy violations.
Note
Classification, File type, and Encryption type are not available for inventory scans.