The Story Graph in the Threat Event Log provides a visual representation of file-based and fileless-based ATP threat detections. You can examine the context of threats by reviewing the details of events leading up to a detection.
For ATP to generate a Story Graph, you must enable these options in the Adaptive Threat Protection Options policy:
Adaptive Threat Protection
One of these options:
Trigger Dynamic Application Containment when reputation threshold reaches
Block when reputation threshold reaches
Clean when reputation threshold reaches
The reputation threshold specified must also match the reputation of the detected event.
The Story Graph helps you answer these questions:
What was executed?
Why does ATP think it's malicious?
Where did the threat come from?
When in the attack chain did ATP stop the threat?
To view the graph for a particular threat event, open the Threat Event Log, select an event, and scroll down to the Story Graph (Trace Summary) section.
Identifying events
Icons on the Story Graph represent the type of event being traced.
Processes — gear icons

Files — document icons

Temp files — microSD card icons

Temp files represent an event that occurred in memory. AMSI detects these types of events.
Event colors indicate the reputation score. The Color Legend shows the reputation score range associated with each color.
Investigating events
The Story Graph is made up of several parts where you can view detection data.
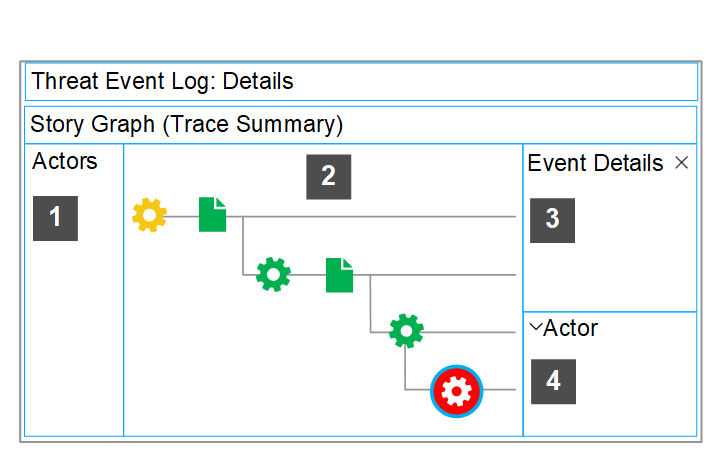
View the process name of each actor involved in the detection.
Follow the events in the graph, from left to right, to see what led to the detection.
A blue border appears around the selected event. The last event is selected by default and is where the detection occurred.
Investigate the suspicious activity by examining the data for each event in the graph.
Click any event to open the Event Details window. The event data provides context that enables you to see why ATP deems the event malicious. For example, you can see the changes in reputation score and command-line parameters from event to event and the primary trigger that started the malicious activity.
Review details about the process that started the event.
The Actor section doesn't appear for events where the target and the actor are the same, for example, if the process was already running.
Additional Story Graph data and any remediation details are available on the client system. ATP retains Story Graph data and remediation details for up to 90 days or 100 events. For more information, see KB90859.
Event data
Item | Definition |
|---|---|
Target Name | Identifies the name of the file or process being operated on. |
Reputation | Indicates the reputation given by the reputation provider. |
Reputation Score | Indicates the reputation score. |
PID | Indicates a unique identifier for the process. |
Action Taken | Describes the security action taken on the detected event (the last event in the graph). |
SHA-256 | Indicates the SHA-256 hash (64-digit hexadecimal number) of the file.
|
MD5 | Indicates the MD5 hash (32-digit hexadecimal number) of the file.
|
Command-Line Parameters | Indicates the context in which the event is generated. |

Item | Definition |
|---|---|
Name | Indicates the name of the process that started the event. |
Final Reputation | Indicates the overall reputation and reputation score after the event. |
Reputation Score | |
Initial Reputation | Indicates the overall reputation and reputation score before the event. If the final and initial reputation are the same, then the initial reputation and reputation score is not displayed. |
Reputation Score | |
PID | Indicates a unique identifier for the process. |
Reputation | Reputation score | Definition |
|---|---|---|
Known Clean Updater | 100 | A trusted file created by a trusted updater |
Known Trusted | 99 | A trusted file |
Most Likely Trusted | 85 | Almost certainly a trusted file |
Might Be Trusted | 70 | Appears to be a benign file |
Unknown | 50 | Can’t make a determination |
Might Be Malicious | 30 | Appears to be a suspicious file |
Most Likely Malicious | 15 | Almost certainly a malicious file |
Known Malicious | 1 | A malicious file |
Not Set | 0 | No reputation is specified |
Disable the Story Graph
Users can choose whether or not they would like to have the Story Graph feature enabled. Story Graph is enabled by default in order to provide valuable context to ATP detections.
Select Menu → Policy → Policy Catalog, then select Endpoint Security Adaptive Threat Protection from the Product list.
Click the editable policy.
Click Show Advanced.
In the Story Graph section, deselect the Enable Story Graph Tracing checkbox.
Click Save.
Enforce the policy to the client system.
To validate the Story Graph is disabled on the client system:
On Trellix ePO - On-prem
Select Menu → Systems → System Tree and select a group in the System Tree.
Click the system name.
Click Products, then click Endpoint Security Adaptive Threat Protection.
Scroll down to the Options section to view the Story Graph on the client system is disabled.
(On client system)
Click the Endpoint Security Adaptive Threat Protection module and make sure the Enable Story Graph Tracing checkbox is deselected.