To access the home page:
Log in to the Endpoint Security web UI as an administrator.
From the Modules menu, select Logon Tracker.
The following screen is displayed. Behind the scenes the UI has just loaded metadata, as indicated by the “Logontracker Ready In Xms” message displayed just below the Search controls.
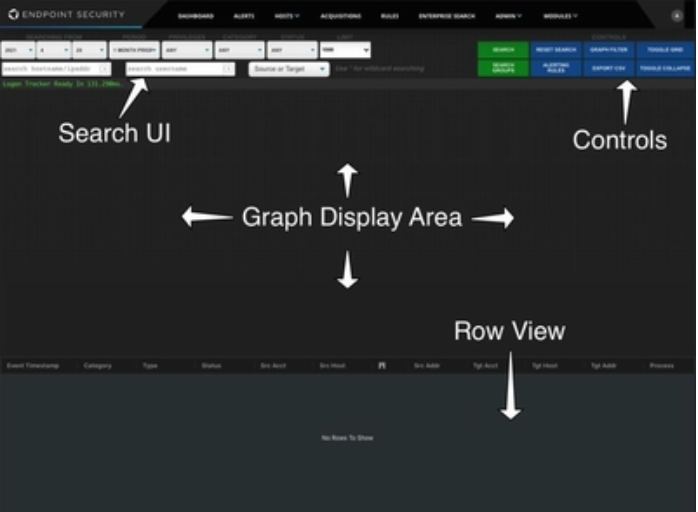
If the Logon Tracker module has been installed and enabled on agents using the Search button, the following screen is displayed.
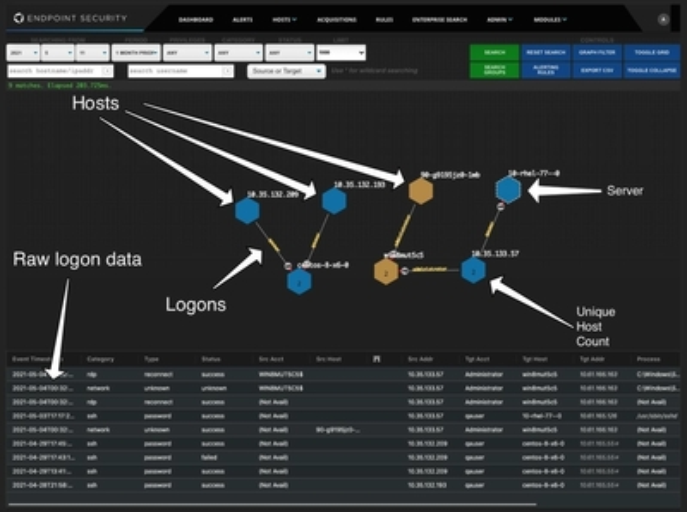
The following key points can be observed in the above figure.
Hosts are represented by hexagons.
The hexagon can represent multiple source or target sides of an event.
Hexagons containing integers represent “collapsed” nodes. For details on how the graph auto-collapses nodes see the Toggle collapse section.
The colors represent the generic Operating System the agent reported.
Blue: Windows
Yellow: Linux
Red: MacOS
A dashed line around a host indicates it is a server operating system.
In some cases, the source or target of multiple events will only have partial information. In these cases a best effort is used to accurately represent the node. However, for full details of the event refer to the grid view.
Links represent communication between two hosts. The red arrow indicates direction. The letters inside the circle encode one of the following Logon Categories.
? – Unknown
rdp – Remote Desktop Protocol ?
shr – Network Share
loc – Local
net – Network
ssh – SSH
svc – Service
ard – Apple Remote Desktop
pse – PsExec
wmi – WMI
wrm – WinRM
rpc – RPC
ldp - LDAP