Acquisitions are opened in the Audit Viewer from the Acquisitions page or host alert details area.
Log in to the Endpoint Security (HX) Web UI.
Access the Acquisitions page or the host alert details.
Select the triage or data acquisition containing the acquisition data.
Click the View Data Acquisition button. On the Acquisitions page, this appears in the detail pane for the acquisition. In the host alert details area, this appears on the line for the acquisition under Acquisitions.
If the Process Data Acquisition button appears instead, the acquisition data is not yet queued for processing in the Audit Viewer. See Processing the acquisition .
The default view that appears is the Timeline view (Timeline is selected in the Data Acquisitions section). The column values within each heading of the Timeline view vary based on the operating system of the host endpoint from which data was collected.
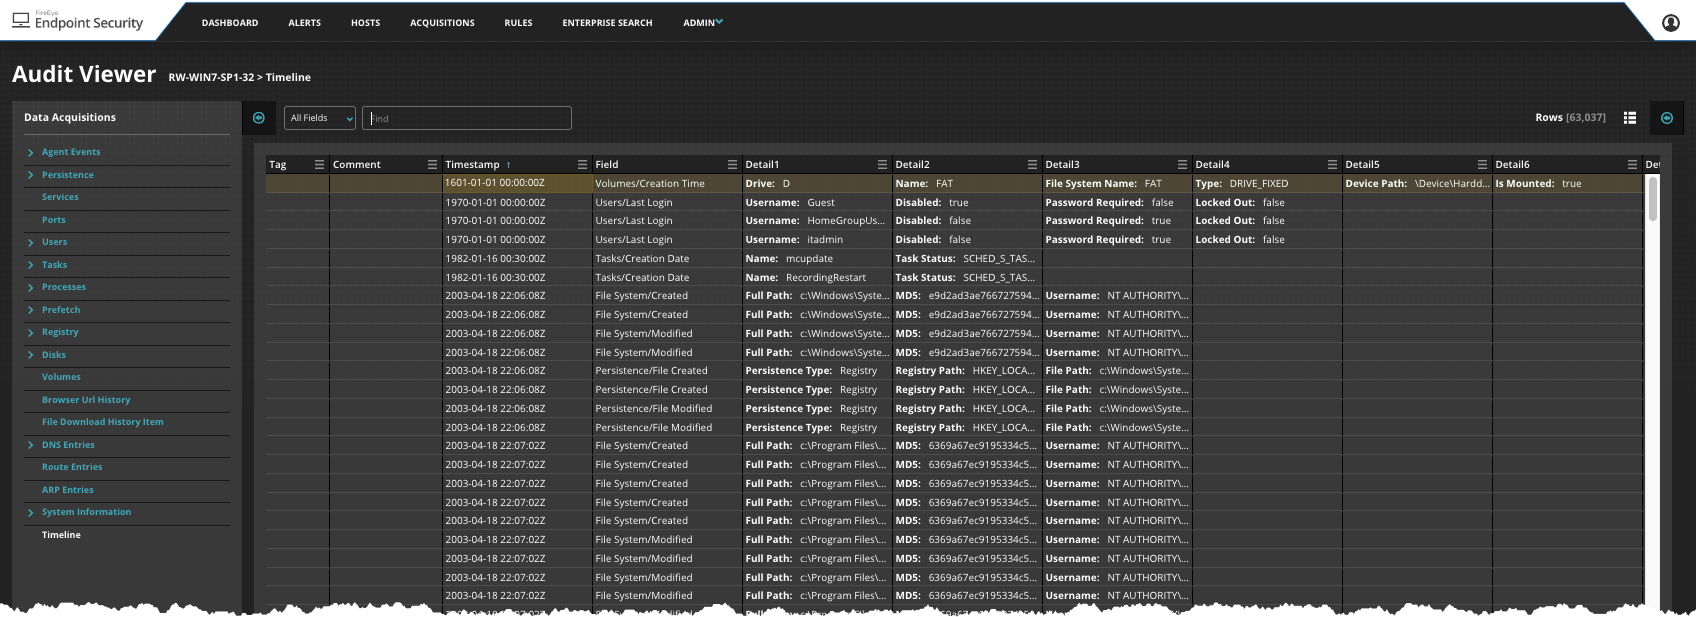
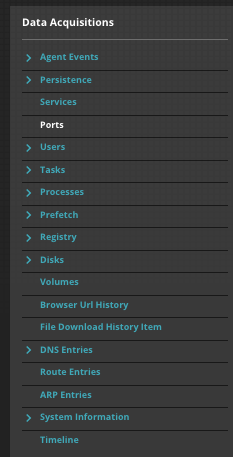
You can select other types of data in the acquisition to review. See Selecting data to review . The left column of the Audit Viewer lists the different types of data available for review. The data in this list depends on the type of audit data selected for the acquisition. The highlighted (black) item in the list identifies the type of data shown in the Audit Viewer.
The main section of the Audit Viewer shows the acquisition data in a grid.
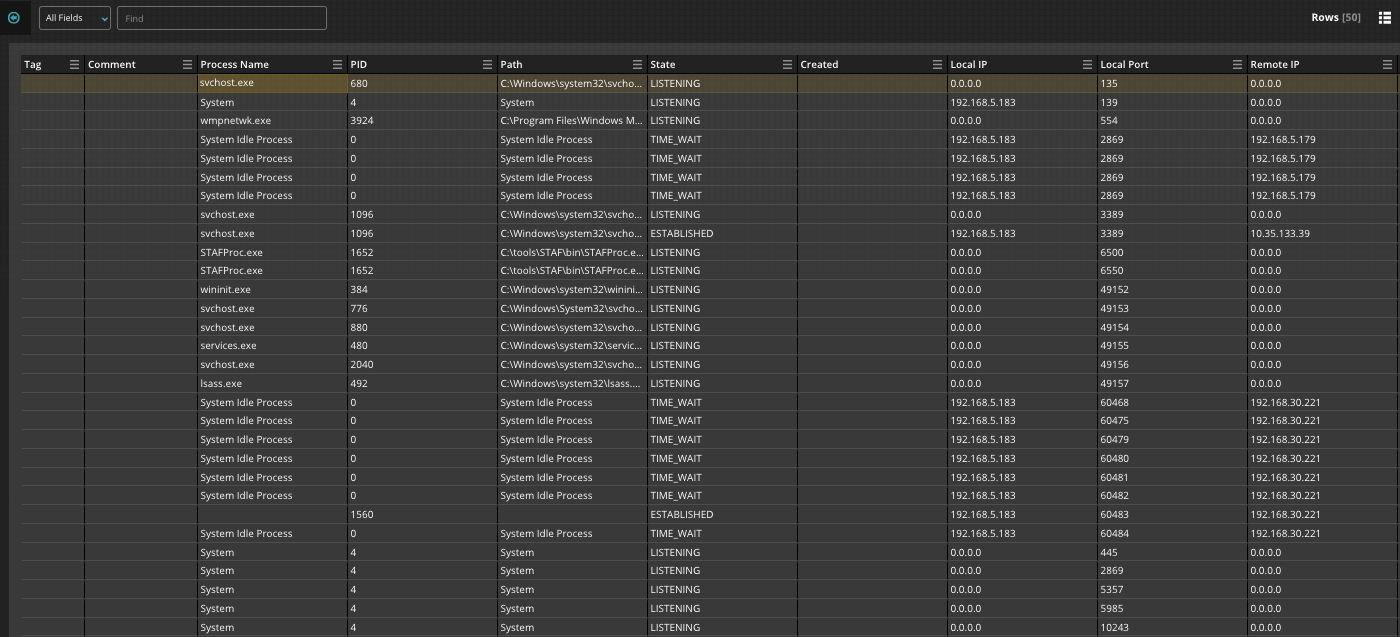
A search bar appears immediately above the grid.

A row at the bottom of the Audit Viewer page indicates how many pages of the selected data type exist in the acquired data.
Use the arrows on the right to page through the data.
You can also view detail information about any row you have selected in the Audit Viewer grid. See Accessing the Audit Viewer Detail pane .