The Overview graph allows the analyst to quickly understand the attack flow.

The analyst clicks each node from left to right to get a full understanding of the attack flow. In the collapsed view, the objects in the node are shown in a panel on the right along with the alerts that are related to them. The analyst can click links to drill down to other views. For example, clicking an asset in the Multiple Assets panel shows details about the asset, and clicking a related alert shows details about the most recent event associated with the alert.
The analyst learns the following by clicking the nodes:
Multiple Tools—Network Security and Endpoint Security (HX) appliances generated the alerts in the correlation.
Multiple Sources—Two hosts, the system user, and an IP address triggered the alerts.
Multiple Alerts—Multiple alerts were triggered by the sources.
Multiple Assets—The system user and two hosts were involved in the threat.
Multiple Artifacts—The artifacts that the asset could be prevented from interacting with. For example, a Microsoft Word executable that was involved in an Endpoint Security alert when a user downloaded and opened a malicious document.
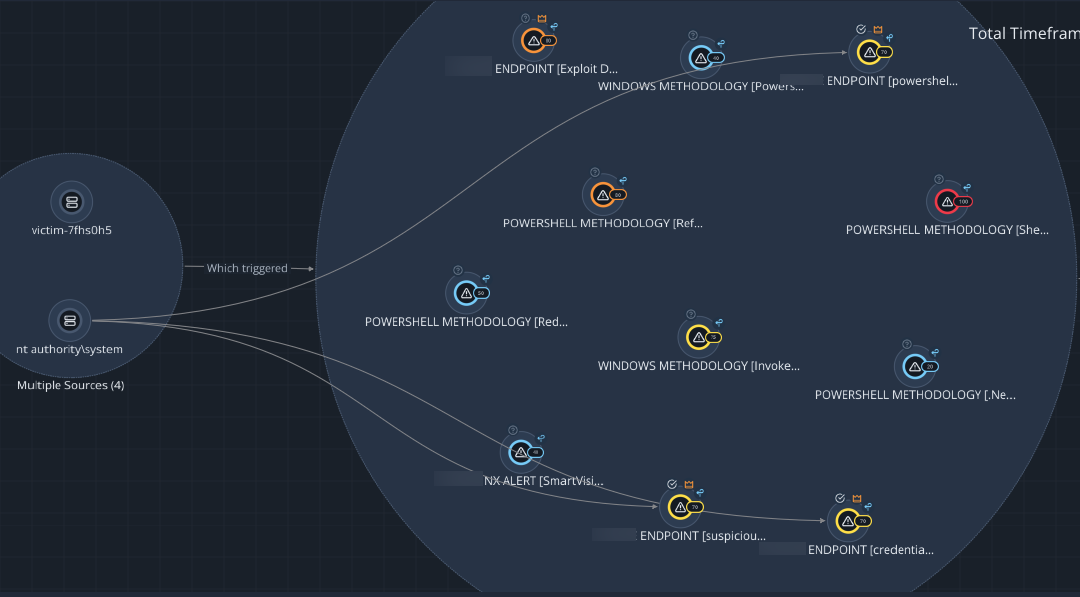
Double-clicking a node or clicking Expand All Nodes lets the analyst see connections to objects in adjacent nodes. For example, in the following illustration, the analyst follows the connections to find that the attacker infiltrated the "nt authority\system" user account to exploit PowerShell commands and scripts for execution. These attempts triggered three TRELLIX ENDPOINT alerts.
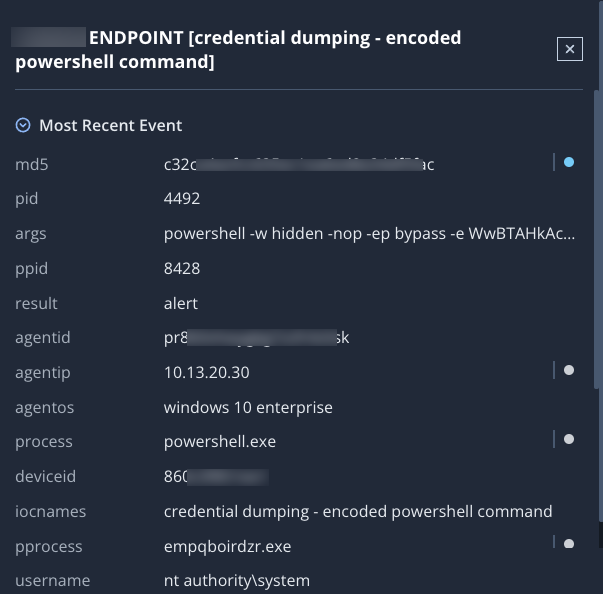
The analyst clicks one of the alerts and reviews the event details. The details include "powershell.exe" as the process, "10.13.20.30" as the agentip, and "nt\authority system" as the username.
Now the analyst follows the connection between that alert and assets in the Multiple Assets node. The alert involved one of the hosts with the agent hostname of "VICTIM-7FHXXX" (not shown in the truncated illustration above).
The Multiple Artifacts node shows the artifacts that may be prevented from further interactions. One of the artifacts is "winword.exe."
The analyst goes back to the Multiple Alerts node and clicks the TRELLIX NX ALERT and sees connections with the IP addresses in the Multiple Assets node. The event details include "t1020/data exfiltration" as the category and "10.13.20.30" as the source IP address.
Continuing to navigate through the chart and examining event details show the analyst that the same source IP address, agent IP address, and victim hostname are present in all of the alerts generated by the Endpoint Security (HX) and Network Security appliances. These are the most relevant things to consider in the attack scenario. They are the commonalities that create the alert correlation.
This information helps the analyst understand how the attack could have happened. For example, Joe opened a URL, which installed malware on his laptop. He shared the URL with Kiara, who also opened it. Both laptops are seen in the Network Security alert, represented by the source IP address (Joe's laptop) and destination IP address (Kiara's laptop).
Then Joe downloaded a malicious Word document from a browser and opened it. Joe's laptop (with the victim hostname) is being monitored by an agent running in the Endpoint Security (HX) appliance. The agent IP address was generated with the IP address of his laptop, which is seen in the Endpoint Security (HX) alert along with the victim hostname.