Use the Bar Graph widget to view the number of results for a particular field's value based on the query and enabled filters.
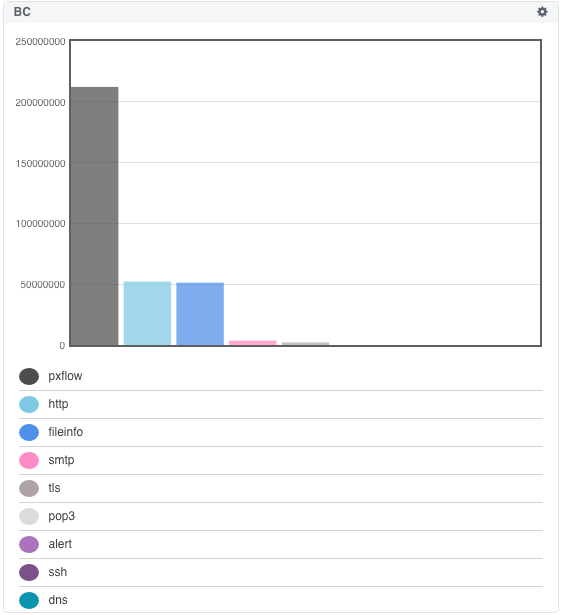
To add a bar graph to your dashboard:
From the selected dashboard, click the Add Component button and select Bar Graph.
Name the widget.
From the Field drop-down menu, choose the field.
Click Add Component to save the bar graph to your dashboard.
Click the search icon in the Query Bar to run your query and display the results.