Follow these steps to edit the graph sections of a custom report that have been generated for managed appliances using the Central Management System appliance Web UI. You can change the graph characteristics that you want displayed in the report section of a custom report that has been generated. When you change characteristics of the graph section of a new custom report, the updated report overwrites the existing report.
Note
You can edit the graph section of a generated custom report only using the Web UI.
Note
If you want to completely delete a section of a custom report, click Delete in the Configure Section page.
Note
To preview your report, click the toggle button ( ) in the custom report configuration page. Click the button again to return to edit mode.
Access to the Web UI of the Central Management System appliance as Admin, Analyst, or Monitor
You have defined the settings for the custom report using the Central Management System Web UI. For details about how to define the settings for the custom report, see Defining custom report settings using the Web UI .
You have generated one or more custom reports for a managed appliance using the Central Management System Web UI.
In the Web UI, choose Reports > Custom Reports.
In the Generated Custom Reports table, locate the custom report you want to edit.
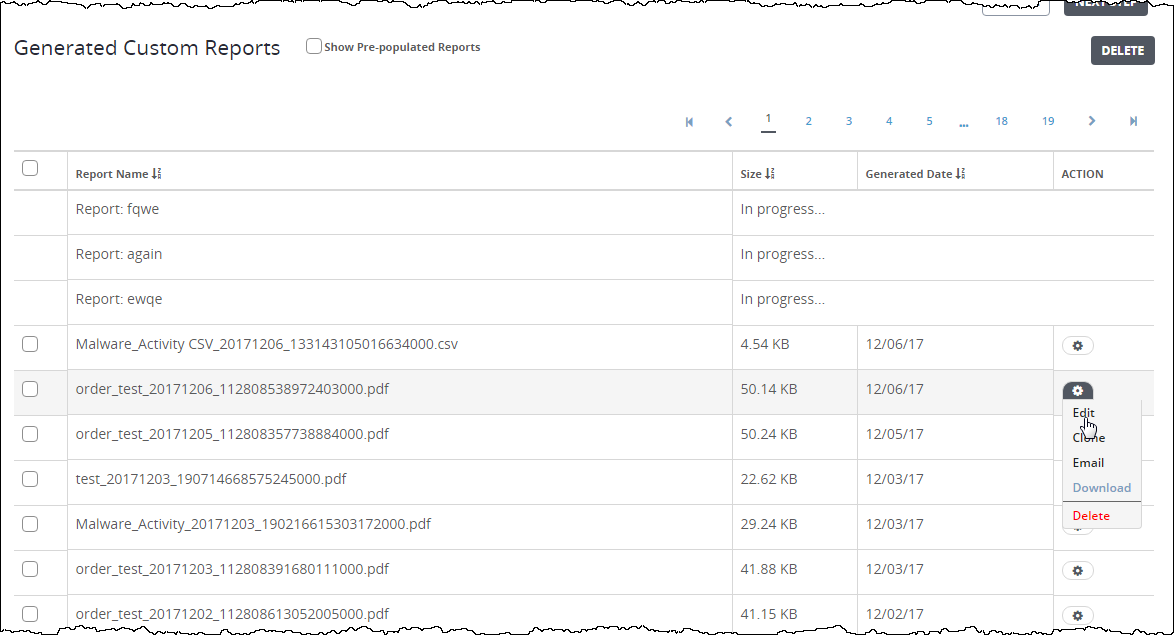
Click the action icon (
.png "CM_AlertMgmtAction_icon.png") ) in the Action column.
) in the Action column.Click Edit. Each section of the report appears in the custom report section configuration page.
For details about how to edit the graph section in a custom report, see Editing the graph section of a custom report using the Web UI .