The Logic Path Graph is a graphical representation of function call cross-references that Intelligent Sandbox discovers during dynamic analysis. You can use the report to view the executed and non-executed functions in analyzed files that occurred during dynamic analysis.
Warning
If you find non-executed functions, you must fix them immediately.
The Logic Path Graph report is available in the Graph Modeling Language (GML) file format. The file is in ASCII plain text format, which contains a graphical representation of the logic execution path of the sample in the GML (Graph Modeling Language) format. You cannot directly view this file in the Intelligent Sandbox web interface, but download it to your client computer. Then you must use a graphical layout editor, like yWorks yEd Graph Editor, that supports GML format. You can use such an editor to display the cross-reference of all functions using this file as an input.
You can download the Logic Path Graph file using one of the following methods.
In the Analysis Reports page ( → , click
.png "GUID-B5B4CEAC-0E1F-4067-9ABA-8A273A2EFCFF-low.png") and select Logic Path Graph. Then download the <file name>_logicpath.gml file. To use this option, you must have enabled the Logic Path Graph option in the corresponding analyzer profile.
and select Logic Path Graph. Then download the <file name>_logicpath.gml file. To use this option, you must have enabled the Logic Path Graph option in the corresponding analyzer profile.After you click
, select Complete Results. Download the <sample_name>.zip file. This .zip file contains the same <file name>_logicpath.gml file in the AnalysisLog folder. The Zip Report contains the <file name>_logicpath.gml file regardless of whether you have enabled Logic Path Graph option in the corresponding analyzer profile.
This section uses yWorks yEd Graph Editor to explain how to use the Logic Path Graph GML file. In the yEd Graph Editor, you must first set the Routing Style. You need to do this only once, and this setting is saved for further use.
To open the Logic Path Graph file, use your yEd Graph Editor.
Click → .
Click Edges, select Polyline from the Routing Style drop-down list, then click Ok.
When you open the <file name>_logicpath.gml file in yEd Graph Editor, initially you might see many rectangle boxes overlapping each other.
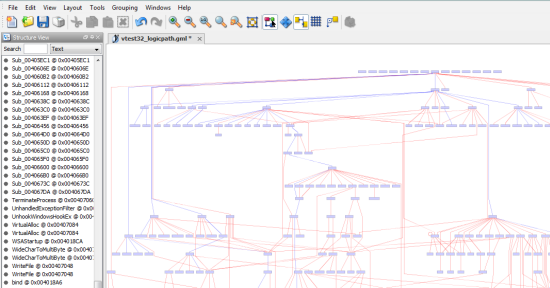
The graph depicts an overview of the complexity of the sample as seen by the cross-reference of function calls. The following shows more detail on the function names and their addresses as seen by zooming in.
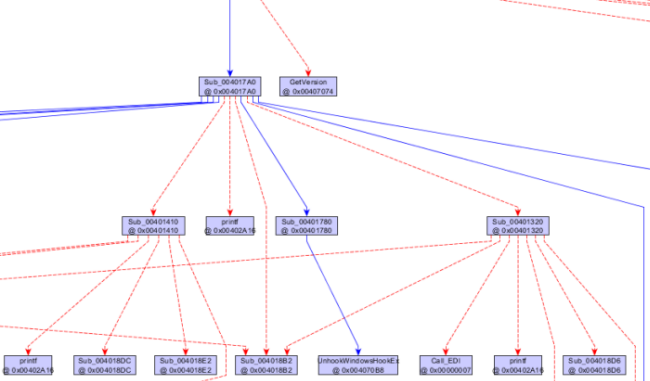
Two colors are used to indicate the executed path. The red dash lines show the non-executed path, and the blue solid lines show the executed path.
According to the preceding control graph, the subroutine (Sub_004017A0) at virtual address 0x004017A0 was executed and is shown with a blue solid line pointing to the Sub_004017A0 box. However, the subroutine (GetVersion]) was not called potentially as there is a red dash line pointing to it.
The Sub_004017A0 subroutine is making 11 calls as there are 11 lines coming out of this box. Seven of these 11 calls were executed during dynamic analysis. One of them is calling Sub_00401780 as there is a blue solid line pointing from Sub_004017A0 to Sub_00401780. Calls to Sub_00401410, printf, Sub_00401882, and Sub_00401320 were not executed and shown with red dashed line pointing at them.
The Sub_00401780 subroutine is making only one unique call as there is only one line coming out from this box. This call was executed during dynamic analysis.