You can monitor the status of an Intelligent Sandbox cluster in the Load Balancing Cluster Setting page or by using the lbstats command. After configuring cluster IP address, we can login using cluster IP address to access Intelligent Sandbox interface.
Log on to the CLI of the primary or a secondary node.
Run
lbstatscommand.Separate sections are displayed for each node.
lbstats output from the primary node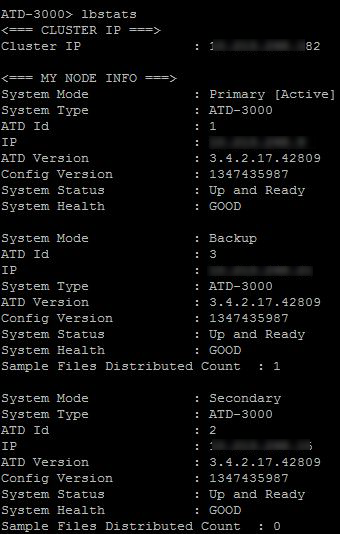
Above is the lbstats output from a primary node.
lbstats output from a secondary node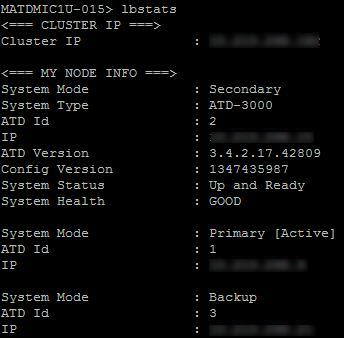
Above is the lbstats output from a secondary node.
lbstats output from a backup node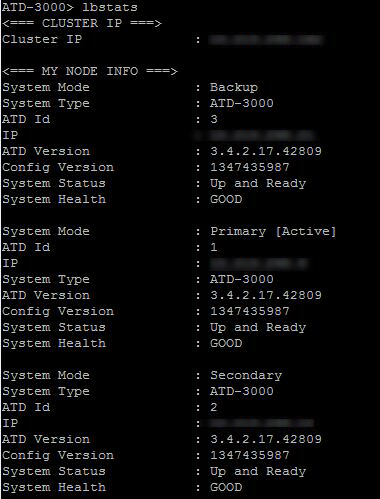
Above is the lbstats output from a backup node.
Details of the lbstats commandOutput entry
Description
System Mode
Indicates whether the Intelligent Sandbox Appliance is the primary or a secondary node.
ATD ID
The unique ID assigned to the node.
IP
The management port IP address of the Intelligent Sandbox Appliance.
System Type
The appliance model type. ATD-3000/3100/3200 or ATD-6000/6100/6200 or vATD.
ATD Version
Intelligent Sandbox software version currently installed on the node.
Config Version
The version of the configuration file currently on the node.
System Status
Whether the node is up and running.
System Health
Whether the node is in good or an uninitialized state.
Sample Files Distributed Count
The total number of samples distributed among the nodes, including the primary node. This count includes both files and URLs. This data is displayed only when you run
lbstatson the active node (Primary node or Backup node).