Know the health and status of your NDR and Packet Capture appliances in real time so you can quickly identify and resolve appliance issues and system failures. The NDR Health Status page allows you to monitor the global status of your small or large NDR ,IPS, NX, and Packet Capture deployments. The Overall Cluster Health chart provides details on the functionality of all your NDR, , IPS, and NX appliances with the Appliance Health Check table.
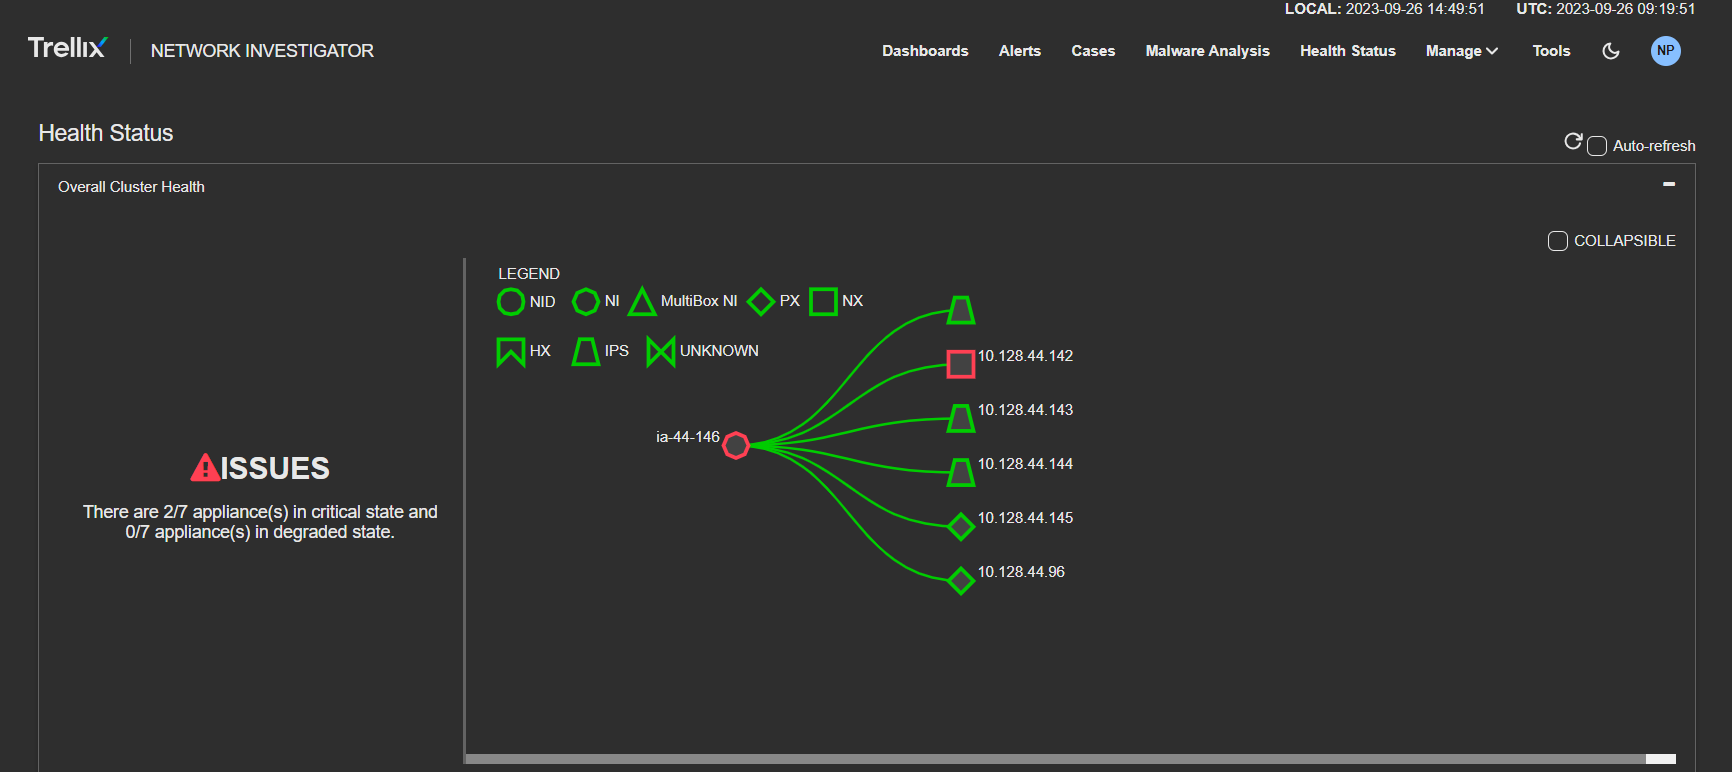
Overall cluster health chart
The Overall Cluster Health chart provides a visual summary of all the appliances in your deployment. Change the view of your Overall Cluster Health chart by using the collapsible checkbox to expand or collapse the appliances in your deployment. Obtain real-time status updates for all your appliances by setting your chart to automatically refresh. The table below describes each appliance type displayed in the Overall Cluster Health chart.
Legend | Appliance Type |
|---|---|
Circle | NDR Director |
Octagon | Single-Box NDR Cluster |
Triangle | Multi-Box NDR Cluster |
Diamond | Packet Capture appliance |
Square | NX Appliance |
Banner | Endpoint Security Server (labeled as HX) |
Trapezoid | IPS Appliance |
Bowtie | Unknown Appliance |
The chart provides the following visual information:
A health summary for all appliances in your deployment with a color indicator that represents appliance health
An appliance legend with unique shapes to represent the function of each NDR, Packet Capture, IPS, NX, and HX appliance
The health of each appliance in your cluster with color indicators
The connections between each NDR, Packet Capture, NX, IPS, and HX appliance in your deployment
The NDR, Packet Capture, NX, IPS, and HX appliance hostname or IP address
Health Color Indicators | Description |
|---|---|
Green | The appliance is fully operational. |
Yellow | The appliance is in a degraded state and requires attention. |
Red | The appliance has a device or connection failure and requires immediate attention. |
Appliance health check table
Drill down into the functionality of all your NDR, Packet Capture, IPS and NX appliances with the Appliance Health Check table. This table provides more details about each of your NDR and Packet Capture appliances, including status icons that show the current state of each appliance in your deployment.
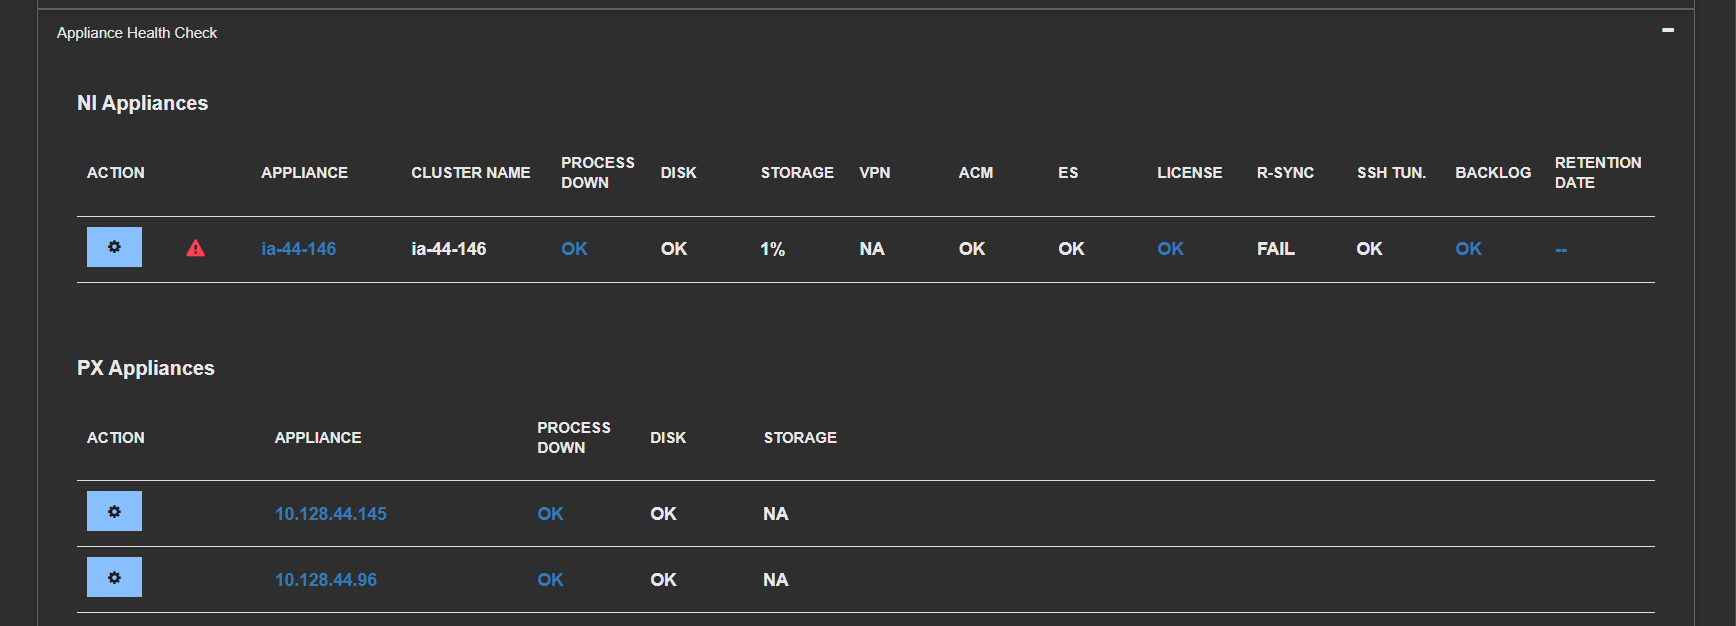
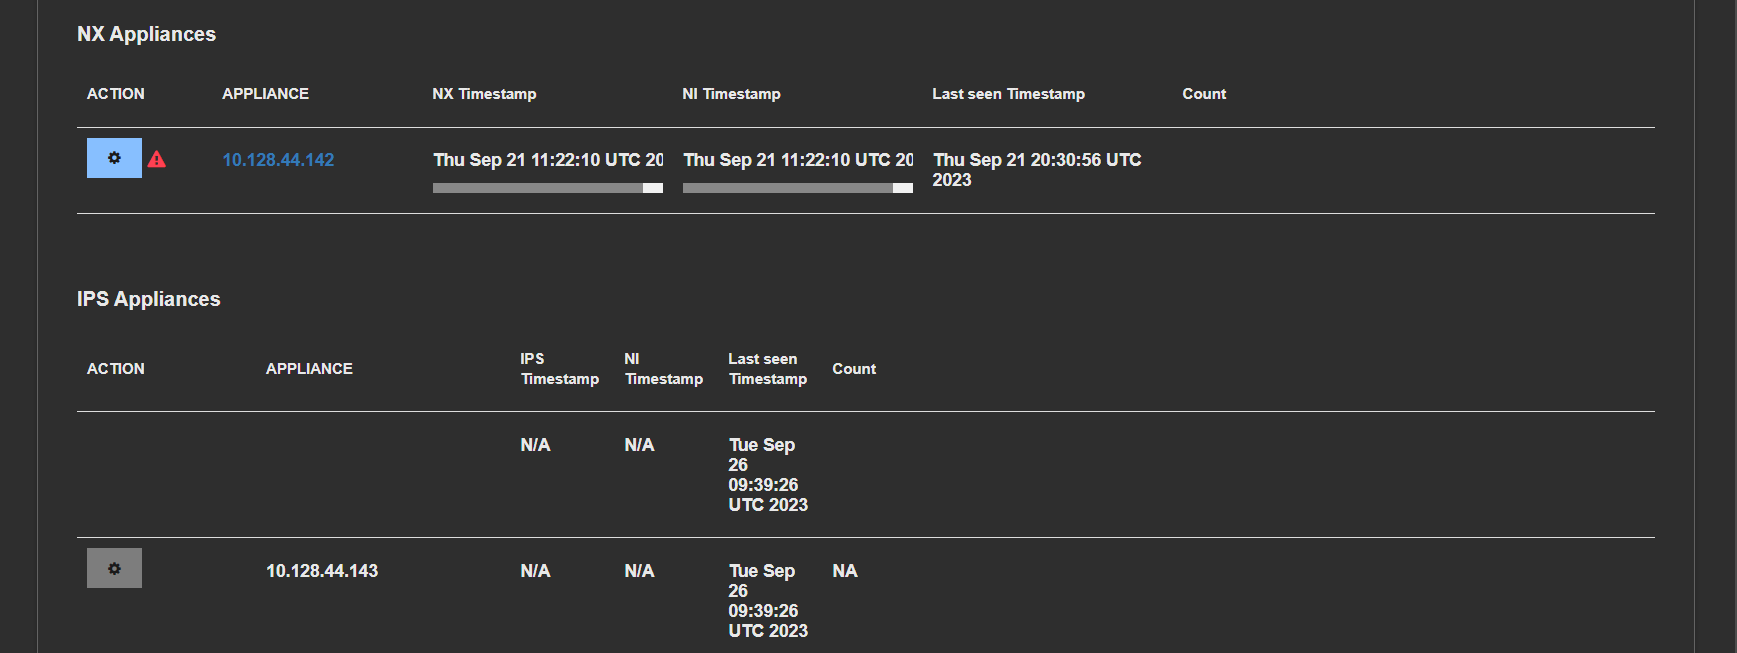
Health Status Indicators | Description |
|---|---|
Status Icon | The current state of your NDR, Packet Capture, IPS, or NX appliance.
|
Appliance Name | The name of your NDR, Packet Capture, and NX appliance. |
Cluster Name | The NDR appliance cluster name. |
Process Down | Indicates that a critical process is not running. FAIL indicates a problem with the critical appliance process. |
Disk FLR | The storage health. FAIL indicates a problem with the appliance storage or RAID controller. |
Storage | Displays the storage utilization. |
VPN FLR | Indicates the VPN connection health. FAIL indicates a problem with the OpenVPN connection. |
ACM FLR | The ACM health. FAIL indicates a problem with the NDR- Packet Capture authentication mechanism. |
ES FLR | Displays elasticsearch health. FAIL indicates a problem with Elasticsearch. |
R-Sync FLR | The health of your Packet Capture and NDR rsync connection. FAIL indicates a problem with the rsync connection between your and NDR appliances that prevents your IA appliance from receiving the PX metadata.
|
SSH TUN FLR | The health of the ssh tunnel between the Packet Capture and NDR. FAIL status indicates a problem with the SSH tunnel that prevents the NDR from receiving PCAP from the Packet Capture. |
Backlog | The backlog health. FAIL indicates a problem with the indexing pipeline. |
Use the Action button to view all the health statistics for a particular appliance or log into the appliance. You can view the following statistics in the Web UI:
NDR Indexed and Dropped Records
NDR Load Average
NDR Used and Free Memory Percentage
Elasticsearch File System Statistics
Elasticsearch Disk Usage
Packet Capture Streams
You can view the statistics based on the past hour, day, week, or month.
Select Appliance Health from the NDR dashboard menu.
Click the appliance icon in the Overall Health Chart or scroll down to the Appliance Health Check table and select the appliance to view more details.
Click the Actions button next to the NDR, Packet Capture, IPS, or NX appliance you want to investigate.
Click View Appliance Health Charts in the Action drop-down menu to open the Health Charts.