The Rule Coverage widget shows how well Trellix rules match the data your organization is collecting and suggests additional data classes that could be collected to improve Trellix rule coverage in your environment.
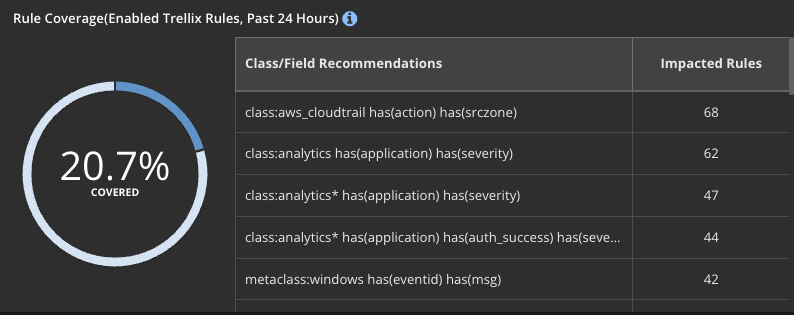
The percentage in this widget is calculated daily by dividing the number of enabled Trellix rules that matched incoming data by the total number of enabled Trellix rules. The pie chart is color coded to show the percentage of covered rules (lavender) and the percentage of uncovered rules (white). When you hover over one of the colors of the pie chart, the percentage in the middle changes to reflect the percentage for that color. By default, the percentage of covered rules is shown.
The list of recommended data classes represent the additional data that Trellix recommends your organization collect and send to Helix Enterprise to increase the data available for enabled Trellix rules to match. The list is taken directly from Trellix rule queries that are not matched effectively by the data your environment is currently collecting.
The data sent will determine how Helix Enterprise can be leveraged, and the use cases it can support. The purpose of this widget and recommendations for rules are to simplify your goal of matching more rules, and finding more evil.