NDR provides customizable dashboards, allowing analysts to focus on the metadata most relevant to them. For instance, one analyst might prioritize email and DNS metadata, while another focuses on HTTP metadata and trends.
The Web UI opens to the Detection page within the dashboard. The default dashboard displays widgets that provide an overview of the appliance's threat intelligence. You can navigate to other dashboards using the  icon (mega menu) at the top of the page.
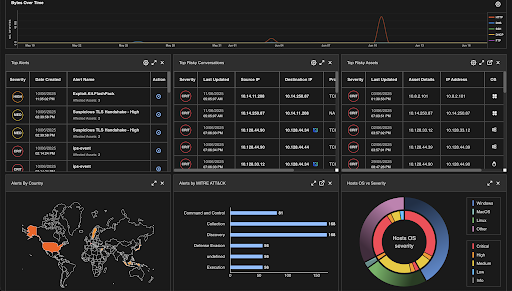
The dashboard consists of:
Option | Description |
|---|---|
Mega menu | An expandable menu ( |
Navigation menu | Displays the hierarchy of user navigation. |
Show | A dashboard filter provides the flexibility to analyze data based on varying timeframes, enabling you to effectively monitor and respond to charts, graphs, and alerts. You can search data for different timeframes (days, hours) using the Show filter.
For example, when you select a 30-day timeframe from the Show filter, the dashboard automatically adjusts all charts and data to display relevant information for that period. The charts and data dynamically update based on your selection, ensuring you see alert data, charts, graphs, and trends for the specified timeframe.
|
Back theme toggle button | The default background display theme is dark. To set the light background, click |
Dashboards | The Dashboard displays key metrics and links to help you quickly access information about threat-related activity on your appliance. The Dashboard page is categorized into:
|
Widgets | Provides a summary view of the threat intelligence gathered by the NDR appliance |

