This topic describes basic concepts about threats in HE .
Correlations and alerts
A threat can be either a correlation or an alert. A correlation is a group of related alerts.
Correlations are denoted by a folder icon
 .
.Alerts are denoted by a triangle icon
 .
.
Risk score rationale
Risk score rationale is displayed on context cards. To open a context card and see the factors behind the assigned risk score, hover over the correlation or alert icon on the Dashboard, Threats page, Correlations Details page, or Threat Details page.
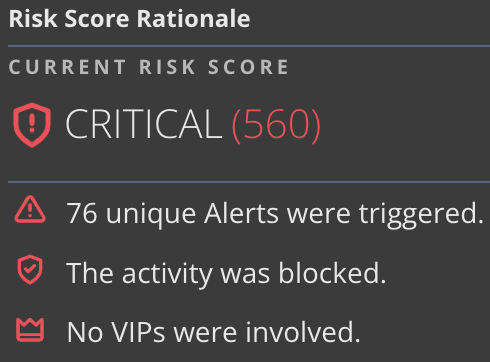
Table graphs
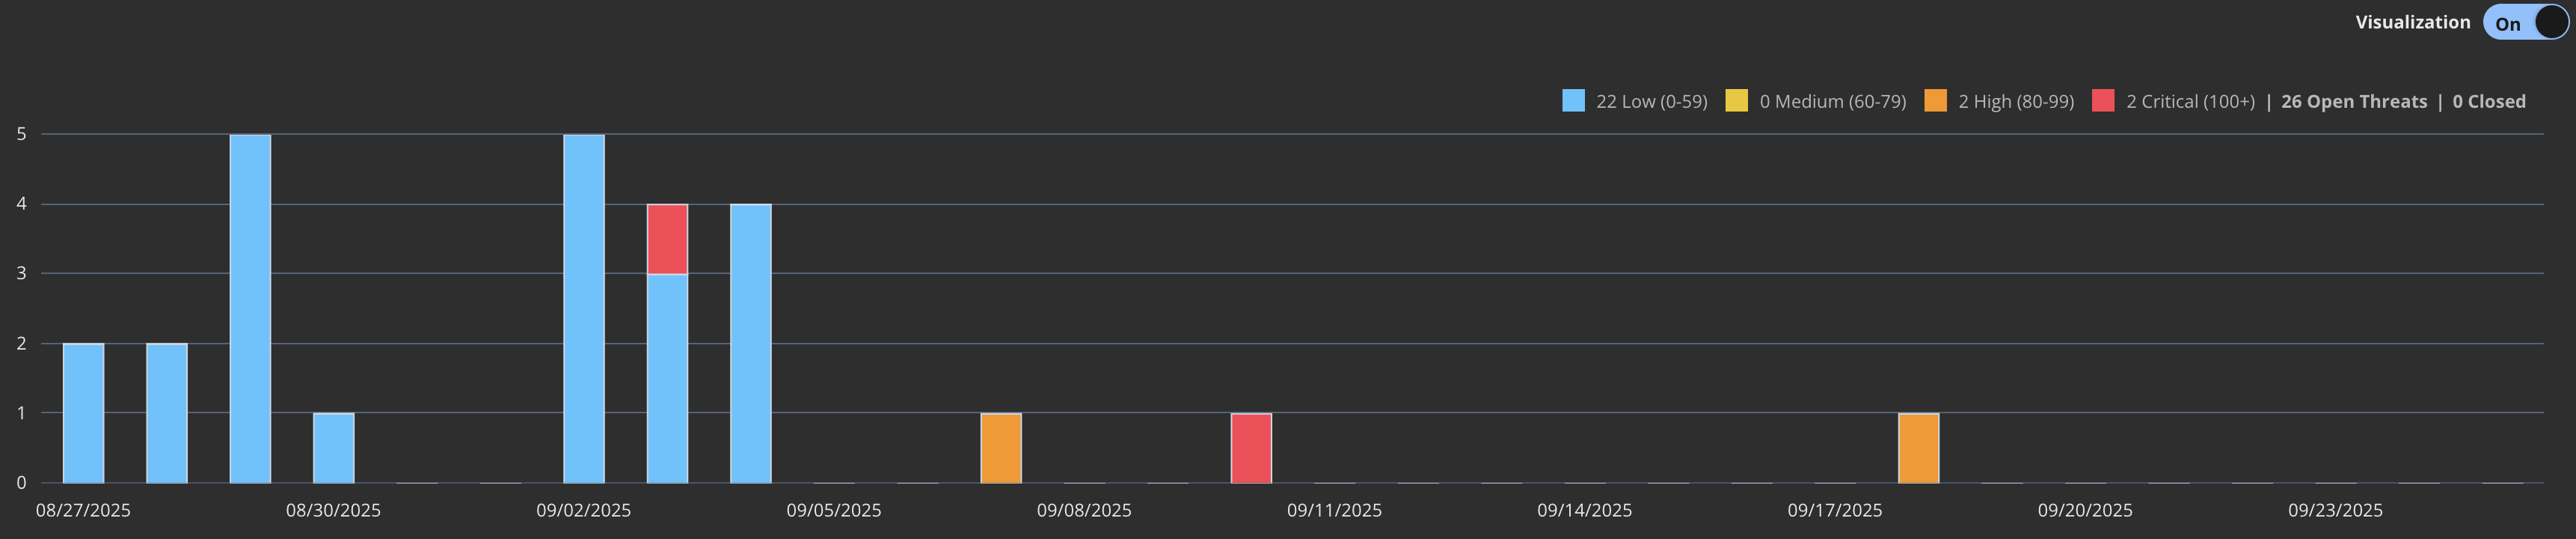
The Threats page includes a graph that displays the data in the table below it. To hide or show the graph, toggle the Visualization switch.
Threat graphs
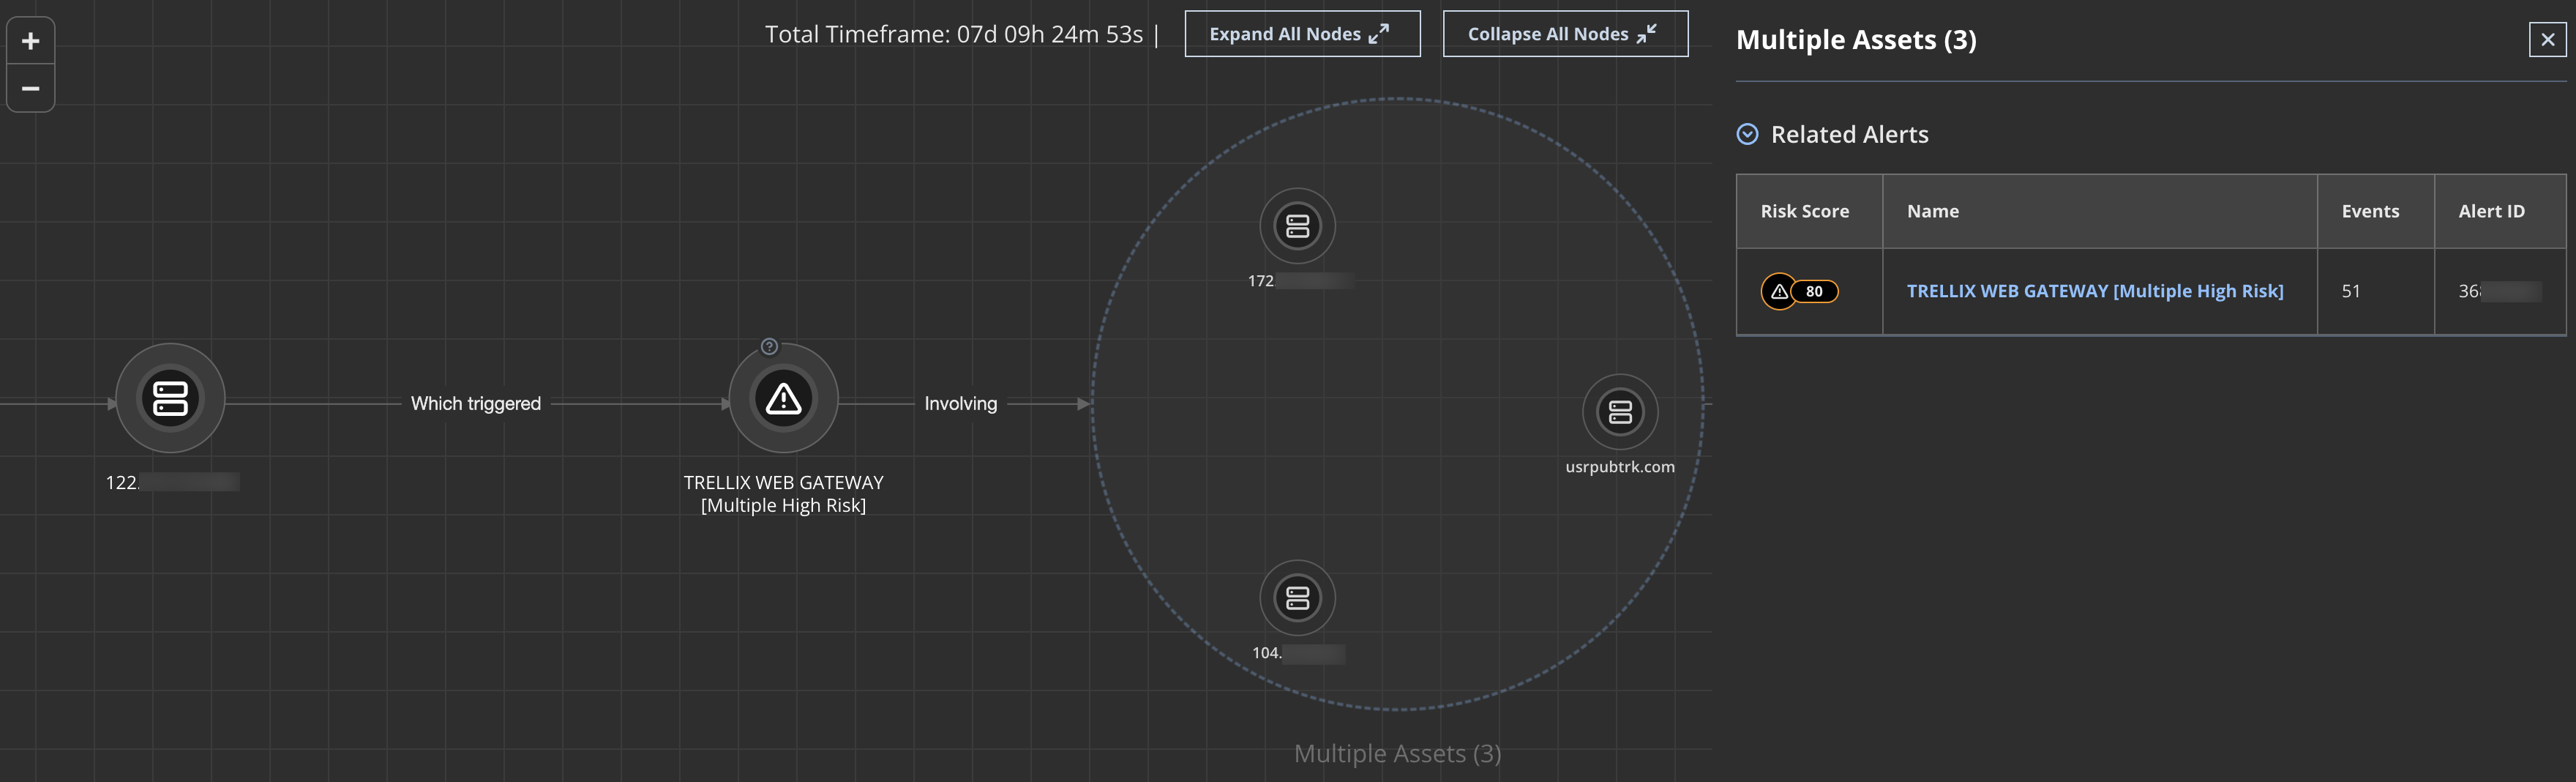
Threat graphs display a summary of an incident and allow you to zoom into the details of the execution in the environment for further threat hunting. The graphs connect the dots between Trellix and third-party alerts. By default, the graphs have collapsed nodes.

You can expand a node to see details. When you click a collapsed or expanded node, the context details open on the right side of the graph.
Assets
An asset can be either a user or a host.
Users are denoted by a person icon
 .
.Hosts are denoted by a computer monitor icon
 .
.