When you prioritize a threat for investigation, EDRF provides situational awareness and metadata details to improve confidence. Based on the threat impact and investigation, you can respond to threats by containing or remediating it.
By analyzing the threat details, attribute, impact, activity, and EPP events, you can investigate the attack life-cycle details such as suspicious external network connection, increased authorization level, data exfiltration, encryption of the data, etc.
Select a threat from the threat list. By default, the threats are sorted by ranking. However, you can sort threats by time. Rank is the measure of confidence about a detected threat's severity and how malicious it is.
Analyze a threat based on the following details.
Threat details
You can analyze the following details for the initial investigation.
Threat ID
Initial trigger details
The first and the last time the threat was detected, the current threat is the last time it was detected.
The number of impacted endpoints
Age — The time from the last detection
Export Threat Details from the Monitoring Dashboard
The EDRF monitoring dashboard allows you to export threat details into a .csv file for analysis. You can export the file in multiple time zones.
The exported .csv file enables you to compare, differentiate, and save threat details to enhance your understanding and facilitate future reference. This allows for a more comprehensive analysis and documentation of threats, aiding in both immediate response and long-term security strategies.
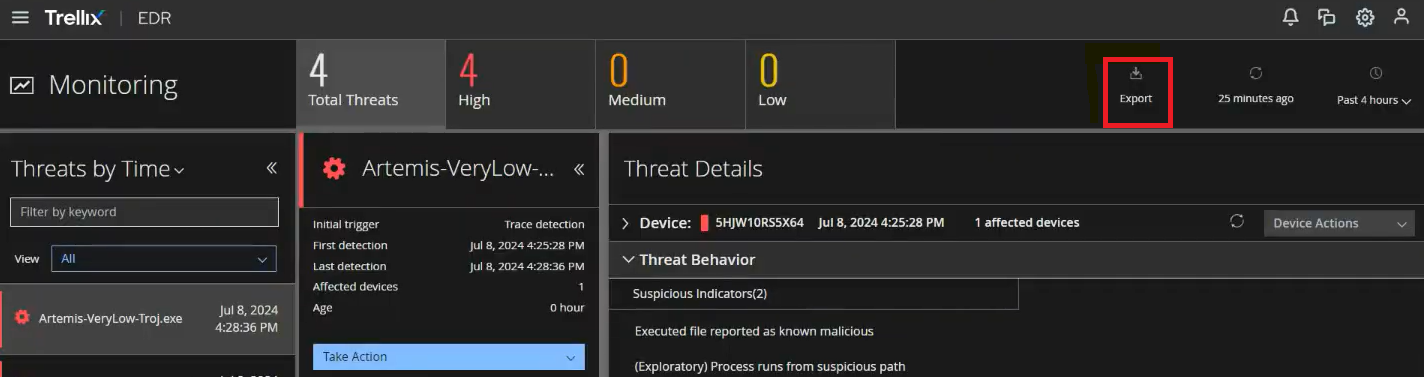
The exported .CSV file contains the following details:
Threat Name: The name associated with the threat.
HostName: The host or machine name where the threat was detected.
Threat Type: The type of threat.
Severity: The threat priority is classified as S0 through S5:
S4, S5: High priority
S2, S3: Medium priority
S1: Low priority
S0: Informational (no priority)
Tag Name: The MITRE tag associated with the threat.
Note
There can be multiple MITRE tags associated with a single threat.
First Detection: The initial instance when the threat was detected.
Last Detection: The most recent instance when the threat was detected.
If a single threat occurs multiple times on a particular host, these instances are grouped together, and the threat details from the latest occurrence are included in the exported .csv file.
The exported .csv file will include threat details based on the selected time frame in the monitoring dashboard. The date range for export available to the user is based on the data retention policy configured for the tenant.
Note
The export option is not visible in the EDRF Monitoring dashboard if there are no threats present for the selected time frame.
Impacted endpoints
You can check the number of impacted endpoints that have triggered detection for the selected threat. Each endpoint has an indication number within parenthesis which shows the number of times the threat was detected on that endpoint. If an endpoint has triggered more than one detection, the endpoint name can be expanded to show details such as activity date, severity, etc. for each detection. These can be endpoints where the threat is detected or has been detected in the past.
Severity of the threat is same as that of the highest severity detection under the threat. Some detections can have a lower severity than that of the threat. The detection data would get removed once the retention period is over. However the corresponding threat’s severity shown on the Monitoring page is always the highest severity detected so far.
When you select a threat, the time frame you choose is reflected in the Device section of the Threat Details pane. You can see the devices that had activity only during the selected time window. You can extend the time window to see other devices where activity was detected outside the current time window. The time frame can range from 4 hours up to the maximum retention time.
Note
The EDRF Client generates a unique Agent ID for each endpoint. The interface displays the Agent ID only when the endpoint runs on the EDRF Client and is connected to the Endpoint Security (HX) server. The field remains blank if the endpoint is disconnected.
You can check the historical traces of the selected endpoint to analyze the historical data to understand what historically happened on the endpoint. For details, see Searching historical device data.
For details about containing threats using the quarantine an endpoint method, see Contain threats.
Threat behavior
You can analyze techniques and tactics used by adversaries and the suspicious indicators about a threat. The indicators shown are the reason for reporting a specific process as a threat.
Techniques observed by MITRE ATT&CK™ Matrix — The observed behaviors are aligned with the MITRE ATT&CK™ framework. EDRF identifies Techniques and Tactics as defined by MITRE.
Suspicious Indicators — The indicators that triggered the detection of the event or process as a suspicious entity are added to the threat list.
Mapping of Techniques Observed and Suspicious Indicators
EDRF maps techniques observed and suspicious Indicators to specific events in the Process Activity pane to understand the evidence that supports the behavior described for a threat. This helps you understand which events have triggered the suspicious Indicator and the reason behind the activity being monitored.
Process Activity
In Process Activity, you can analyze how the threat started on a particular endpoint, what other processes the threat started, and how those processes moved through each endpoint in your environment over time.
You can see the process tree, the root process, and their child processes in different views for better data visualization:
 | Summary View | The Summary View is the default view. This shows the process tree of the detected process including parent and child processes. Selecting any process within the tree shows details such as parent process name, command-line path, the user account name, and the time the alert was added to the threat list. |
 | Sequential View | The Sequential View displays a sequential view of all events or processes executed in the devices. This view does not display the time when these events or processes are executed. |
 | Time View | The Time View displays a timeline view of the process activity. You can view when a specific event or process is executed. An activity timeline along the top of the process activity pane shows activity spikes, and enables you to select the time frame to view in the process activity chart. Use the mouse scroll wheel to zoom in or out of a particular view. |
 | Table View | The Table View changes the current process activity view to a table view. |
 | Filter events | Using Filter events, you can filter by event types such as Processes, Files, Registry Keys, and Network Connections.
|
You can check and analyze event types and their attributes such as process, file (attributes such as name, path, MD5, SHA-1, SHA-256, etc.), network (attributes, protocol, source IP address), registry keys, etc. associated with threats. This information helps you analyze the attributes that executed the suspicious activity. Also, this can help in identifying a process and other artifacts such as file, registry, command line, etc. that are common to an organization and can help in concluding that the threat is of high or low impact. The following event types are represented with different icons to easily identify them.
Processes
Files
Registry Keys
Network connections
Process Hollowed
WMI Script Executed
Image Loaded
API calls
DNS query
Note
On Linux endpoints, the supported event types are Process, File, and Network connection. On mac endpoints, Process and File types are supported.
For each event category, the respective attributes are shown. You can search for the particular attribute on the same endpoint and also across the environment. This helps to determine the complete impact of an artifact on the environment. The table has the details of event categories, attributes, and links to search across the environment.
Select an event to display the details and investigate the suspicious activity. A numbered badge on the event icon indicates multiple instances of the same event. Clicking an event in the timeline opens the event details pane.
Event details are shown in the Event details pane with information about events such as event type, time stamp, and behavior observed.
Based on the selected event, the details are shown as below:
Event Type – Shows different types of events such as Process Started, Key value created, etc.
Event Time Stamp – Shows the detection time recorded on EDRF.
Type – Shows different types of process started on Linux and mac endpoints.
Fork — Creates a new process that is a copy of itself. The forked process gets a new process ID.
Exec — An existing process that replaces the current process image with another one. The process ID remains the same.
Fork+Exec — When the parent forks a child and subsequently performs an exec to refresh the process image. The exec is performed immediately after fork.
The following list has the available attributes for each event category and action details.
Category | Link item (attribute) | Action |
|---|---|---|
Process Reputation info | Reason | Find untrusted modules loaded by this process in this device You can find the untrusted process images and files. |
Process info | Name |
|
Process ID | Displays the unique identification number of the process. | |
Integrity Level | Represents the level of integrity of the process. | |
Command line (copy icon) | Copies the command-line path. | |
Command line (path) |
| |
File info | Name Path MD5 SHA-1 SHA-256 Created on Last modified on Size
|
|
Registry info | Key path Key value name Key value data Value type |
|
Network info | Protocol Source IP address Source Port Destination IP address Destination Port Direction DNS Names |
|
User info | User name |
|
Injector process info | Name Path MD5 SHA-1 SHA256 |
|
Injector user info | User name |
|
File reputations
The file reputation indicates whether a file is malicious or trusted. Trellix Threat Intelligence Exchange (TIE) determines a file’s reputation by analyzing its content from several sources and making an informed decision. The reputation helps you in identifying malicious files to respond to associated threats.
On the Monitoring dashboard, TIE shows the reputation of a file as Trusted, Malicious, or Unknown based on its content and prevalence of file (how long a file exists in the environment).
Malicious — If the file reputation shows as malicious, you can consider to respond to an associated threat. For details, see Respond to threats.
Trusted — If the file reputation is trusted, you can dismiss or exclude a threat from the threat list. For details, see Dismiss threats or Exclude threats from the threat list.
Unknown — If the file reputation is unknown, TIE queries Trellix GTI for reputation automatically. If the reputation is not present in Trellix GTI, TIE can integrate with Intelligent Sandbox for sandboxing analysis of a file. For details, see Submitting file samples.
Once TIE submits a file sample to Intelligent Sandbox and the assessment is done, EDRF shows reports as download IOCs and full report. You can download reports that are already generated by Intelligent Sandbox. The full report consists of risk score and conviction details.
Note
This integration is supported only on Windows endpoints.
Based on a file's conviction and risk score, the higher the risk, the more malicious a file is. This reputation helps you make an informed decision in responding to a threat.
Note
Download IOCs option is available only if the Risk Score is 3 or higher.
EDRF supports only:
TIE 2.3 or later
bridged scenarios
Intelligent Sandbox 4.8.x or later
a single appliance of Intelligent Sandbox in a single ePO - On-prem
EDRF does not support a multi-cluster Trellix EDR setup.
Note
TIE and Intelligent Sandbox reputation information is available only with On-premises extension 3.2.0.1 or later. This feature is not supported on ePO - SaaS.
TIE and Intelligent Sandbox reputations are used as an extra integration with EDRF to increase the confidence of security analysts when responding to a threat. These reputations are not considered during threat prioritization.
Note
TIE and Intelligent Sandbox data information is only available for the EDRF administrator role.
The reputation cards are displayed only if a reputation for the hash in TIE or Intelligent Sandbox is available respectively. In case there are any integration issues with Trellix EDR, see Check configuration status of TIE and Intelligent Sandbox