During the investigation, when you know the specific endpoint impacted due to a malicious activity, you can use the EDRF Device Search capability to search for malicious artifacts on a single endpoint. The results shown are categorized into different artifacts such as processes, CLI & script content, executable files, network connections, etc. with the number of records present in the endpoint. This level of customized information related to the impacted endpoint helps SOC in the investigation.
You can search for an endpoint data by typing an endpoint name and perform a search for the activities in a specific time frame.
Log on to Trellix EDR.
Navigate to Menu → Device Search.
Alternatively, to open the Device Search dashboard:
Select Menu → Monitoring.
On the Monitoring dashboard, from the Threats by Ranking / Threats by Time pane, select a threat whose details you want to view.
In the Devices pane, click the three dots next to the device to view the trace data.
Click the Show historical device trace for <device name> link.
The Device Search dashboard lists all processes running in the device within the past 4 hours to the maximum retention time.
In the Search drop-down menu, search for endpoints using Device Name, Agent ID, or GUID.
From the Detection window drop-down menu, select the time frame in which you want to view the historical data. The default Detection window is 24h before - 24h after.
Note
If you select Custom in Time Range, you can manually choose year, month, day, and hour.
Filter your search results using the Include and Exclude filters. You can type keywords that you want to include or exclude in your search query.
Starts with and Exact filters search over the whole retention period.
Contains filter limits the search to a 24-hours period.
Not all columns in each bucket are searchable.
On the grid, you can hover over the column headers and click on the menu icon to perform these activities:
Pin Column — Pin a column to the left or right. You can click No Pin to unpin a column.
Autosize This Column — Auto size a particular column
Autosize All Columns — Auto size all columns
Group by Trace time — Group columns by trace time. You can use Un-Group by Trace time to un-group the Trace time column.
By default, all the columns are displayed on the grid and you can group and ungroup all columns.
Reset Columns — Reset columns to the default view.
Filter... — Filter results within a column.
The available logical operators and options for the Date type of columns:
Options — Equals, Greater than, Less than, Not equal, In range
Logical operators — AND and OR
The available options and logical operators for the String type of columns:
Options — Contains, Not Contains, Equals, Not equal, Starts with, and Ends with
Logical operators — AND and OR
The available options and logical operators for the Numerical type of columns:
Options — Equals, Greater than, Less than, Not equal, In range, Greater than or equals, and Less than or equals
Logical operators — AND and OR
The available options and logical operators for the Boolean type of columns:
Options – Equals and Not equals
Search... — Search and select column headers to add multiple columns to the grid.
You can add or remove columns to the grid using Search....
For more details about filtering operators and sorting options in Device Search and Historical Search, see the Trellix Knowledge Base article, Filtering and sorting updates for Historical and Device Search Dashboards in the EDR - KB96644.
You can also perform these activities on the grid:
Sort columns in ascending or descending order
Drag columns to set row groups
Move or rearrange columns to the left or right
To display specific data, use the buckets displayed under Artifacts:
Processes — Lists the processes that are running in the device. A new Process Integrity column is now implemented that rates the current process's integrity.
CLI & Script Content — Lists information about PowerShell commands or script blocks executed in a PowerShell console or script.
Important
The default events collected can be reduced through filtering according to customer value through content changes. To enable the collection of all events without filters, there is a new configuration option:
Log on to Trellix EDR as administrator.
Go to the Configuration page.
Under Finetune configuration, select Customize data to collect.
Select the Enable verbose collection of CLI & Script content checkbox.
Enter your Device and Period, then click Save.
Executable Files — Lists the executable files on the device. The Activity column indicates when a file is read, moved, executed, modified, deleted, or changed. File extension and EPP related columns are neither sortable nor searchable by Include and Exclude filters.
From the results displayed on the Process Name column, you can hover over a process name and copy the absolute path to search using the Include filter. The result might include other traces for which the absolute path matched with different fields.
Note
When an executable file is run, an icon appears next to the file name with information generated by EPP: action taken, reason, and endpoint product that carried out the action.
Non Executable Files — Lists file events that are not Portable Executables, scripts, or file archives. File extension column is neither sortable nor searchable by Include and Exclude filters.
Archived Files — Lists the files that were archived. For example, .zip, .rar files. File extension and EPP related columns are neither sortable nor searchable by Include and Exclude filters.
Scripts — Lists the scripts written on the device. File extension and EPP related columns are neither sortable nor searchable by Include and Exclude filters.
Dual-Intent Tools — Lists the processes executed through hacking or administration tools installed on the device. PowerShell is an example of an administrative tool.
Services — Lists the Windows and Linux services added, removed, or modified in the device. Service Type and Start Type columns are neither sortable nor searchable by Include and Exclude filters.
Network Connections — Lists the number, type, direction (inbound or outbound), and port of network connections on that device. You can also see network information related to Layer 7 such as URL, Verb, Protocol, and DNSs.
Note
Certain events for network connections on ports 80 and 443 are not displayed by default. To view all events related to ports 80 and 443, you can use the Customize data to collect option in the Configuration menu. For more information, see the EDRF Installation Guide.
Windows Registry Keys — Lists information related to Windows registry key values in a device monitored by EDRF.
Note
An icon appears next to the registry key name with information generated by EPP: action taken, reason, and endpoint product that carried out the action.
Scheduled Tasks — Lists the scheduled tasks on Windows that were changed.
DNS Requests — Lists the DNS requests made by the device.
User Logon Activities — Displays frequency of the user logon sessions on the device.
Loaded DLLs — Lists the DLLs that are loaded by processes. By default not all DLLs are sent to the cloud, but you can set the EDRF policy (from ePO - On-prem or ePO - SaaS) to send all DLLs loaded by monitored processes. In the Loaded Modules column, you can click the Show all DLLs link to display the complete list of modules.
User Account Activities — Lists the account created date, account type, target account name, and target domain of the user.
API calls — Lists information about Windows APIs used by processes monitored by EDRF.
WMI Activity — Lists the activities performed by Windows Management Instrumentation (WMI) service for messages that EDRF captures. Registry Type column is neither sortable nor searchable by Include and Exclude filters.
Endpoint Protection Activity — Lists the EPP activity triggered on Windows device. The following information is displayed:
Date
Process ID
Action executed
Reason
Endpoint Product
Detections and Alerts — Lists specific behaviors detected in the environment with different levels of confidence. Confidence is assigned by a detection engine based on the severity of a threat.
Alerts — Lists specific behaviors detected in the environment with high confidence alerts.
Analysis Options for Artifacts — Each artifact under Ask Wise functionality in Device Search dashboard comes with a set of analysis options for performing detailed threat analysis. By default, the following analysis options are available for each artifact:
Brief me on related MITRE TTPs
Tell me about related breaches
Generate a knowledge graph
Provide more detail
Suggest some recommended actions
Draft an email
For a select number of artifacts, additional predefined analysis options are provided alongside these default options as mentioned below.
Artifact
Analysis options
Processes
Analyze Process, Analyze Script Content
CLI & Script Content
Analyze Process, Analyze Script Content
Executable Files
Analyze Files
Non-Executable Files
Analyze Files
Archived Files
Analyze Files
Scripts
Analyze Files
Network Connections
Analyze Network Connections
Windows Registry Keys
Analyze Registry Keys
DNS Requests
Analyze Network Connections
Loaded DLLs
Analyze Loaded DLLs
API Calls
Analyze Windows APIs
Click Export All to export data for the selected artifact in .CSV file format.
Note
The maximum data you can export is 100K results or file size with 500 MB, whichever is lesser for all artifacts except Detection & Alerts and Alerts. For Detection & Alerts and Alerts, you can export data up to 10K results.
You can use the historical data to analyze a threat by tracing its behavior from the past 4 hours to the maximum retention time.
Analyze threats using Trellix Wise
You can leverage the Trellix Wise feature in the Device Search dashboard to enhance threat analysis and refine search results for improved accuracy. Each tenant is allocated a predefined quota limit based on the Trellix Wise quota purchased for that specific tenant. See Quota Management System for details.
The Ask Wise functionality in the Device Search dashboard allows you to enter the details of a specific device, generating a list of results for the respective artifacts. This feature is limited to a single device/endpoint.
Note
For a conclusive analysis, we recommend to filter the results based on the timestamp under the chosen artifacts.
To perform analysis in Device Search dashboard using Ask Wise:
Tip
The Device Search pane can be accessed by selecting the option available under Threat Details on the Monitoring dashboard or from the EDRF Menu.
Navigate to the Device Search dashboard from either the Monitoring Page or the EDRF Menu and enter the details pertaining to the device under analysis.
The search results for the respective artifacts are populated. Refine the search to the specific time frame when the threat occurred for more precise results.
Right-click each row/event under the respective artifact and select Add to Wise Analysis which adds the event to the cart. Once you add the required events to the cart, select Ask Wise. A navigation pane for analysis is displayed with the added events. You can minimize or expand the navigation pane while performing other analysis in the Device Search dashboard without any loss of data.
Note
You can add a maximum of 25 events, regardless of the artifact chosen for analysis. Once you have added 25 events to the cart, a yellow prompt appears, indicating that you have reached the maximum limit.

The system highlights the selected events for an artifact, and each selected event is shaded in grey to prevent users from selecting the same event more than once.
You can deselect events in the navigation pane to analyze a different event.
Note
The system prohibits duplicating events for analysis with Ask Wise. When a user selects events under a specific artifact, they are initially highlighted in grey. Upon navigating back to the same artifact after selecting a different one, it will be highlighted as shown.
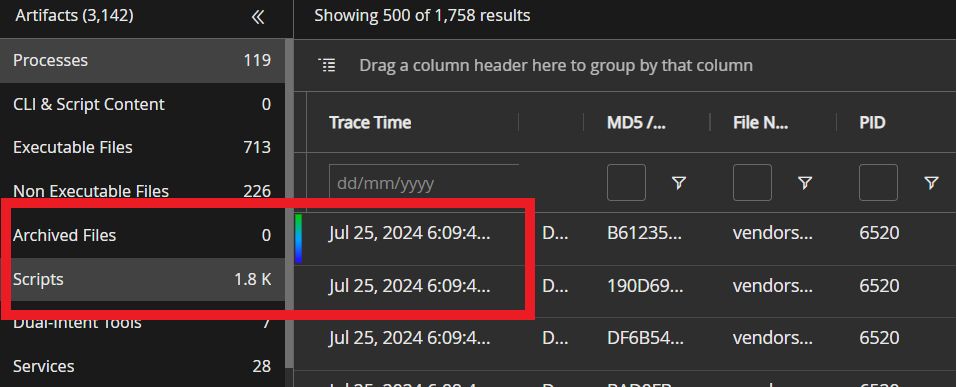
After selecting the events, click Next. Select Interactive mode or Dossier mode, and then click Triage. For more information, see Analyze threats with Generative AI.
Note
The default analysis mode is Interactive mode.
Each artifact has a set of predefined analysis options based on the nature of the analysis. For a list of predefined analysis options for the artifacts, see Artifact options under Device Search dashboard.
You can provide feedback on the assistance received from the Trellix Wise. The feedback system includes a rating option, allowing you to rate the support from 1 (poor service) to 5 (excellent service). Additionally, you can include constructive comments in the Additional Feedback section.