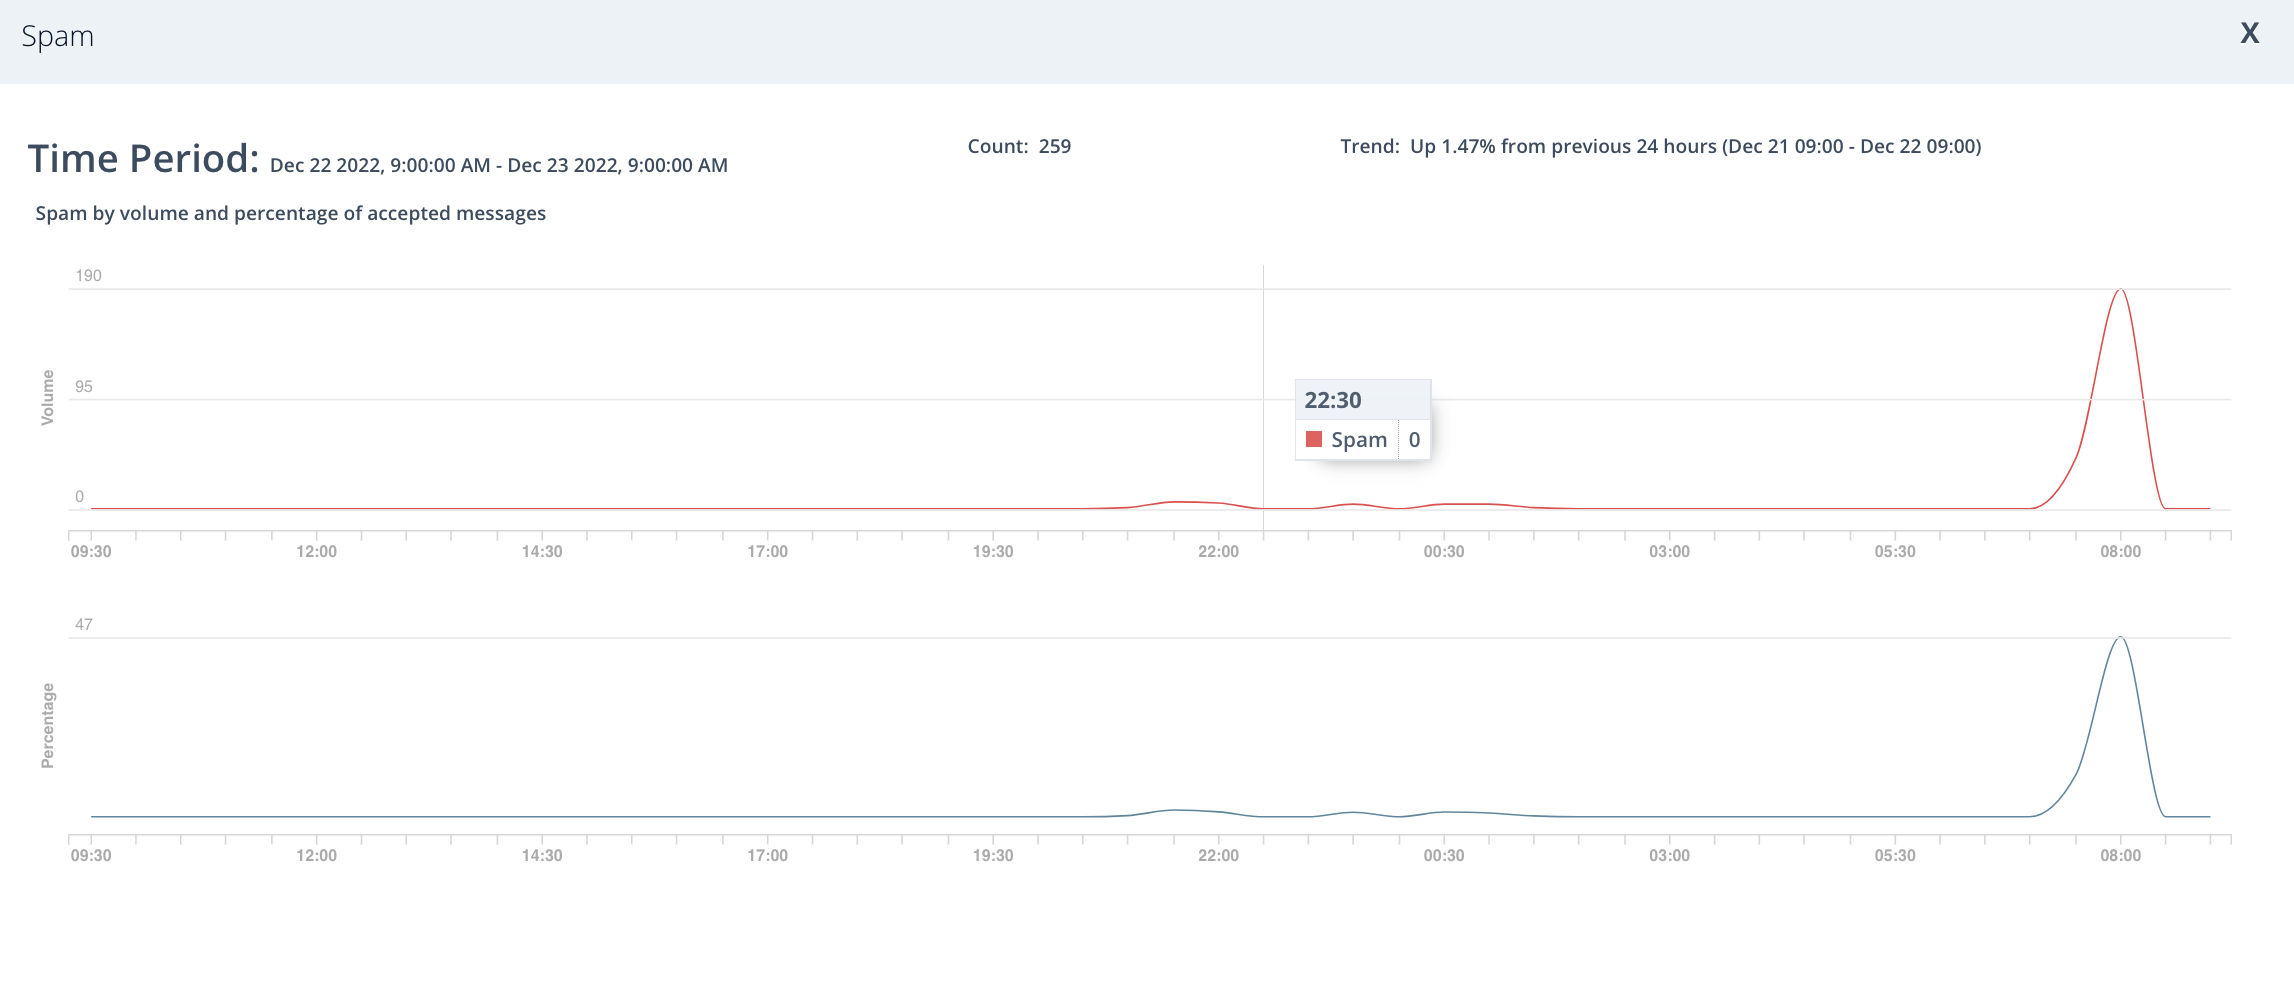
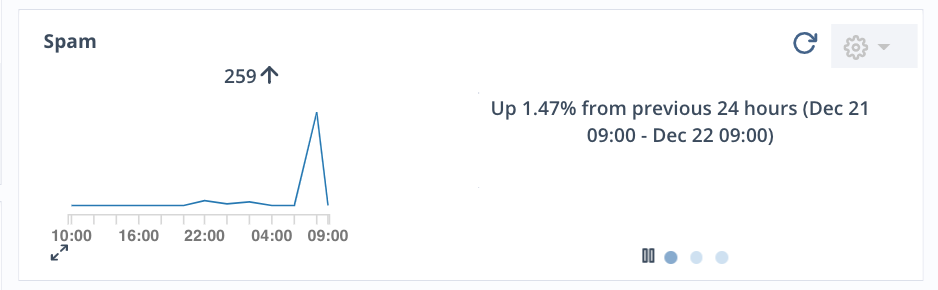
You can view spam statistics in either Inbound or Outbound mode. The dashboard's Spam widget cycles through a display of:
Current spam count graphed over the specified time interval, percentage of all accepted emails, and trend
Top sender IP addresses (for SMTP domains only)
Top recipients
Move your cursor over any place in the graph to view spam identified during a specific point in time.
Click the pause button to stop the Spam widget from changing between displays.
Note
Spam statistics are available for SMTP, MS365 Native with Hygiene, and Google Workspace with Hygiene domains only.
Expanded view
Click the  icon in the lower left corner of the widget to view:
Distribution of spam received across time period
Distribution of percentage of spam against accepted messages during that period
Count of spam messages received
Trend information