You can use clues from detected artifacts and historical search investigations to perform threat hunting using the Real-time Search capability.
The historical search investigation helps you to get historical data of endpoints. The clues from historical search investigation help you in a contextual analysis of threats and threat hunting.
Note
The "Threat hunting on endpoints using clues from Trellix EDR investigations" use case is a continuation of the detection use case — "Navigating through an attack using Trellix EDR". The use case is created using the set of threats as examples.
To watch the use case scenario, see the Webinar "Threat hunting on endpoints using clues from Trellix EDR investigations".
The following investigation methods help SecOps in hunting threats on endpoints:
Search for malicious artifacts using the historical search capability
Hunt for threats in the environment using the Real-time Search capability
Search for malicious artifacts using the historical search capability
When there is a suspicious activity on the endpoint and you want to know the details of the activities such as scripts executed, malicious files extracted, external connections established, etc. on the endpoint, you can hunt for malicious artifacts on the endpoint using Trellix EDR Device Search and Historical Search capabilities.
During the investigation, when you know the specific endpoint impacted due to a threat, you can use the Trellix EDR Device Search capability to search for malicious artifacts on a single endpoint. The results displayed on the Device Search dashboard are categorized into different artifacts such as Processes, CLI & Script Content, Executable Files, etc. with the number of records present in the endpoint. This level of customized information related to the impacted endpoint helps SOC in the investigation. Also, you can use these malicious artifacts details to search across the environment on multiple endpoints using the Historical Search capability.
As part of the investigation, if you know the endpoint impacted (In this use case, victim1), you can start with the Device Search capability to investigate all the Powershell.exe scripts executed that might have created archive files on the endpoint during the particular time window. Also, to know about what is actively happening, events generated and the suspicious external connection with which the Command and Control (C2) established on the compromised endpoint, pivot the hunt towards the Historical Search capability to search across the environment on multiple endpoints.
For details about searching historical data of endpoints using Trellix EDR, see Searching historical device data.
Note
The historical trace data is stored for 30–90 days in the Trellix EDR cloud. You can hunt down artifacts even when endpoints are offline.
On Device Search, enter the compromised endpoint name (In this use case, victim1) and detection time details. Then click the search icon to search for historical data.
The results are loaded and categorized into different artifacts. Select the appropriate artifacts for contextual analysis of different executables, script content executed, and also about the encoded command line used during an attack.
Select the CLI and Script Content artifact, and click on the Content analysis results. You can see that the rclone.zip and procdump.zip archive files are extracted into the compromised endpoint local folder and also the fingerprint (hash) details are available to find the related information about these extracted files.
The procdump.zip and rclone.zip files are used to elevate the authorization level and exfiltrate the data to the adversary cloud location.
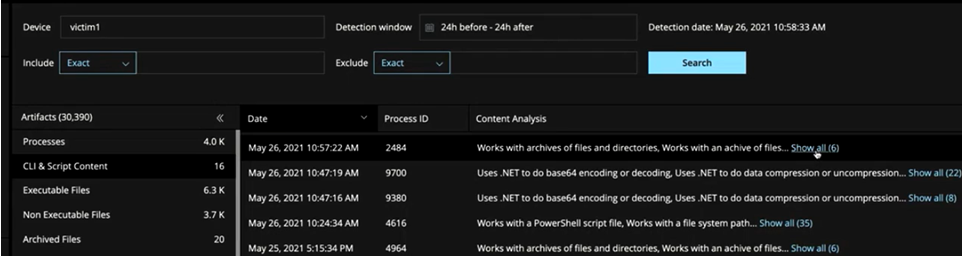
Select the Archived Files artifact. You can see the status of files (such as rclone.zip and procdump.zip) being created and deleted in the Activity column. This is an indication to cover up the adversary’s foothold in the attack.
Select the Network Connections artifact, and filter results with the external connection destination IP address which you gathered from Process activity event details to know details about the suspicious compromised endpoint external connection:
External connection — An outbound connection to the external IP address.
Protocols — TCP and HTTP both are used with non-standard ports.
Ports — Different destination ports are used even though they are connecting to the same destination IP address. One for the Command and Control (C2) connection and other one for the data exfiltration. The adversary might have used this approach to avoid being detected.
URL — URL style pull happening
Based on Device Search you know the malicious artifacts such as rclone.zip and procdump.zip, external IP address, etc. entered into the specific endpoint. To broaden the historical search across the environment on multiple endpoints, pivot the hunt towards the Historical Search capability.
Switch investigation from Device Search to Historical Search
During the investigation, when you know details such as malicious process, script, IP, etc. use the Historical Search capability to see the complete details of trace time, detection time, endpoints impacted, etc. Once you know the impacted endpoints from the Historical Search dashboard, you can pivot the hunt towards the Device Search capability to do the endpoint-specific hunting for the focused investigation.
On Historical Search, enter the query with the endpoint name that looks to be suspicious and compromised. As part of the attack, the adversary targeted an endpoint with the name podclient. To search all endpoints with the name that starts with podclient, you can use the query to search across the environment.
Query - DeviceName contains podclient
For details about the Historical Search query syntax, see KB94584.
The search results appear on the Historical Search dashboard.
Identify the malicious process used in the attack (in this use case, for example, PuttyXs.exe) and filter results that include PuttyXs.exe in the Event Details column. To identify the impacted endpoints due to PuttyXs.exe in the environment, you can group column (by manually dragging and dropping column headers to the group by location) by Device Name. Post grouping, the impacted endpoints display on the dashboard. This helps SOC in the focused investigation on the impacted endpoints by removing the extra telemetry available in Trellix EDR.
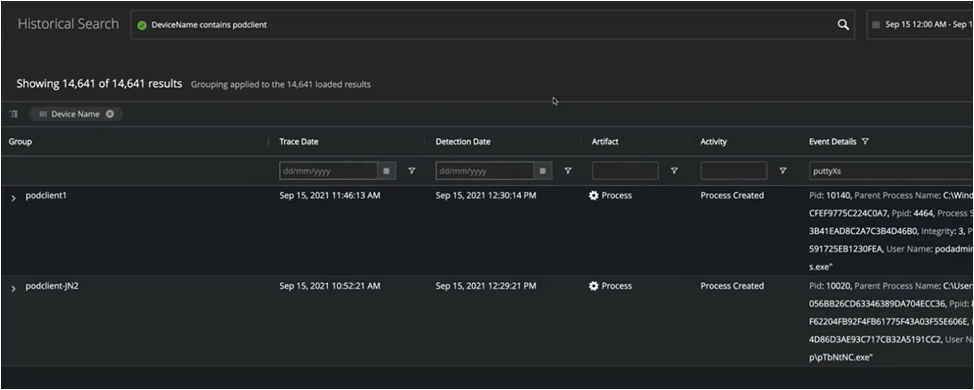
To know about the external connection to endpoints, the Historical Search capability allows you to customize the results grid by adding different artifacts such as Network destination IP, Network destination port, activity type, etc. as columns on the Historical Search dashboard.
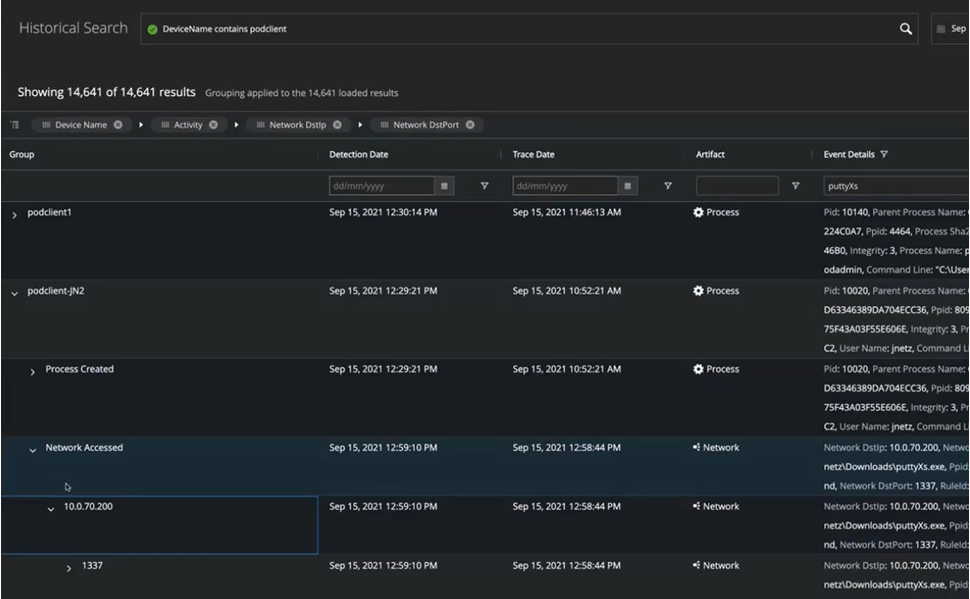
You can add Device Name and Activity artifact to the group by location. The resulting grid is now grouped by Device Name and Activity.
When you expand the endpoints (In this use case, for example, only 2 endpoints – podlclient1 and podclient-JN2), you see different activities such as Process Created, Network Accessed, API, DNS Query, Image Loaded, etc. under the endpoint name.
When you expand the Network Accessed activity, you see the network destination IP and network destination port on the respective columns Network DstIP and Network DstPort columns respectively. You can filter and search for the specific IP and Port details.
As artifacts such as Network DstIP, Network DstPort etc. are critical in the investigation, you can group these artifacts with Device Name and Activity to see the number of IPs and ports that are connected with the respective endpoints.
When you group by columns such as Device Name, Activity, Network DstIP, and Network DstPort, the Historical Search results grid provides a holistic view of the list of endpoints, activities happening on endpoints, the list of destination IPs and ports connected to the respective endpoints. This is an efficient way to quickly search for malicious artifacts across your environment and it helps in countering future attacks reaching the level of data exfiltration.
Hunt for threats in the environment using the Real-time Search capability
The Trellix EDR Real-Time search capability provides the endpoint data in real-time. This capability helps you to hunt for threat details such as how the AmazonOrder.docm malicious file originally made its way to the endpoints in your environment (In this use case, victim1 and podclient2), what was the user activity when the malicious file entered the network, etc. Then you can contain and remediate threats using the Trellix EDR Response capability.
For details about searching real-time data of endpoints using Trellix EDR, see Search real-time data of endpoints for investigation and threat hunting.
For details about responding to threats using Trellix EDR, see Respond to threats.
Search for the browser history of all endpoints present in your environment remotely to investigate the endpoints that tried to download the malicious file.
You can use the real-time search query consisting of the BrowserDownload collector to see the presence of malicious files across your network and related information.
In this use case, the below query is used for hunting and appropriate results are displayed on the Real-time Search dashboard.
Real-time Search query – BrowserDownload file_path, start_time, state, site_url, browser, mime_type, and HostInfo where BrowserDownload file_path contains “AmazonOrder.docm”
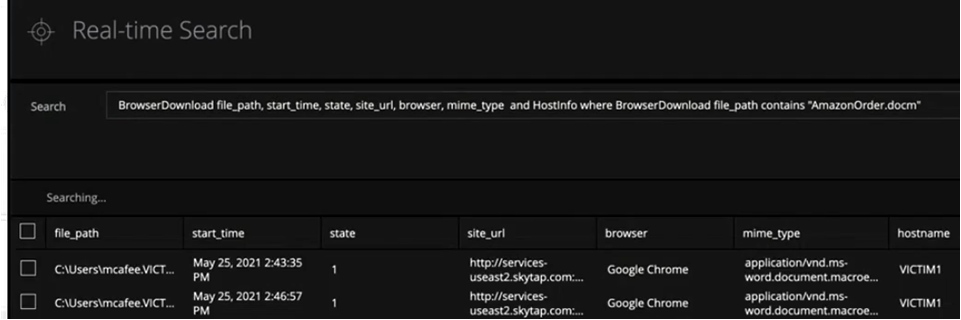
The query results give details as below:
The browser download history of endpoints — victim1 and podclient2, where the AmazonOrder.docm malicious file is downloaded.
The file path of the malicious file downloaded to endpoints local folders.
The downloaded time, state, site_url, browser, and mime_type data.
On the victim1 endpoint, the AmazonOrder.docm file is downloaded using the Google Chrome browser.
On the podclient1 endpoint, the AmazonOrder.docm file is downloaded using the Microsoft Edge browser.
Hunt for the ransomware ShinoLocker.exe file hash in your environment.
Note
You can get the ShinoLocker.exe file hash information from the alert triggered on the Monitoring dashboard.
In this use case, the below query is used for hunting a threat, and appropriate results are displayed on the Real-time Search dashboard.
Real-time Search query — Files and HostInfo where Files md5 equals "4DED9…"
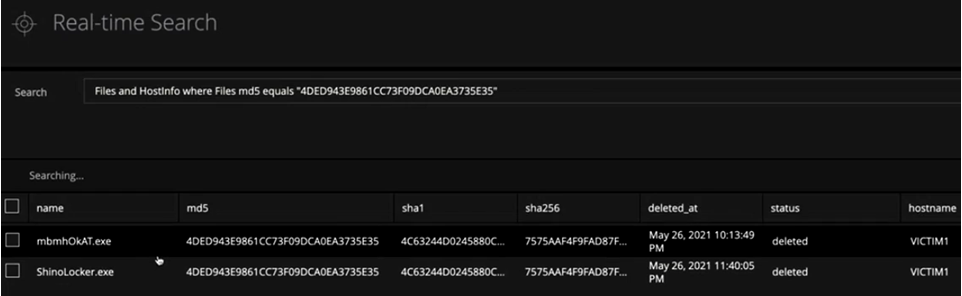
The query returns details as below:
On the victim1 endpoint, two files with different names (both have the same hash) are executed on the endpoint. Also, at some point, both are deleted by the Endpoint Protection security solution.
On the podclient1 endpoint, the ransomware ShinoLocker.exe didn’t execute. To understand how the ransomware ShinoLocker.exe didn’t execute even though the AmazonOrder.docm malicious file is downloaded and that might have established the C2 server.
To investigate further on this point, you can use a query consisting of Microsoft software installed on the endpoint to investigate any Microsoft Office applications with AmazonOrder.docm is available on the endpoint podclient2.
Real-time Search query – Software and HostInfo where Software displayname contains “Microsoft” and HostInfo hostname equals “podclient2”
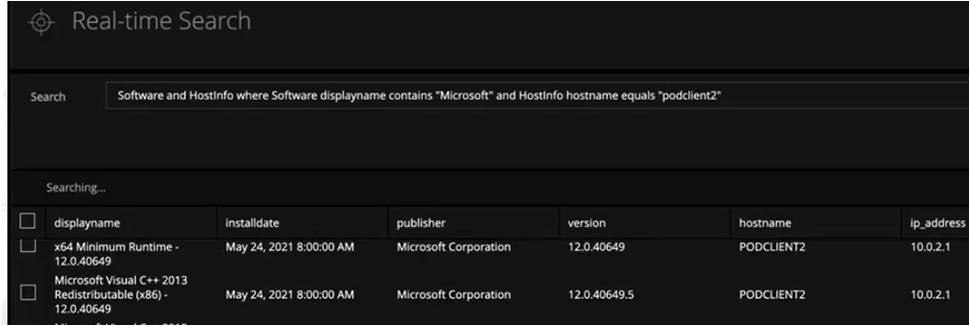
The following interpretations can be made based on the search results:
On the podclient2 endpoint, Microsoft Office or Microsoft 365 applications with AmazonOrder.docm are not available.
The endpoint could not run the AmazonOrder.docm file as it is blocked by the Trellix ENS protection solution. Hence, the adversary could not install the ransomware Shinolocker.exe on the endpoint.