The Historical Search interface enables analysts to build and execute queries to investigate endpoint telemetry stored in the EDR Telemetry Store. This section explains the main actions you can perform in the UI and how each component supports data analysis.
To view the Historical Search interface on Endpoint Security (HX) On-prem:
Log in to Endpoint Security (HX) On-prem as an administrator.
Navigate to Menu → Historical Search.
Use Historical Search settings to investigate endpoint telemetry:
Search bar and syntax help
When you open the Historical Search page, the search bar appears at the top of the screen. You can build a TQL query by entering search conditions that use field names, operators, and functions. The Syntax Help panel is displayed by default on the lower section of the window to assist with query creation.
For more information about components involved in building a query, see Anatomy of a TQL query.
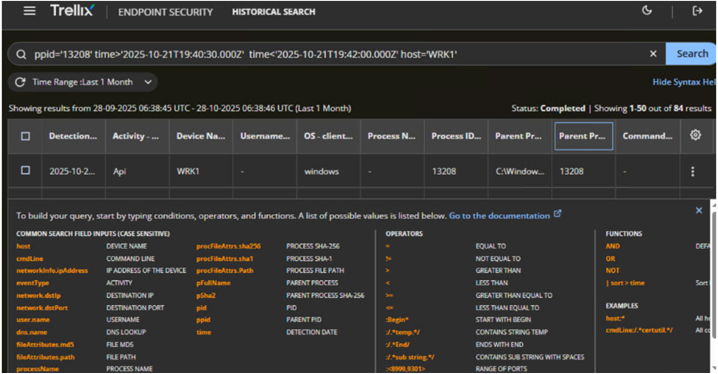
It lists:
Commonly used search fields (for example, host, processName, cmdLine, eventType, dns.name).
Supported operators such as =, !=, < , >, :/regex/, and logical connectors (AND, OR, NOT).
You can copy the terms from the help panel to build your search.
For a larger workspace, click Hide Syntax Help to minimize the panel. To view use case examples and more query samples, see Search and filter endpoint telemetry in Historical Search.
Time range selection
Use the Time Range control to limit results to a specific time frame. Adjusting the time range helps you focus on relevant events and reduce query volume.
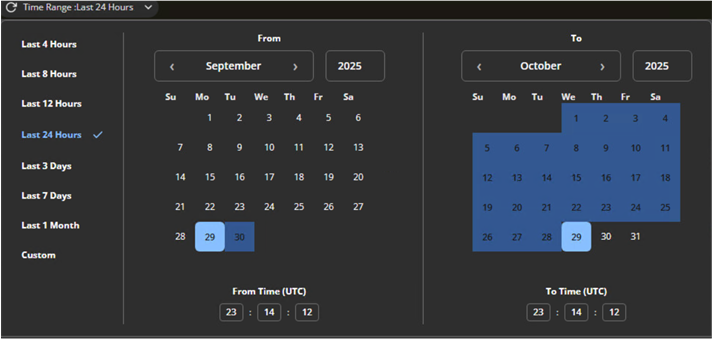
Predefined options include:
Last 4 hours
Last 8 hours
Last 12 hours
Last 24 hours
Last 3 days
Last 7 days
Last 1 month
You can set a Custom Range by selecting dates and times from the calendar.
You can refine your search results by adding a specific time range to the query.
Example
time>'2025-10-26T12:27:55' time<'2025-10-27T12:36:30' host:test*
Note
All times are displayed in UTC.
View and manage search results
After you run a query, results appear in a tabular view. Each row represents an event, showing key fields such as Activity, Device Name, Process, and Command Line.
You can adjust how data is displayed using the gear icon at the top-right of the results table.
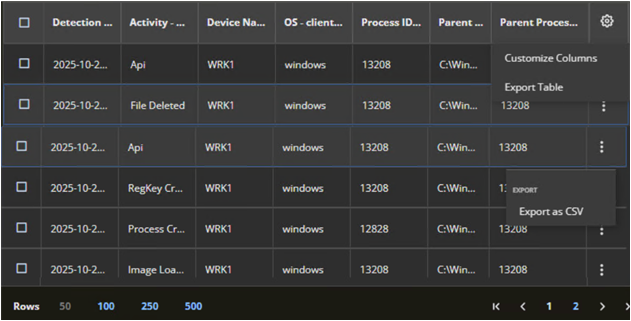
The adjustable options include:
Customize Columns: Opens the Trellix Default Column Set panel. You can select or clear columns as needed to tailor the data view.
Export Table: Exports the entire result set to a CSV file for offline analysis.
Row Allocation: Use the row setting to control how many results are visible at once (for example, 50, 250, or 500).
Refine results and modify queries
To refine your search without rewriting the entire query, right-click any cell within the table. The context menu provides these options:
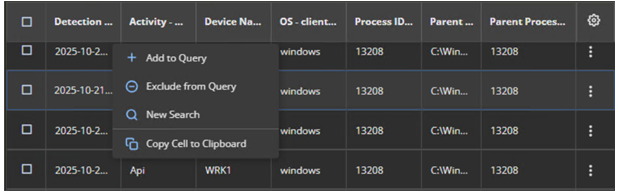
Add to Query: Adds the selected cell value to the existing query.
Exclude from Query: Filters out results containing that value.
New Search: Starts a new query using only the selected value.
Copy Cell to Clipboard: Copies the cell data for reuse or reference.
These options allow you to iteratively narrow your search and focus on specific processes, hosts, or activities.
View detailed event information
Click an event row to open the Event Details side panel.
The panel displays in-depth attributes related to the selected event.
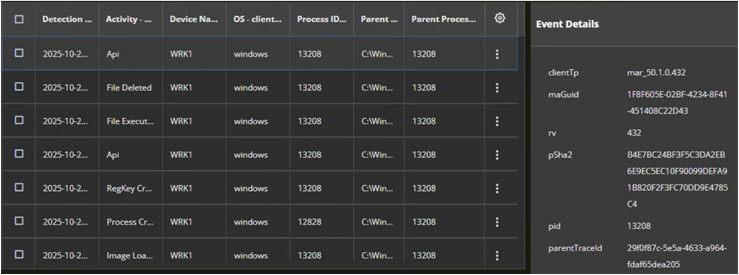
It includes:
Parent and child process information (
pid,ppid, andparentTraceId)Executable paths and command-line arguments (
pFullName,cmdLine)File or registry interaction details
API activity, including system call names and parameters
For example, an API event entry might show function names, module paths, and argument values, helping analysts trace the exact sequence of actions performed by a process.
Export and customize data
You can export data using one of the following methods:
Export entire table: In the table header, click the gear button, then select Export Table.
Export multiple rows: Select the checkboxes for the rows you want to export, click the gear button, then select Export Table.
Export selected row: Click the three-dot menu at the end of a specific row and select Export as CSV.
Exports include all visible columns in the current view.
Example query
Look for Parent Process ID
ppid='13208' time>'2025-10-21T19:40:30.000Z' time<'2025-10-21T19:42:00.000Z' host='WRK1'