Overview
At audit time, accuracy and timeliness are critical. Whether you need to prove compliance with mounting external regulations, quickly assess system patch status to prevent exploitation of vulnerabilities, or reduce liability by proving that your organization is following best practices, Trellix Policy Auditor eases the pressure.
Trellix Policy Auditor helps you stay compliant, reduce costs and manual effort, and increase visibility. Our easy-to-manage solution automates and simplifies the process, helping you to quickly assess patch deployment progress, monitor critical security configurations, and report consistently and accurately against key industry mandates and internal policies across your entire infrastructure or on specific systems.
Key features
Trellix Policy Auditor eases audits through integration with Trellix ePO - On-prem, which unifies management and reporting. Trellix ePO - On-prem also facilitates policy customization and creation. These are some of the key features of Trellix Policy Auditor.
Audit management — Audit management allows you to create audits based on benchmarks and assign them to run on systems. Trellix Policy Auditor evaluates systems against independent standards that are developed by government agencies and private industry. It also evaluates systems against standards you create (using Benchmarks that you create).
Benchmark management — Benchmarks are documents containing an organized set of rules describing the wanted state of a system. A benchmark is the core component of an audit and can be used by Trellix Policy Auditor and other Trellix or third-party products. You can download the benchmark content, then activate or tailor the benchmark.
Audit waivers — Waivers allow you to temporarily change how systems are audited, for systems that might affect the audit scores. They are useful when you have systems that you know might be out of compliance but you don't want to bring the system into compliance for a temporary period.
Audit findings — Findings supplement the results of an audit check with additional information about the state of the system. Instead of seeing a value of false for a test result, findings give more meaningful information such as the minimum password length is set to 6 but it should be set to 8 or higher.
File integrity monitoring and entitlement reporting — File integrity monitoring notifies you of changes to specified text files on managed systems. Entitlement reporting informs you of changes to user and group rights to files. These features are useful for complying with government and industry standards, such as the Payment Card Industry (PCI) Data Security Standard.
Advanced host assessment inventory scan — Scan for inventory items such as applications, operating systems details, and ports in use. This allows you to monitor and log changes of these inventory items, and helps you identify deviations from a baseline.
Roll-up reporting — Roll-up reporting utilizes the roll-up functionality of Trellix ePO - On prem. You can run queries that report on summary data from multiple Trellix ePO - On-prem databases. Trellix Policy Auditor can use this feature to create rollup reports for audit results.
How it works
Trellix Policy Auditor gives you a broad visibility into the state of your network-connected devices across your IT infrastructure. It evaluates the status of managed systems relative to audits that contain benchmarks.
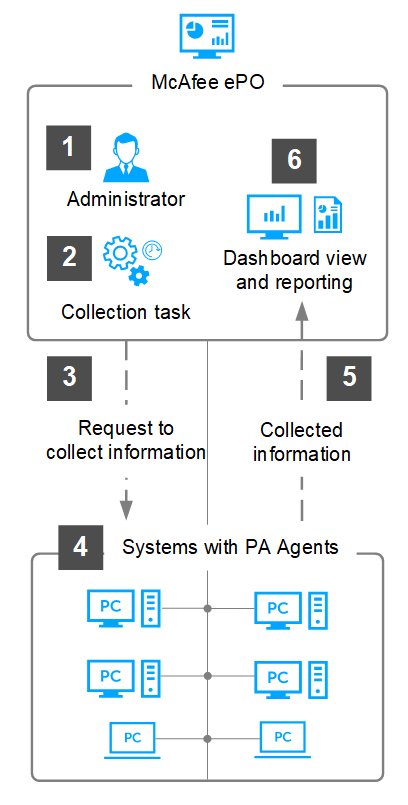
This workflow gives you a high-level overview of how Trellix Policy Auditor works.
On Trellix ePO - On-prem, you create audits or inventory collection tasks.
You run the task immediately or schedule it for a later time.
On execution of the task, Trellix ePO - On-prem requests the Policy Auditor agents to collect information from the managed systems.
At the managed system, Policy Auditor or Advanced Host Assessment agents collect the information requested by Trellix ePO - On-prem.
The agents then have the audits or inventory collection data sent back to Trellix ePO - On-prem.
You can then generate reports, view the information about the dashboards, or export the result.
Getting started with Trellix Policy Auditor
Trellix Policy Auditor is an extension to Trellix ePO - On-prem software versions 5.9, 5.9.1, and 5.10, which automates the process for risk and compliance system audits.
Audits can perform tasks such as check system settings, including password length, open or closed ports, file changes, and the presence of software updates.
Introduction to compliance audits
Before using Trellix Policy Auditor, it is important to understand what audits are, when you must use them, and why you must use them.
What are compliance audits?
A compliance audit is a comprehensive review of an organization's adherence to external regulatory guidelines or internal best practices. Trellix Policy Auditor automates the compliance audit process and allows you to show compliance to auditors by producing an audit trail showing compliance, compliance history, and actions taken to mitigate risks. Organizations that are out of compliance might be subject to fines or other sanctions, including criminal liability.
When should you use audits?
Use compliance audits when you are subject to government regulations that require your organization to determine system compliance and maintain records. You must also use audits to determine compliance with organizational requirements such as password complexity, password length, the presence of unsupported software, and software patch requirements.
Why should you use audits?
Trellix Policy Auditor automates the process for mandated and organizational audits. Its companion product, Trellix Benchmark Editor, contains built-in benchmarks that the software can use for mandated audits, such as Sarbanes-Oxley (SOX) and the Payment Card Industry Data Security Standards (PCI DSS). The reporting system allows you to show compliance to auditors while the Findings feature helps you to find solutions to audit issues.
Auditing systems
An audit is an independent evaluation of a computer system to determine whether it is in compliance with corporate and industry security standards. Audit results show recommended improvements to reduce risks.
Trellix Policy Auditor evaluates systems against independent standards developed by government and private industry. It can also evaluate systems against standards that you create yourself. Trellix Policy Auditor uses audits to determine the compliance status of systems and returns results indicating any areas where the system is out of compliance.
Scoring audits
When you audit a system with Trellix Policy Auditor, it returns a score indicating how well the system complied with the audit. Trellix Policy Auditor supports the four scoring models described in the Extensible Configuration Checklist Description Format (XCCDF) 1.2 specifications.
Software components and what they do
Trellix Policy Auditor installs components that help you analyze systems for compliance with recognized, open-source standards and standards that you can create yourself.
These are the Trellix Policy Auditor components as they appear in the interface:
Component | Function |
|---|---|
Benchmark Editor | A utility used to enable, disable, create, and edit benchmarks. Each audit must contain at least one benchmark. Ideally, audits must contain only one benchmark. |
Benchmark Editor Content Distributor | Distributes content downloaded from Trellix Labs to systems. |
Findings | Manages findings, which help you understand why an audit check failed and provides information about how to fix the problem. |
PACore | The primary part of the software that controls all other features. |
PARollup | Uses the rollup capabilities of the Trellix ePO - On-prem software to collect summary information from registered Trellix ePO - On-prem servers and show aggregated data. |
Trellix Policy Auditor | Handles policy and task management, audit schedules, and system management. |
Advanced Host Assessment | Advanced Host Assessment allows you to do the following:
|
Advanced Host Assessment Content Distributer | Processes the Advanced Host Assessment Content into the server when it is checked into the master repository. |
Trellix Policy Auditor agent
The Trellix Policy Auditor agent plug-in expands the ability of the Trellix Agent to support Trellix Policy Auditor.
When audits are deployed to systems with the Trellix Agent the agent plug-in determines when the audits must be run. The agent plug-in conducts audits at the appropriate time and returns the results to the Trellix ePO - On-prem server. The agent plug-in can conduct audits when the managed system is off the network, and returns results to the Trellix ePO - On-prem server once the system is reconnected to the network.
Installing the agent plug-in adds a product icon to the Trellix Agent notification area. In Windows environments, the product icon optionally displays a balloon tip to indicate the system is being audited.
Systems that have the Trellix Policy Auditor agent plug-in installed are known, in Trellix Policy Auditor terminology, as managed systems.
Use of Trellix ePO - On-prem features
Trellix Policy Auditor is an extension of the Trellix ePO - On-prem software, and uses and relies on many of its features.
Trellix Policy Auditor is configured from Trellix ePO - On-prem. The Trellix ePO - On-prem server is the center of your managed environment and provides a single location where you can administer and monitor security settings throughout your network. You can use the default settings or configure the settings to match your organizational needs.
This table lists the applicable the Trellix ePO - On-prem software features and describes how they are used by Trellix Policy Auditor. You must become familiar with each of the listed features and their uses.
Trellix ePO - On-prem feature | Location | Used by Trellix Policy Auditor |
|---|---|---|
Assign Policies | Menu | Systems | System Tree | Assigned Policies | To assign policies, like file integrity monitor, to managed systems. |
Client tasks | Menu | Systems | System Tree | Client Tasks |
|
Contacts | Menu | User Management | Contacts | To create user contact information when you want to notify specific personnel by email of an event. |
Dashboards and Monitors | Menu | Reporting | Dashboards |
|
Issues | Menu | Automation | Issues | To prioritize, assign, and track issues. Issues can also be associated with tickets in a third-party ticketing server. |
Policy Catalog | Menu | Policy | Policy Catalog |
|
Queries | Menu | Reporting | Queries | To create and maintain database queries regarding system security information. |
Registered Executables | Menu | Configuration | Registered Executables | To register a command that can be run on the server as part of an automatic response. |
Repositories | Menu | Software | Master Repository | To check in and manage content required by Trellix Policy Auditor, such as the Audit Engine content with all compliance and threat checks and published benchmarks. |
Server Settings | Menu | Configuration | Server Settings | To specify parameter values affecting the operations of Trellix Policy Auditor. |
Server Tasks | Menu | Automation | Server Tasks |
|
Tag Catalog | Menu | Systems | Tag Catalog | To create tags that can be used to help organize your systems. |
Users | Menu | User Management | Users | To create or edit a specific person as a user of Trellix Policy Auditor and their permission type. |
Managed systems
Knowing how Trellix Policy Auditor classifies systems on your network is important for setting up and using the product, and for using its features. Trellix Policy Auditor uses two system classifications: Managed systems.
Managed systems — Systems in the System Tree that have both the Trellix Agent and the Trellix Policy Auditor agent plug-in installed.
These classifications, and their characteristics and requirements, apply exclusively to Trellix Policy Auditor functionality. Other Trellix products might use the same classifications, but with different characteristics or requirements.
Auditing managed systems
When connected to a network managed by Trellix ePO - On-prem, managed systems can exchange information with the Trellix ePO - On-prem server as scheduled. The primary advantage of managed systems is is that they are audited by the agent even when they are not connected to the network. When they are reconnected, the Trellix Policy Auditor agent plug-in communicates the results to Trellix Policy Auditor. The Trellix Policy Auditor agent plug-in slightly increases memory and processor use.
Configuring Trellix Policy Auditor
Trellix Policy Auditor is configured from the Trellix ePO - On-prem server. The server is the center of your security environment, providing a single location where you administer system security throughout your network.
Server settings and what they control
Trellix supplies default settings for Trellix Policy Auditor, findings, and Advanced Host Assessment. You can change server settings to fit your organizational needs.
These are the server settings for Trellix Policy Auditor, Findings, and Advanced Host Assessment Scans.
Table 3-1 Trellix Policy Auditor server settings
Server setting | Description |
|---|---|
Audit data retention | Purges all audit data older than a designated date. You can also manage the purge settings for individual audits, based on how long you need to maintain the audit data. In large and complex organizations, the retention times for audit data may vary by audit. The ability to specify data maintenance per audit lowers the cost of maintaining audit data.
|
Audit data stream result retention | Purges the audit data stream older than a designated date.
|
Audit label | Allows you to use different descriptions for the default labels of Pass, Fail, Pass-Expired, Fail-Expired, Not Scored-Expired, Not Scored, or No Results. For example, instead of the word Pass, you can choose to use the word Successful. Trellix recommends that you keep the default settings. |
Audit result detail level | Findings provide information about why checks failed in an audit. Providing more detail helps when reviewing audits, but can impact the size of the database. Note: These settings can be overridden on a per audit basis.
|
Audit score | Indicates how well a system conforms to the ideal settings specified in an audit. You can change the scoring definitions to reflect your organization's determination of what constitutes a passed or failed audit.
|
Audit score categories | Provides four categories with default names and colors that describe the success of an audit. You can change the names to fit your organization's requirements, but most users find the default names appropriate and easy to understand.
|
Database Maintenance - allow online rebuild of indexes | Enables database maintenance features, including the rebuilding of indexes. |
Database Maintenance - maintain indexes whose fragmentation exceeds this percentage | Specifies the amount of fragmentation that triggers index rebuilding and related maintenance. |
Database Maintenance – stop processing after this time | Specifies the amount of time, in hours, that database maintenance tasks run before stopping. |
Default Scoring Model | Supports the four standard eXtensible Configuration Checklist Description Format (XCCDF) scoring models. These scoring models are described in detail in Scoring Audits. The default scoring model is Flat Unweighted. This computes the score (the number of rules that passed) and compares it against the maximum possible score. |
Differentiate expired results in a query | Controls whether expired results are differentiated in a query. You can show expired results as expired or differentiate them as follows:
|
Frequency to run update audit assignments | Defines the value, in hours, for running the PA: Update Audit Assignments server task. Trellix Policy Auditor sends audit content only to systems that are scheduled to receive the content. This reduces bandwidth and lessens client system disk space requirements. |
Generate result data stream on target system | Controls how much data stream information is generated for each target system.
|
Index configuration | Controls database indexing that can improve either results processing or generating reports/queries.
|
Max number of FIM version files | Defines the number of file integrity file versions to store for use with FIM. You can store up to six versions of each monitored text file, including the baseline version. See File Integrity Monitoring for information on baselines and file versions. |
Minimum pass percentage for rule aggregation | Aggregates the results in queries and reports when the percentage of rules that pass in an audit exceed the defined percentage. |
Number of benchmark results to purge per batch | Specifies the number of benchmark results purged when purging audit results. |
Threads for audit results processing | Specifies the number of processing threads allotted to audit results. The default number is 5. |
Threads for Findings Processing | Specifies the number of processing threads allotted to Findings. The default number is 5. |
Threads for File Integrity Processing | Specifies the number of processing threads allotted to File Integrity Processing. The default number is 5. |
Violation limit | Limits the number of violation shown in reports through the Violation limit setting. Findings provide information about why checks failed in an audit. Because an audit might report thousands of violations, you can limit the number of violations shown. By default, Trellix Policy Auditor truncates the number of violation results to 300. |
Findings data retention | Enable or disable data purging through Findings.
|
Reset Baseline | Resets the baseline for your inventory scan. |
Include Inventory Items Flag | Select these inventory items to include in the scan report.
|
Edit Trellix Policy Auditor server settings
Edit the Trellix Policy Auditor server settings to fit your organizational and business needs.
You must be an administrator to perform this task.
Task
On the Trellix ePO - On-prem interface, select Menu | Configuration | Server Settings.
Under Setting Categories, select Policy Auditor. The Trellix Policy Auditor server settings appear in the main panel.
Click Edit to open the settings page.
Change the settings as needed, then click Save.
How permission sets work
When Trellix Policy Auditor is installed, it adds a permission group to each permission set. When you create a permission set, the Trellix Policy Auditor permission group is added to the set. One or more permission sets can be assigned to users who are not administrators (administrators have all permissions to all products and features).
Permission sets only grant rights and access — no permission ever removes rights or access. When multiple permission sets are applied to a user account, they aggregate. For example, if one permission set does not provide any permissions to server tasks, but another permission set applied to the same account grants all permissions to server tasks, that account has all permissions to server tasks. Consider this as you plan your strategy for granting permissions to the users in your environment.
How users, groups, and permission sets fit together
Access to items in Trellix ePO - On‑prem is controlled by interactions between users, groups, and permission sets. For more information about how they interact, see How users, groups, and permission sets fit together in Trellix ePO - On‑prem 5.10 Software Product Guide.
Trellix Policy Auditor permission sets
Trellix Policy Auditor includes seven default permission sets that provide permissions for Trellix Policy Auditor and related applications.
Permission set | Component | Permissions |
|---|---|---|
PA Admin | Benchmark Editor |
|
PA Admin | Findings |
|
PA Admin | Issue Management |
|
PA Admin | Policy Assignment Rule |
|
PA Admin | Policy Auditor |
|
PA Admin | Trellix Policy Auditor Agent |
|
PA Agent Admin | Trellix Policy Auditor Agent |
|
PA Agent Admin | Advanced Host Assessment |
|
PA Audit Admin | Benchmark Editor |
|
PA Audit Admin | Findings |
|
Issue Management |
| |
Policy Auditor |
| |
PA Benchmark Activator | McAfee Benchmark Editor |
|
PA Benchmark Editor | McAfee Benchmark Editor |
|
PA Scan Admin | Advanced Host Assessment Agent |
|
Advanced Host Assessment |
| |
Server tasks |
|
Note: These permissions are disabled by default. You need to enable it manually to create, run, and monitor scans.
Systems
View the System Tree tab.
Note: These permissions are disabled by default. You need to enable it manually to create, run, and monitor scans.
Permission set | Component | Permissions |
|---|---|---|
System Tree access | Enable the following options:
| |
PA Viewer | McAfee Benchmark Editor Findings Policy Auditor |
|
Advanced Host Assessment Agent | Advanced Host Assessment |
|
PA Waiver Granter | McAfee Benchmark Editor Findings Issue Management |
|
Edit permission sets
You can edit the default Trellix Policy Auditor permission sets or create your own.
You must be an administrator to perform this task.
For option definitions, click ? in the interface.
Task
In the Trellix ePO - On-prem interface, click Menu | User Management | Permission Sets, then select the permission set.
Click Edit next to the Trellix Policy Auditor permission group. The Edit Permission Set page appears.
Select the appropriate options, then click Save.
Repeat for all appropriate sections of other permission sets.
Using the Trellix Policy Auditor agent
The Trellix Policy Auditor agent manages the schedule for performing audits, runs the audits, and returns the results to the server.
You install the Trellix Agent and the Trellix Policy Auditor agent on managed systems. This enables audits to be conducted even if a system is not connected to the network. When the system reconnects to the network, it returns audit information to the server and receives updated content and schedules for future audits from the Trellix Policy Auditor server.
How the Trellix Policy Auditor agent works
The Trellix Policy Auditor agent updates the audit schedule on managed systems, launches audit scans according to a schedule, and returns results to the server.
Install the Trellix Agent and the Trellix Policy Auditor agent on your managed systems. The agent can perform audits when a system is not connected to its network. When the system reconnects to the network, the agent returns the results to the server.
The schedule relies on whiteout and blackout periods that you set. Audit whiteout periods are times when an audit can run on a system or group of systems. Audit blackout periods are times when an audit can't run. The Trellix Policy Auditor agent determines the age of the current information and uses pending blackout or whiteout windows to determine when content should be re-evaluated.
When the Trellix Policy Auditor agent receives notification that the audit is complete, it calculates and stores the date and time of the next scheduled audit. You can use the Run Audits feature of Trellix ePO - On‑prem to force an immediate scan. When you do this, the agent marks the frequency information as expired and recalculates the date and time for the next scheduled audit. The recalculated date and time are always scheduled during a whiteout period.
The Trellix Policy Auditor agent can perform audits when a system is not connected to its network. When the system reconnects to the network, the Trellix Policy Auditor agent returns the results to the server.
How content is managed
Content for Trellix Policy Auditor consists of benchmarks and checks. The content package is included when the product is installed, and is placed into the Trellix ePO - On‑prem Master Repository.
Before you can use benchmarks in audits, you must activate them in Trellix Benchmark Editor.
The Master Repository is updated daily by a server task that is included with the software. If you want to update Trellix Policy Auditor on a different schedule, you can create a server task. You must verify that the task is enabled.
The Master Repository is configured when installed. But, you must ensure that proxy server settings, if any, are configured correctly. By default, Trellix ePO - On‑prem uses Microsoft Internet Explorer proxy settings.
For information about repository management, proxy settings, and server tasks, see the Trellix ePO - On‑prem documentation.
Creating and managing audits
Trellix Policy Auditor allows you to create audits based on benchmarks and assign them to run on systems.
Trellix Policy Auditor evaluates systems against independent standards that are developed by government agencies and private industry. It can also evaluate systems against standards you create (using Benchmarks that you create).
You can create audits from a Trellix-supplied selection of predefined benchmarks established by government and industry such as SOX, HIPAA, PCI, and FISMA. You can also create audits based on third-party benchmarks or benchmarks that you create yourself.
Audits return results that include a score allowing you to determine how well a system complies with the rules in the benchmark.
Audits and how they work
The software uses audits to determine the compliance status of a system, and returns results indicating areas that are out of compliance.
Trellix Policy Auditor evaluates systems against independent standards that are developed by government and private industry. It can also evaluate systems against standards that you create.
An audit consists of:
A benchmark or a selected profile in a benchmark
A system or groups of systems
An audit frequency (how often the data should be gathered)
An optional waiver to temporarily exclude systems or audit results from reports
Benchmarks are documents that contain rules for describing the wanted state of a system according to recognized standards.
Rules contain checks that are normally written in the OVAL language.
When you run an audit against a system, the audit reports the comparison between the configuration status of the system and the rules in the benchmarks. When the default audit scoring model is used, the audit also reports a comparative score of the system ranging from 0–100.
Audit frequency
Audit frequency describes how often data should be gathered.
Frequency is defined as "Audit results should be no older than nnn time unit," where "nnn" is a number and "time unit" is days, weeks, or months. For example, if the frequency for an audit is defined as 1 month and a system has not been audited in more than 1 month, the results are considered to have expired.
Differentiating expired results
When you set the Differentiate expired results in a query server setting to true, reports and queries differentiate expired results as follows:
pass-expired — The results have expired but the last audit results evaluated to pass.
fail-expired — The results have expired but the last audit results evaluated to fail.
other-expired — The results have expired and the previous audit results evaluated to a condition other than pass or fail.
No audit results
If an audit has not run, it has a status of no results in reports and queries. Results are shown after the audit runs.
When audits are run
Trellix Policy Auditor provides three ways to run an audit.
Manual
You manually run an audit, the audit runs during the next whiteout period.
Scheduled
Managed systems — The Trellix Policy Auditor agent runs the audit before the results expire, even if the system is not connected to the network. The audit expiration date is defined by the audit frequency.
Unmanaged systems — The Trellix Policy Auditor network audit engine runs the audit before the audit expires, as defined by the audit frequency. The system must be connected to the network.
Content update
Trellix updates the audit content. This happens often with patch assessment audits. When content is updated, the audit runs during the next whiteout period.
Per audit data maintenance
Trellix Policy Auditor provides per audit data maintenance. This lets you control, at the individual audit level, what information to retain and how long to retain it.
The software system settings provide a standard for retaining results for audits and findings. However, you might want to retain some audit information for a greater or lesser amount of time.
You can create or edit an audit so that it retains audit or findings information for a different period of time than is specified in the global system settings.
Benchmark profiles and their effect on audits
Audits have benchmarks assigned to them. Many benchmarks contain profiles, which are named sets of selected groups, rules, and values targeted toward different computer system configurations and threat risks.
A profile can:
Enable or disable groups
Enable or disable rules
Change the variables that are used within a rule, such as the minimum password length
Profiles are normally designed to apply to a particular set of systems. For example, a benchmark might contain two profiles, one for Windows and one for UNIX. Or, a benchmark might contain high security, medium security, and low security profiles.
Select a profile based on the risk of the systems being audited. Systems containing customer credit card information are a greater threat to an organization if the data is compromised than a system used to create company newsletters.
Considerations for including systems in an audit
Audits can be designed for a specific computer system configuration, and Trellix Policy Auditor allows you to include or exclude systems from an audit based on several system characteristics.
Trellix Policy Auditor allows you to exclude managed systems based on system name, IP address, MAC address, or user name.
Including systems in an audit
Trellix Policy Auditor provides two methods for including systems in an audit.
The first method includes managed systems by specifying System Tree and Tags:
Add System — A managed system as defined by system name, IP address, MAC address, or user name.
Add Group — A group defined in the Trellix ePO - On‑prem System Tree.
Add Tag — Systems that have been tagged in the Trellix ePO - On‑prem System Tree, such as server, workstation, or laptop.
The second method allows you to include managed systems by specifying criteria. Criteria are defined by selecting properties and using comparison operators and values to represent managed systems. You can select one or multiple criteria.
Benchmark labels and how they are used
Labels classify a benchmark to aid in searches. Each benchmark can have multiple labels assigned to it.
Labels can describe the programmatic use of a benchmark, such as applying a label of MNAC to a benchmark designed for the Trellix Network Access System extension. Labels can also describe the function of a benchmark, such as applying a label of SOX to a benchmark that tests compliance with the Sarbanes‑Oxley standard. Labels are applied with the Trellix Benchmark Editor extension or are contained in Trellix‑supplied benchmarks.
When you assign a benchmark to an audit, the benchmark selection process includes a drop-down list that shows all available benchmark labels. You can filter benchmarks based on the label that you want to use for your audit.
Findings
Trellix Policy Auditor provides enhanced results for checks, also known as findings.
Findings appear in monitors and queries and include additional information about the state of a system that is helpful to security officers and network administrators when fixing issues. Findings are included in reports and provide additional information in audit results. For example, if an audit expects a password with at least eight characters but finds a password with only six characters, the findings show the actual and expected results.
Because it is possible to create a check that reports thousands of violations, Trellix Policy Auditor allows you to set a violation limit that reduces the number of violations that can be displayed to conserve database resources. Setting the violation limit to 0 causes monitors and queries to display all violations.
Activate benchmarks
You must activate a benchmark in Trellix Benchmark Editor before you can include it in an audit.
Task
From the Trellix ePO - On-prem console, select Menu | Risk & Compliance | Benchmarks
Find the benchmark to use in your audit and check its status. If the status is not active, select it, then select Actions | Activate.
The benchmark is activated and appears in the list of available benchmarks when you create an audit.
Note
The Content Version specifies the version number of the Trellix Policy Auditor Security Content release.
The Benchmark/XCCDF version specifies the version number of the benchmark used in Audits.
The Benchmark Content version gets updated each time we release a new Content version. The content release includes updates to one or more benchmarks.
Note
If Benchmark version column does not appear, you may add it from Actions menu.
Tailor a benchmark
Tailoring a benchmark changes the rules or rule settings used by the benchmark.
Task
From the Trellix ePO - On-prem console, select Menu | Risk & Compliance | Benchmarks.
Select a benchmark, click Tailoring, then click OK.
Select a Rule or Group, then click Tailor Values.
Change the Rule or Rule Settings, then click Save. In the Benchmark list, there are two benchmarks with the same name, one has Tailor in the Status column.
Create an audit
Audits determine whether systems comply with your security needs, and the results tell you what, if anything, needs to be done to make the systems compliant.
Before you begin
You must have permissions to add, remove, and change audits and assignments.
You must have a benchmark that you have activated for use in the audit.
A schedule-based client task audit schedules a daily, weekly, monthly, or one time audit. You select the days and times to run the audit.
Task
From the Trellix ePO - On‑prem console, select Menu | Risk & Compliance | Audits, then select Actions | New Audit.
Select a platform and label to filter the benchmarks in the Active Benchmarks pane.
For example, select the Microsoft Windows platform and the FISMA label to show only Windows benchmarks that have a FISMA label.
Note
The Content Version specifies the version number of the Trellix Policy Auditor Security Content release.
From the Active Benchmarks pane, select the benchmark for the audit, click Add Benchmark. Trellix recommends that you use only one benchmark per audit.
Note
If Benchmark version column does not appear, you may add it from Actions menu.
Choose a profile for your audit: in Selected Benchmarks, select the profile from the Selected Profile list, then click Next.
Some benchmarks don't have profiles.
Choose a method for adding systems to the audit.
Select System Tree and Tags and click Add System, Add Group, or Add Tag to add systems to the audit. You can use more than one method to add systems.
Select Criteria, then select one or more Available Properties to add to the Computer Properties pane. Use arrows in the Available Properties pane to add or remove criteria and the Comparison and Value controls lists to type or select system properties.
Under the Exclude these pane, click Add System to exclude systems from the audit, then click Next.
On the Properties page, type audit information and select options, then click Next.
On the Summary page, review the information, then click Save.
Run an audit manually
You can manually run an audit when you must view results before the next scheduled audit.
Task
Click Menu | Policy | Audits.
Select audits, then click Actions | Run Audit.
The audit runs during the next whiteout period.
Disable an audit
When an audit is disabled, Trellix Policy Auditor continues to purge information according to the schedule you have set. The audit doesn't run until you re-enable it.
Task
From the Trellix ePO - On-prem console, select Menu | Policy | Audits.
Select an audit, then click Actions | Edit Audit.
Click Next to display the properties page.
Deselect Enable this Audit, then click Next.
Click Save.
Delete audits
You can delete an audit and all associated results and findings when you no longer need them.
Task
From the Trellix ePO - On-prem console, select Menu | Policy | Audits.
Select the audits that you want to delete, then click Delete.
Audit whiteout and blackout periods
Audit whiteout periods are time intervals when an audit can run on a system or group of systems. Audit blackout periods are time intervals when an audit can't run.
Audits are not scheduled. For example, consider a benchmark that was last evaluated at 5:14 p.m. on Sunday May 6. The frequency requirement states that the information should not be older than four days. Blackout windows are set from 8:00 a.m. to 5:00 p.m. on weekdays. Whiteout windows cover the remaining period.
If the benchmark is scheduled for re-evaluation during the Thursday evening whiteout window, the frequency requirement of 4 days is calculated so the benchmark must be evaluated no later than Thursday morning.
Audit content updates sent to the Trellix ePO - On-prem server cause Trellix Policy Auditor to run the audit at the next available whiteout period.
Set whiteout and blackout periods
Set whiteout and blackout periods for running audits on systems.
Task
From the Trellix ePO - On-prem console, select Menu | Systems | System Tree, then click the Assigned Policies tab.
From the Product drop-down list, select the Trellix Policy Auditor agent.
For General, click My Default.
Click a white square, which changes to blue, to designate a period of time when audits are not allowed to run. Click a blue square, which changes to white, to designate a period of time when audits are allowed run.
Click Save.
Service Level Agreements
Service Level Agreements (SLA) are relationships that you create between system tags and patch severity levels. You then specify a number of days that you have to apply patches to systems that fit the relationship.
As an example, you assign tags to systems, such as Finance or Administrative, and check creators can assign severity levels to patch checks, such as critical or moderate. When you create a Service Level Agreement, you can specify that Finance systems missing a critical patch are given 30 days until you are required to apply the patch. Similarly, you can specify that Administrative systems failing a critical patch check are given 90 days before you are required to patch the system.
You can monitor the status of Service Level Agreements from the PA: MS Patch Status Summary dashboard monitor.
Create, edit, and delete Service Level Agreements
Create, edit, or delete a Service Level Agreement between a system tag and a patch severity.
Task
Select Menu | Risk & Compliance | Audits, then select Actions | Patch SLA to open the Service Level Agreement page.
Select one of the following:
To... | Do this... |
|---|---|
Create a new Service Level Agreement |
|
Edit an existing Service Level Agreement |
|
Delete a Service Level Agreement |
|
How viewing audit results works
Trellix Policy Auditor offers a number of options for viewing audit results.
Several options are available for viewing system and rule compliance. You can view audit results by clicking an audit from the Audits page.
Results timeframe control
The Results timeframe control allows you to view the results of an audit at any point in time since the audit first began. By default, the calendar is set to Today, which shows the results for current systems as defined by the frequency settings. A checkbox is available to show the last valid results if today's results are not current. The calendar control allows you to pick a date in the past and see the audit results for that date.
Audit Benchmarks pane
The Audit Benchmarks pane shows the status of each benchmark in the audit. You can view these columns in the pane:
Note
If Benchmark version column does not appear, you may add it from Actions menu.
Benchmark ID — Benchmark identifier.
Benchmark/XCCDF version — The version number of the benchmark used in Audits.
Profile ID — Profile identifier, if any.
Pass — The number of benchmarks passed by all systems.
Fail — The number of benchmarks failed by all systems.
pass-expired — The results have expired but the last audit results evaluated to pass.
fail-expired — The results have expired but the last audit results evaluated to fail.
other-expired — The results have expired and the previous audit results evaluated to a condition other than pass or fail.
You can click the hyperlinked number in the columns to go to the View System Results page.
View Results column (systems)
Under the View Results column, clicking systems allows you to view the results for each system audited. This is an extension of the Audit Results pane that allows you to see the results at the system level. These columns appear in the Benchmark Systems pane:
Audit Date — The date of the audit being viewed.
Expiration Date — The expiration date, if any, of the audit.
Score — The audit score for the system.
System Group — The name of the group, if any, that the system belongs to.
System Name — The name of the system.
System Tags — Any tags associated with the system.
Rules Passed — The number of rules that passed the audit.
Rules Failed — The number of rules that failed the audit.
Rules Other — The number of systems that had a result other than pass or fail.
The page provides a control that allows you to view the results by system group, system subgroup, systems with a specific tag, or even individual systems.
You can also adjust the results timeframe to select an audit to review.
View Results column (rules)
Under the View Results column, clicking rule allows you to view the rule results for each system audited. This is an extension of the Audit Results pane that it allows you to see the results at the rule level. These columns appear in the Benchmark Rules pane:
Rule ID — The benchmark rule identifier.
Group Path — The path of the group containing the rule.
Systems Passed — The number of systems that passed the audit.
Systems Failed — The number of systems that failed the audit.
Systems Other — The number of systems that had a result other than fail.
The page provides a control that allows you to view the results by benchmark rule group, benchmark rule subgroup, or a specific rule, which can be selected by clicking Find and selecting a rule.
Exporting audits and audit results
Audits and audit results can be exported in four formats: Asset Reporting Format (ARF), CyberScope, OVAL, and XCCDF. In each case, the information is saved as a .zip file. You can export an audit and transfer it to another Trellix ePO - On-prem server, or transfer to a third-party application.
Option | Definition |
|---|---|
Export ARF | Creates an Asset Reporting Format (ARF) results file that conforms to the ARF results schema. |
Export CyberScope | Creates a CyberScope file that conforms to the CyberScope standard. |
Export OVAL | Creates an OVAL results file that conforms to the OVAL results schema. This file can be consumed by any tool that understands the OVAL results schema. |
Export XCCDF | Creates an XCCDF file that conforms to the XCCDF results schema. It contains the latest results for all the systems and benchmarks in the audit. The results file could be consumed by any tool that understands the XCCDF results schema. |
Export audits
Export an audit to a file that conforms to the XCCDF or OVAL results schema.
Click Menu | Risk & Compliance | Audits.
Select the audit to export, then click one of these options.
Actions | Export ARF — Export an audit to a file that conforms to the Asset Reporting Format (ARF) results schema.
Actions | Export CyberScope — Export an audit to a file that conforms to the CyberScope standard.
Actions | Export OVAL — Export an audit to a file that conforms to the OVAL results schema.
Actions | Export XCCDF — Export an audit to a file that conforms to the XCCDF results schema.
Click Save.
Give the export .zip file an appropriate name, then click Save.
Scoring audits
When Trellix Policy Auditor performs an audit on a system, it generates information about system compliance that includes a compliance score. The software supports the four scoring models described in the National Institute of Standards and Technology (NIST) document Specification for the Extensible Configuration Checklist Description Format (XCCDF) Version 1.2 (http://csrc.nist.gov/publications/nistir/ir7275-rev4/NISTIR-7275r4.pdf):
Default scoring model
Flat unweighted scoring model
Flat scoring model
Absolute scoring model
The software is preconfigured to use a normalized implementation of the flat unweighted scoring model. You can change the scoring model and the software recalculates scores to reflect the change.
Default scoring model
The default scoring model computes the score independently for each collection of subgroups and rules in each group, and again for each rule and group in the audit's benchmarks. Despite the name of the scoring model, Trellix Policy Auditor does not use this model for its preconfigured scoring model. Instead, the software uses a normalized version of the flat unweighted scoring model that makes it easier to compare audit scores.
Calculating scores using the default scoring model
The calculated test score under the default scoring model depends on the number of groups, subgroups, and rules in benchmarks in an audit. This means that audits with large benchmarks can yield a high score while audits with small benchmarks can yield a low score. Audits can also have rules that are based on the system configuration, so it is possible, for example, for the same audit to yield one score on a Windows XP system and another score on a Windows 7 system.
Because the maximum score can vary from audit to audit and from system to system, it is hard to compare audit scores. The primary use for this scoring model is for comparing historical audit scores on the same system.
Flat unweighted scoring model
The flat unweighted scoring model computes the score (the number of rules that passed) and compares it against the maximum score. Trellix Policy Auditor is preconfigured to use a normalized implementation of the flat unweighted scoring model.
The maximum possible score is the number of all applicable rules in an audit. For example, if an audit evaluates a system against 283 rules and the system passes 212 of the rules, the flat unweighted scoring model gives the system a score of 212. Another audit might have fewer rules and yield a lower score. This makes it hard to compare results from different audits.
How Trellix Policy Auditor calculates scores
Because of the disparity in comparing audit scores, the software uses the flat unweighted scoring model and normalize the final score (maximum score of 100). It allows you compare an audit with other audits on the same system or between systems with different configurations, such as Windows XP or Windows 7.
The software uses this equation to normalize audit scores:
audit score = (rules passed ÷ maximum possible score) × 100This table shows how scores for different audits can be compared using a normalized implementation of the flat unweighted scoring model.
Table 6-1 Flat unweighted scoring model
Audit example | Maximum score | Rules passed | Flat unweighted audit score | Normalized flat unweighted audit score |
|---|---|---|---|---|
Audit 1 | 283 | 212 | 212 | 74.9 |
Audit 2 | 15 | 14 | 14 | 93.3 |
Flat scoring model
The flat scoring model compares the system score with the maximum possible system score.
The maximum possible score is the sum of the weights of all rules in an audit that apply to a system. Rules that don't apply to a system are ignored when calculating the maximum possible score. The actual score is the sum of the weight of all rules that pass.
Because the maximum possible score can vary from system to system, scores from systems that have different configurations, such as Windows XP or Windows 7, might not be directly comparable. This model is useful for comparing a system score with its historical scores.
Score weighting
The flat scoring model allows benchmarks to use weighted scores for each rule. A common example of score weighting is a school test where one question is worth more points than another question.
In this example, an audit has a benchmark with two rules. One of the rules is weighted because the audit benchmark developer considered it to be more important than the other rule.
Rule | Assigned weight | Laptop maximum rule score | Non-laptop maximum rule score |
|---|---|---|---|
Port 8015 on a laptop system is closed | 3 | 3 | 0 |
Password on any system must be 10 or more characters | 1 | 1 | 1 |
Maximum possible score | 4 | 1 |
The maximum possible audit score for a laptop is 4. On desktop systems, the software ignores the closed port rule and the maximum possible score is 1.
Absolute scoring model
The absolute scoring model yields a score of 100 when a system passes all applicable rules, and a score of 0 if all applicable rules don't pass.
This scoring model is useful when an organization requires that a system pass every rule to be considered secure. The absolute scoring model makes it easy to differentiate between systems that pass or fail an audit.
Change the scoring model
You can change the scoring model that Trellix Policy Auditor uses when reporting audit results. When you change the scoring model, the software recalculates the scores to reflect the selected model.
Select Menu | Configuration | Server Settings.
Under Setting Categories, select Policy Auditor. The Trellix Policy Auditor server settings appear in the right panel.
Click Edit.
Select the scoring model from the Default Scoring Model drop-down list.
Click Save.
Managing audit waivers
Waivers allow you to temporarily affect how systems are audited and might affect audit scores. They are useful when you have a system that you know might be out of compliance but you don't want to bring the system into compliance for a temporary period.
For example, you might have systems in the Accounting Department that you don't want to patch near the end of an accounting cycle. You can create a waiver that temporarily ignores any missing patches on systems until after the end of the accounting cycle. You can also create another type of waiver that suppresses the systems from being audited.
Types of waivers
Trellix Policy Auditor provides three types of audit waivers that apply to selected systems. Each type of waiver affects scoring results differently.
Exception waiver — Forces the audit results of a selected benchmark rule to have a result of pass. This potentially affects the score of system audits.
Exemption waiver — Prevents selected systems from being audited. Systems not audited don't appear in audit results.
Suppression — Allows a selected benchmark rule to be included in an audit, but excludes the results. This affects the score of system audits.
All waivers have these common characteristics:
A system, multiple systems, or groups of systems selected from the System Tree.
A start date and an expiration (end) date.
Exception and suppression waivers must include a selected rule from a selected benchmark. The waiver applies to any audit that contains the benchmark. Because exemption waivers are independent of benchmarks or rules, the interface does not give you the opportunity to select them.
Exception waivers
Exception waivers potentially affect the audit scores of selected systems by forcing the audit result of a benchmark rule to have a status of pass. The primary use of an exception waiver is to force audit rules to pass.
Exception waivers have these characteristics:
Apply to selected systems and groups in the System Tree.
Require you to select an audit benchmark and a rule contained in the benchmark.
Evaluate every rule during an audit, but force the selected rules to have a status of pass.
Can be backdated. Scores for results collected during the backdate time frame are recalculated.
For example, Trellix Policy Auditor audits a system with a benchmark that contains five rules. Four rules pass and one fails, resulting in a score of 80%. If the rule that failed is granted an exception waiver, all five rules are considered to have passed and the score is 100%.
Exemption waivers
Exemption waivers prevent selected systems from being audited.
Exemption waivers have these characteristics:
Apply to selected systems and groups in the System Tree.
Don't require you to select a benchmark and a rule.
Can't be backdated.
Don't audit the selected systems when the waiver is in effect.
Don't include selected systems in the audit results.
For example, Trellix Policy Auditor audits a system with a benchmark that contains five rules. Four rules pass and one fails, resulting in a score of 80%. If the system is granted an exemption waiver, it is not audited and does not appear in the audit results.
Suppression waivers
Suppression waivers potentially change the audit scores of selected systems by excluding the audit result of a benchmark rule. The primary use of a suppression waiver is to hide audit results.
Suppression waivers have these characteristics:
Apply to selected systems and groups in the System Tree.
Require you to select an audit benchmark and a rule contained in the benchmark.
Evaluate every rule during an audit, but don't include the rule result when calculating the score.
Can be backdated. Scores for results collected during the backdate time frame are recalculated.
For example, Trellix Policy Auditor audits a system with a benchmark that contains five rules. Four rules pass and one fails, resulting in a score of 80%. If the rule that failed is granted a suppression waiver, the rule results are excluded and the score is 100%.
Waiver status
Waivers can have one of four status properties.
Status | Description |
|---|---|
Requested | A waiver has been requested but approval has not been granted for it to take effect. Requested waivers don't appear on the Waivers tab, but appear in the Issue Catalog (go to Menu | Automation). Requested waivers can be deleted. |
Upcoming | A waiver has been requested and granted approval but the waiver is not in effect because the start date has not yet arrived. Upcoming waivers can be deleted. |
In-effect | A waiver is active and audits involving the system specified by the waiver temporarily affect the scoring of the system. In-effect waivers cannot be deleted but can be canceled to give it a status of expired. |
Expired | A waiver is no longer in effect, because of user intervention or the expiration date has arrived. Expired waivers cannot be deleted. |
Filter waivers by status
Trellix Policy Auditor allows you to filter waivers according to a date that you select.
You can filter waivers by their status.
Select Menu | Risk & Compliance | Waivers.
From the System Tree, select a group that contains waivers of different status.
Use the Status drop-down list to select a status. The waivers are filtered according to the status you choose.
How start and expiration dates work
Waivers are effective for a limited time only. When you create a waiver, you specify a start date and an expiration date.
Start date — When the waiver takes effect. The start date is inclusive.
Expiration date — When the waiver is no longer in effect. Must be at least one day after the start date. The expiration date is not inclusive.
For example, if you set a start date of March 1, 2014 and an expiration date of April 1, 2014, the waiver affects audits from March 1, 2014 through March 31, 2014. An audit conducted on April 1, 2014 is not affected by the waiver.
Examples of filtering waivers by date
When you filter waivers by date, Trellix Policy Auditor shows waiver status as of the selected date. The status might change according to the date you select for filtering.
These assumptions apply to the filtering examples:
Today's date is November 10, 2014.
Waiver A has a start date of November 1, 2014 and an expiration date of November 15, 2014.
Waiver B has a start date of November 15, 2014 and an expiration date of December 1, 2015.
Filter by today's date | Filter by a future date | Filter by a past date |
|---|---|---|
Next to the As of date, click Today. The date is set to today's date of November 10, 2014. The Waivers tab shows:
| Next to the As of date, select November 15, 2014. The Waivers tab shows:
| Next to the As of date, select October 1, 2014. The Waivers tab shows:
|
Filter waivers by date
Select Menu | Risk & Compliance | Waivers.
Use the calendar control next to As of to select a different date.
The Waivers tab shows the status of each waiver as of the selected date.
Filter waivers by group
Trellix Policy Auditor allows you to filter waivers by the group selected in the System Tree.
Select Menu | Risk & Compliance | Waivers.
From the System Tree, select the group with the waivers.
From the Filter drop-down list, select This Group Only. The Waivers tab shows only the waivers for systems in the selected group.
From the Filter drop-down list, select This Group and all Subgroups.
The Waivers tab shows waivers for systems in the selected group and any subgroups of the selected group.
How waiver requests and grants work
Trellix Policy Auditor shows waivers on the Waivers page when a user with the proper permissions grants approval for the waiver to take effect.
Depending upon the internal security policies of your organization, the users who request waivers and the users who grant them can be different. A user who has permissions to request and grant waivers can create a waiver and grant it at the same time.
Request waivers
Trellix Policy Auditor allows you to request a waiver. If a user only has permissions to request waivers, another user who has permissions to grant waivers must grant the waiver before it appears on the Waivers page.
If you have the correct permissions to grant waivers, you can create and grant the waiver in a single step. Requested waivers appear in the Issues Catalog.
Select Menu | Risk & Compliance | Waivers, then click New Waiver.
Type a name for the waiver. In the Notes box, type descriptive information that you want to associate with the waiver.
From the Waiver Type drop-down list, select the type of waiver that you want to create.
Use one or both of these options to select systems to apply the waiver to:
Add Systems — Type the system name, IP address, MAC address, or user name that you want to search for. If you don't know the full name or address, you can type a partial search, like
172.21. Click OK to open the Search Results page.Add Group — For each group you want to add, select it from the System Tree, then click OK.
Select the systems that the waiver applies to, then click OK to open the Waiver Request page.
For exception and suppression waivers, select a benchmark and rules.
Exemption waivers don't require a benchmark and a rule.
Use the calendar control next to Start Date and Expires Date to select dates for the waiver to be in effect.
Click Request Waiver. If you have permissions to grant waivers, you can click Grant Waiver and the waiver appears in the Waivers tab.
Note
The requested waiver does not appear in the Waivers tab because the waiver has not been granted yet. Requested waivers appear in the Issues Catalog (Reporting | Issues).
Grant waivers
Users with the permission to grant waivers can approve waivers requested by others.
Task
Select Menu | Automation | Issues.
Select a requested waiver, then click Edit.
Click Grant Waiver.
The waiver is now approved to take effect on the start date.
End a waiver
You can make a waiver expire. This is useful when you have a waiver with a status of In-effect and you want to end the waiver before the expiration date.
Task
Select Menu | Risk & Compliance | Waivers.
Select a waiver with a status of In-effect, then click View.
Click Expire Waiver.
The waiver has a status of Expired.
Delete waivers
You can delete a waiver before it takes effect. You can only delete waivers with a status of Upcoming.
Task
Select Menu | Risk & Compliance | Waivers.
Select a waiver with a status of Upcoming, then click View.
Click Delete Waiver.
The deleted waiver no longer appears on the Waivers tab.
Scanning the inventory
Scan for inventory items such as applications, operating systems details, and ports in use. This allows you to monitor and log changes of these inventory items, and helps you identify deviations from a baseline.
Supported inventory scan items:
Applications – Scans and reports all installed applications in the systems. Applications also include:
Patches
Windows Apps
Windows features
Package Manager Applications
Browser extensions and plug-ins
Services – Scans and reports all services in the systems.
Ports – Scans and reports all ports in the systems.
Important
When scanning for ports on Linux systems, ensure that the systems have
netstatinstalled for the scan to be successful.
Operating System – Scans and reports all Windows and Non-Windows operating systems in the systems.
Network Interfaces – Scans and reports network-related information. Information includes:
IPv4 or IPv6 addresses
MAC address
DHCP enabled
Default gateway
Primary and secondary DNS
System Information – Scans and reports system-related information. Information includes:
FQDN
GUID
System or motherboard serial number
System manufacturer and model
BIOS, BIOS vendor, version, and release date
Registered Extensions – Scans and reports all file types in the systems. For example, *.txt, *.exe, and *.dll.
Create an inventory scan client task
This Trellix ePO - On-prem client task allows you to define the inventory items to include in the scan.
From the Trellix ePO - On-prem menu, select Policy | Client Task Catalog.
Under Client Task Types, select Trellix Policy Auditor (Advanced Host Assessment), then select New Task.
From the drop-down, select Inventory Scan, then click OK.
Enter a task name and description, and set up the task.
Choose whether to reset the baseline scan data.
Note
Enable Reset Baseline whenever you edit and make changes to the client task. By design, the scan result includes only the difference in baseline from the last scan results, if this option is not enabled. This could result in incomplete data for the newly selected inventory item in the scan task.
Choose whether to synchronize the scan results.
Synchronize scan option populates the latest data from the previous scan.
Choose the inventory items to scan.
Click Save.
Assign and schedule an inventory scan client task
After you have created the client task to scan the inventory, you need to assign it to a group or system.
From the Trellix ePO - On-prem menu, select Risk & Compliance | Advanced Host Assessment Scans.
From Actions, select New Inventory Scan.
Select a group, then select OK, and then on the Select Task page, make the following selections:
Product – Trellix Policy Auditor (Security Assessment)
Task Type – Inventory Scan
Then select the task you created for the inventory scan.
Set up the task inheritance, system tag criteria, and schedule, then click Save.
Run an inventory scan for a specific system
You can run a immediate inventory scan on an individual system from the System Tree.
From the Trellix ePO - On-prem menu, select Systems | System Tree.
Select a group, then select the system.
From Actions, select Host Inventory | Scan Now.
In the Scan Now dialog, select Inventory Scan, then select OK.
Run a scan manually using command line
You can run a scan locally on a system if it doesn't communicate with your Trellix ePO - On-prem.
Before you begin
The system must be managed by your Trellix ePO - On-prem.
The system must have Trellix Policy Auditor installed.
You must create a client task for the specific system or its group. The collection items in the client task must match the collection items of your manual scan.
If a system is located in an air gap network and it doesn't communicate with your Trellix ePO - On-prem, you can run an inventory scan on the system locally. This allows you to keep your inventory scan record up-to-date for all managed systems.
Task
Log on to the system that you want to scan, then open command prompt or terminal.
Important
On Windows, open command prompt as an administrator.
On non-windows, open terminal using a account that has sudo access.
Set the directory to the installation location of the Trellix Policy Auditor Phoenix engine.
The default installation location is:
For Windows:
C:\Program Files (x86)\McAfee\Policy Auditor Agent\PhoenixFor Non-windows:
/opt/McAfee/auditengine/phoenix/
Run the following command:
./phoenix_engine_main -m inventory -i inventory_task_settings.json --opcode export --policyThe output is a .zip file. It is saved with a file name in <Agent Guid>.zip format. Where <Agent GUID> is the GUID of the agent of this system.
The .zip file is saved at the installation location of the Trellix Policy Auditor Phoenix engine.
Note
The command doesn't allow you to choose the inventory items to scan. When you run the command, all inventory items are scanned.
Transfer the .zip file to your Trellix ePO - On-prem server.
Import inventory scan report manually
You can manually import inventory scan results of a system that doesn't communicate with your Trellix ePO - On-prem.
Before you begin
You must have run the inventory scan at the remote system.
You must have access to the inventory scan result from your Trellix ePO - On-prem. The exported .zip file is imported to your Trellix ePO - On-prem.
You must created an inventory scan for the specific system or its group on your Trellix ePO - On-prem.
Task
From the Trellix ePO - On-prem menu, select Risk & Compliance | Advanced Host Assessment Scans.
Select Actions | Import Scan Results.
Click Choose File, then select the inventory scan result that you exported from the scanned system.
Click Open, then click OK.
View an inventory scan report
Your inventory scan results gives you a detailed or limited view of the inventory scan items.
Task
Note
The level of detail in your scan result depends on your choice while creating the scan task.
Note
PA Server performs a version check before processing the inventory scan results. If the PA agent version is less than 6.4.3, the results are not processed by the server further.
From the Trellix ePO - On-prem menu, select Risk & Compliance | Advanced Host Assessment Scans.
From the list of inventory scan tasks, select a task.
From the System Name section, select a system.
The Host Inventory Results section lists all the inventory items. The Inventory Results for System section lists the results for the selected inventory item.
Optimize disparate data
You can apply criteria across data collected through inventory scan to gather more insights.
Before you begin
The feature is provided as a stored procedure for SQL Server Management Studio. The stored procedure is copied automatically while you install Policy Auditor 6.4.
Ensure that you have administrator privileges to log in to SQL Server Management Studio.
Task
Open SQL Server Management Studio.
Log on to your SQL Server that hosts the Trellix ePO - On-prem database.
From the Object Explorer, navigate to
<SQL Server name>| Database |ePO_<server name>| Programmability | Stored Procedures.From the list of stored procedures, right-click on
dbo.PASecurity_Scan_Result_DisparateData_Process, then select Execute Stored Procedure.Identify the necessary parameters, then enter your criteria in SQL syntactically correct statement in Value.
Enter the value for the corresponding WhereClause in SQL syntactically correct statement in Value.
Important
Log on account must have administrator privileges.
Note
Ensure that you enter the correct value for the WhereClause. The procedure shows incorrect values or return null if WhereClause is empty, null, or incorrect.
Purge scan data
You can purge scan data and keep an up-to-date record by removing data that are older than a specific number of days.
Before you begin
We recommend you do not delete a scan task.
The Purge scan data task does not remove the scan data from the repository. This mechanism allows inventory scan to fetch only the delta and present a complete result. To delete scan data from the repository, ensure that you use Delete all scan results.
Task
From the Trellix ePO - On-prem menu, select Automation | Server Tasks.
In the Server Tasks page, select New Task.
Enter a name for the task and then in Schedule Status, select Enable, then click Next.
From the 1. Actions drop-down, select PA: Purge scan data.
In Purge application removal data older than (in days), enter the days. The server task removes scan data on removed application based on the value entered in this field.
Select Delete all the scan results, then click Next.
Ensure that you disable this option after its purpose is served. If this option is not disabled, all scan results are deleted with every scheduled scan.
7 Configure the schedule for this task, then click Next, and then click Save.
Using file integrity monitoring and entitlement reporting
File integrity monitoring notifies you of changes to specified text files on managed systems. Entitlement reporting informs you of changes to user and group rights to files. These features are useful for complying with government and industry standards, such as the Payment Card Industry (PCI) Data Security Standard.
How file integrity monitoring works
The file integrity monitoring feature uses the Trellix Policy Auditor agent to track file changes to specified text files. The software monitors files on managed systems only. You must install the Trellix Agent and the Trellix Policy Auditor agent on systems that you monitor.
When a file is scanned, the agent plug-in returns an event to the Trellix Policy Auditor server. The event is encrypted and compressed to save disk space and bandwidth. When you create a policy to monitor files, the software checks the file for changes every hour by default. You can change the monitoring frequency to fit your organizational needs.
File integrity monitoring allows you to:
Define which files should be tracked. You can use wildcard characters in file and path names.
Define which files should not be tracked.
Specify the frequency for detecting file changes.
See and receive notification about changes to the file or file attributes.
Trellix Policy Auditor also provides the ability to retain up to six file versions, including the baseline version, and provides the ability to:
Compare a file with its baseline version, or any prior version.
Compare a file with a file on another system.
Show a side-by-side comparison of file changes and indicate which lines have been added, deleted, or modified.
File information monitored
The file integrity monitoring feature of Trellix Policy Auditor tracks a number of file attributes. A change in an attribute generates an event notifying you of the change. The monitored attributes differ between supported operating systems. The software monitors these attributes on all operating systems.
File size (in bytes)
File created (date and time)
Hidden
System
Last modified (date and time)
Read only
Owner
Group
On Windows systems, the software monitors these attributes, plus the Archive attribute and permissions from the Discretionary Access Control List (DACL)
File baselines
When you create and apply a policy, the agent plug-in scans the file to create a baseline. The baseline contains information about the file attributes, and contains the file text if file versioning is enabled.
If the file is changed, the software generates an event that is logged to the File Integrity Monitor page, included in reports, and can be handled by the issues and tickets feature of Trellix ePO - On-prem.
Trellix Policy Auditor monitors the MD5 and SHA-1 hashes of a file as well as the file attributes and permissions information. These values are stored in a database that is created on each system and on the software server.
Each time the file is scanned, the software compares its configuration to the baseline. When the file or an attribute changes, the agent plug-in detects the change and sends an event back to the server according to the monitoring frequency. If versioning is enabled, the text file contents are sent to the server as well.
Monitored and excluded files
You can create a policy to monitor file changes on a regular schedule. The interface allows you to specify files to monitor and files to exclude from monitoring. It also provides the capability to monitor subfolders under each specified path and to monitor symbolic links.
Wildcard characters
Monitored and excluded paths and file names support the * and ? wildcard characters. The * wildcard character represents one or multiple characters and the ? wildcard represents a single character.
You can choose to monitor a single file by typing the name of the file when you create a file integrity monitoring policy. By using wildcard characters, you can monitor files or paths of a specific type. For example, if you type ?:\Config for the path and *.txt for the file, Trellix Policy Auditor monitors all text files in the Config folder on all hard drives. You can exclude specific paths and files in a similar manner.
File validation
Trellix Policy Auditor does not validate the existence of files. It ignores paths or files that don't exist.
File versioning
Trellix Policy Auditor allows you to store up to six versions, including the file baseline, of text files from managed systems. The software does not support versioning for non-text files.
Note
The actual text files are not stored in the software database. The database stores the text file contents for quick comparison purposes, even when the system is not connected to the network.
When you create a policy, you have the opportunity to store file versions for comparison purposes. The number of file versions you can store ranges from 2–6. This number includes the baseline version.
File versions are stored on a First In, First Out (FIFO) basis. For example, if you configure the software to store three versions, it stores the baseline version plus the two most recent versions. If the file changes, the oldest non-baseline file is purged to recover disk space by an internal server task that runs once a day by default.
Configuring the maximum number of stored file versions
When you create a file integrity monitoring policy, you can specify the maximum file size stored for each version with the Max versioned file size setting. The available settings range from 1 MB to 4 MB.
For example, if you set Max versioned file size to 3 MB, the text in the file is stored when its size is less than or equal to 3 MB. If the file size exceeds 3 MB, the software alerts you with an error message. If you receive an error message, you can edit the policy so that it stores text from files as large as 4 MB.
File version comparison
The comparison feature allows you to view the contents of a versioned file and compare the text file content with other files. The software uses a color-coding system to identify file lines that are equal, empty, deleted, inserted, or modified.
You can compare a stored version of the text with:
The file baseline.
Previous file versions.
A specified file on another system.
Double-byte characters
The file version comparison feature supports files containing only single-byte characters in the file name and contents. It does not support file comparison for files containing double-byte characters.
Accepting file integrity monitoring events
When a monitored file changes, it generates an event that you can accept.
You can accept events from the File Integrity page or from pages that you drill down to in reports.
Accepting an event designates the changed file as the new baseline version and purges, or deletes, any previous versions.
Accepting multiple events designates the most recently changed files as the new baseline version and purges any previous version.
Accepting an event for a versioned file sets it as the new baseline version and purges previous versions of the file.
You can also accept events from the file integrity monitoring query reports drill-down pages.
About purging file integrity monitoring events
You can purge, or delete, file integrity monitoring events. The software purges events based on a selected age. You can also choose to purge baseline events.
Purging events does not set a new baseline. If you select the option to purge baseline events on a versioned file, you cannot compare later files with the purged baseline file. However, you can compare file versions that have not been purged.
If you purge a baseline file, the software discards the stored baseline file information, including stored text if versioning is enabled. The software retains the baseline file hash information and sends events with new file information when the file changes.
You can also purge events from the last page shown when you drill down into file integrity monitoring query reports.
Purge file integrity monitoring events
Task
Select Menu | Reporting | File Integrity, then click the Events tab.
Select the file events to purge, then select Actions | Purge.
Edit the options to purge events older than the specified time. Select Purge Baseline Events to discard stored baseline settings, including the file text if versioning is enabled.
Click OK.
Entitlement reporting
Entitlement reporting informs you of changes to user and group rights to files. Changes to the access permissions entitlement of a file generates an event notifying you of the change.
One aspect of compliance monitoring is knowing which accounts have access to which files. Trellix Policy Auditor monitors these access permissions:
User — User who has access to the file.
Is Group — Whether the user is a group.
Read Data — Whether the user has the ability to read the file.
Write Data — Whether the user has the ability to write to the file.
Execute — Whether the user has the ability to execute the file.
Delete — Whether the user has the ability to delete the file.
Create and apply a file integrity monitoring policy
Using a file integrity monitoring policy is a two-stage process. First, you must create the policy. Next, you must apply the policy to selected systems in a System Tree group. You can create one policy per group.
Tasks
Create a file integrity monitoring policy on page 55
Create a policy to monitor file integrity, file entitlement, and version changes.
Apply a policy to systems on page 56
When you create a file integrity monitoring policy, you can apply it to systems in a selected System Tree group. You can apply one file integrity monitoring policy to a group.
Compare file versions on page 57
When you enable file versioning, you can compare a file with a previous version, the baseline file, or a file on another system.
Accept file integrity monitoring events on page 58
Trellix Policy Auditor generates events when monitored files change. You can accept events and automatically create a new file baseline.
Purge file integrity monitoring events on page 54
Trellix Policy Auditor generates events when monitored files change. You can purge events based on their age.
Create a file integrity monitoring policy
Create a policy to monitor file integrity, file entitlement, and version changes.
Task
Select Menu | Policy | Policy Catalog.
From the Product drop-down list, select Policy Auditor Agent 6.2.0.
From the Category drop-down list, select File Integrity Monitor.
Select Actions | New Policy.
Provide information about the new policy:
Option | Definition |
|---|---|
Category | Select File Integrity Monitor. This is selected by default. |
Create a policy based on this existing policy | Select an existing policy, such as My Default, or another file integrity monitoring policy. |
Policy Name | Type a name for the policy. |
Notes | Type information about the policy. This field is optional. |
6 Click OK. The policy configuration page opens. Use the tabs to configure the policy.
Table 9-1 Monitor tab
Option | Definition |
|---|---|
Add | Open the Monitor Item page:
|
Edit | Change the configuration of the selected file. |
Max versioned file size (1-4 MB) | Select the maximum size of the files in the policy. You can only use versioning on text files. This has no effect on files that don't have versioning enabled. |
Remove | Remove the selected file from the list of files to be monitored. |
Table 9-2 Exclude tab
Option | Definition |
|---|---|
Add | Open the Exclude Item page:
|
Edit | Change the configuration of the selected file. |
Remove | Remove the selected file from the list of files to be monitored. |
Table 9-3 General tab
Option | Definition |
|---|---|
Run every | Set the monitoring frequency for the file. By default, this is set to one hour. |
7 Click Save.
Apply a policy to systems
When you create a file integrity monitoring policy, you can apply it to systems in a selected System Tree group. You can apply one file integrity monitoring policy to a group.
Select Menu | Systems | System Tree.
Select the System Tree group where you want to apply the policy.
On the Systems tab, select the systems where you want to apply the policy.
From the Product drop-down list on the Assigned Policies tab, select Policy Auditor Agent 6.2.0.
Click Edit Assignment for a policy with a category of File Integrity Monitor. Under the Actions column heading, click Edit Assignment.
Select Break inheritance and assign the policy and settings below.
From the Assigned policy drop-down list, select a file integrity monitoring policy.
Click Edit Policy to make changes to the policy.
Click New Policy to create a new policy based on the selected policy.
Lock or unlock policy inheritance based on your needs. If you lock inheritance, you can't create a new policy based upon this policy that breaks inheritance.
Tip
Trellix recommends that you unlock policy inheritance for file integrity monitoring policies.
9 Click Save.
Compare file versions
When you enable file versioning, you can compare a file with a previous version, the baseline file, or a file on another system.
Select Menu | Reporting | File Integrity, then select the Events tab.
Select a versioned file event, then select Actions | Compare.
The file in File 1 is the file you selected. Use the drop-down lists to select another file or a different file version. Click Preview to see the file contents.
Select the options for the File 2 panel.
Option | Definition |
|---|---|
Compare with the baseline on the above host | Compare the file in the File 1 pane to the baseline version. |
Compare with the previous version on the above host | Compare the file in the File 1 pane to the previous file version. |
Select a file | Select another file for comparison on the system or another system:
|
5 Click Run Comparison.
Option | Definition |
|---|---|
Show/Hide Attributes | Show or hide the file attributes. |
Context Size | Sets the number of lines to show surrounding lines from the empty, deleted, inserted, or modified lines in File 2. |
Accept file integrity monitoring events
Trellix Policy Auditor generates events when monitored files change. You can accept events and automatically create a new file baseline.
Select Menu | Reporting | File Integrity, then click the Events tab.
Select the file events to accept, then select Actions | Accept.
Purge file integrity monitoring events
Trellix Policy Auditor generates events when monitored files change. You can purge events based on their age.
Select Menu | Reporting | File Integrity, then click the Events tab.
Select the file events to purge, then select Actions | Purge.
Edit the options to purge events older than the specified time. Select Purge Baseline Events to discard stored baseline settings, including the file text if versioning is enabled.
Click OK.
Create a new file integrity monitoring baseline
You can create a new file integrity monitoring baseline for all monitored files on a system.
Note
Use the
Acceptcommand on the File Integrity Events page to accept events for files and automatically create new baselines.
Task
Select Menu | Reporting | File Integrity, then select the Systems tab.
Select a system, then click Actions | Reset Baseline.
Click Yes.
Query reports for file integrity monitoring
Trellix Policy Auditor provides four built-in query reports for file integrity monitoring.
Each report provides information about events and allows you to drill down to see detailed information. The query reports also allow you to accept or purge events and to compare file versions if file versioning is enabled. You can edit the queries, make new queries based on the existing queries, and add the queries to a dashboard.
PA: File Integrity - All Events
Displays an aggregated count of file integrity events grouped by the associated baseline date.
PA: File Integrity Event Counts
Displays a pie chart of file integrity events grouped by event type.
PA: File Integrity Events By System/Baseline Date
Displays a list of the file integrity exceptions encountered after a baseline reset, grouped by system and baseline date.
PA: File Integrity Events By System/Event Type
Display an aggregated count of file integrity events grouped by system.
Using rollup reporting
You can run queries that report on summary data from multiple Trellix ePO - On-prem databases. Trellix Policy Auditor can use this feature to create rollup reports for audit results.
Rollup capabilities
You can roll up three types of audit information from multiple servers.
The software provides rollup capabilities for these areas of audit information:
Benchmark results
Rule results
Check results, including patches
Each of these areas is independent and any combination of the three can be rolled up. You can include information from each of the areas because the data is related.
Rollup reporting considerations
You should carefully plan your rollup reporting configuration before implementing the feature.
Here are some issues to consider:
The volume of audit results can be substantial. Care should be given to only roll up essential data. This is especially true for rules and checks.
The actual time to complete the initial roll up reporting run varies based on the amount of data in the source databases. Future runs take less time if performed at frequent intervals. If the sources have a large amount of data, the roll up process might take several hours to complete. Each time the roll up server tasks are run, they appear in the Server Task Log to show the status of the process.
When creating reports, only include data that is being rolled up. Otherwise results might not be accurate. For example, if only rule results are being rolled up by a server task, don't include benchmark results in the report.
Rollup server tasks
Trellix Policy Auditor includes three predefined server tasks to provide rollup reporting. The tasks are disabled by default.
The tasks can roll up information to provide a meaningful view of audit results from multiple servers. The server tasks have predefined settings that don't limit the data returned. You can configure the settings by editing the tasks from the server tasks page.
Roll Up Data - PA Audit Benchmark Results
You can view rolled up information for audit benchmark results.
Data rolled up | Actions |
|---|---|
Audit Benchmark Result |
|
Benchmark Text Rollup |
|
Benchmark Version Rollup |
|
Rollup Data - PA: Audit Rule Result
You can view rolled up information for audit rule results.
Option | Description |
|---|---|
Audit Rule Result Rollup |
|
Benchmark Text Rollup |
|
Group Text Rollup |
|
Group Tree Rollup |
|
Roll Up Data - Audit Check Result
You can view rolled up information for the presence of software patches.
Data rolled up | Actions |
|---|---|
Audit Check Result Rollup |
|
Audit Check Definition Rollup |
|
Audit Check Text Rollup |
|
Group Tree Rollup |
|
Rollup reports
Trellix Policy Auditor comes with a number of predefined rollup reports. You can use these reports or use them as starting points to create new reports to fit your organizational needs.
The predefined reports show different aspects of audit results and use aggregation and grouping to help you interpret the information. You can drill down into each of the reports to find more detailed information.
PA Rollup Audit Rule Results Pass-Fail-Other — Shows audit rules by status.
PA Rollup Benchmark Results - Failed by Scoring Category — Shows benchmark results, categorized by scoring category, where the system failed the audit benchmark.
PA Rollup Benchmark Results - Pass-Fail-Unknown — Benchmark results categorized as pass/fail/unknown.
PA Rollup Benchmark Results - Pass-Fail-Unknown by Server — Benchmark results categorized as pass/fail/unknown, grouped by server.
PA Rollup Failed Audit Rule Results By Rule — Displays failed audit results grouped by rule title and rollup server.
PA Rollup Failed By Actual Result, Benchmark, Group, Server — Displays the actual results of a rule that failed during an audit. Data is grouped by server, benchmark, benchmark group and actual result. The average score is also displayed.
PA Rollup Failed Rules By Group And Server — Displays the rules that failed when audited, grouped by benchmark group and server.
PA Rollup Patch Compliance Grouped by Server and Status — Displays the rolled up patch compliance status grouped by server and status. Counts reflect the number of patches in the status.
PA Rollup Patch Compliance Overview — Displays the rollup count of patches grouped by compliance status.
PA Rollup Patch Status by Benchmark, Server and Status — Displays the rollup patch status grouped by benchmark, server, and status.
PA Rollup Patch Status by Status, Benchmark, and Server — Displays the rollup patch status grouped by status, benchmark, and server.
PA Rollup Patch Status Grouped by Benchmark, Status and Server — Displays the rollup patch status grouped by benchmark, server, and status.
PA Rollup Patch Status Grouped by Server and Status — Displays the rollup of patch status grouped by server and status.
PA Rollup Patch Status Grouped by Status and Server — Displays patch status grouped by status and server.
PA Rollup Rule Results By Result and Server — Displays rules results that have been reported, grouped by result and server.
PA Rollup Rule Results By Server and Result — Displays the audit rule results grouped by each rollup server.
Configure rollup reporting
Configure rollup reporting on a server to collect summary information from multiple servers.
Task
Set up your servers according to Multi-server rollup querying in Trellix ePolicy Orchestrator - On-prem Product Guide. Register each server with the reporting server.
On each server, including the rollup server, select and configure these data types in a server task:
Audit Benchmark Result Rollup
Audit Check Result Rollup
Audit Rule Result Rollup
Configure and enable the Roll Up Data (Local ePO Server) server task on the reporting server.
Using findings
Findings supplement the results of an audit check with additional information about the state of the system. Instead of seeing a value of false for a test result, findings give more meaningful information such as The minimum password length is set to 6 but it should be set to 8 or higher .
How findings work
Trellix Policy Auditor reports findings for supported checks. Findings are enhanced audit results. They appear in interface pages and queries and include additional information about why a system failed a check.
The software is installed as a separate Trellix Policy Auditor module called Findings and is exposed to Trellix and third-party applications through a Java API. This allows other applications to:
Report additional details about findings.
Perform custom actions on findings such as remediation on violations.
Waive or hide selected findings.
Ignore findings.
Findings can include three types of information:
Violations — Reporting violations provides additional information in audit results. For example, if an audit expects a password with at least eight characters but finds a password with only six characters, the results show the actual and expected results. It is possible to create a check that reports thousands of violations. To conserve database resources you can set a violation limit that reduces the number of violations that can be displayed. Setting the violation limit to zero causes monitors and queries to display all violations.
Compliant — A message is displayed when the system complies with the audit.
Incomplete — A message is displayed when the results gathered are not complete because they exceed the violation limit.
Types of violations
Violations are one of the types of information that can be shown by findings.
Violations can be one of three subtypes:
Positive feedback — Additional information is shown when a rule passes. For example, if a rule determines whether the password age of a system is less than 90 days and the password is 60 days old, the enhanced results show that the expected value is <90 and the actual value is 60.
Violation with actual and expected values — Additional information is shown when a rule fails. For example, if a rule determines the password of a system has eight or more characters and the password has six characters, the enhanced results show a violation with the expected value of 8 and the actual value of 6.
Violation with instance data — Additional information is shown for each instance of a violation, up to the violation limit. For example, if a rule asserts that folder ABC can only be accessed by administrators and the folder is shared, the enhanced results show every user that has access to the folder. If the number of users that have access to the folder is greater than the violation limit, then the additional violations don't appear in the report or query.
Violation limit
For some checks, failure can result in many violations. To save processing time, bandwidth, and disk space, Trellix Policy Auditor provides a violation limit that allows you to cap the number of violations shown.
The violation limit sets the maximum number of violations that are created for a specific check. The default violation limit is 300. Setting the violation limit to zero shows all violations.
You can change the violations shown globally through the system settings. You can also configure how violations are retained and purge by using per audit data maintenance, which allows you to override global system settings at the individual audit level.
Other findings enhancements
Findings provide additional enhancements that improve the user experience.
Trellix Policy Auditor gives users the ability to:
Import third-party findings, such as stylesheets and messages. You can import findings from the Checks page of Trellix Benchmark Editor.
Hide or unhide findings.
Hide or unhide findings
You can hide or unhide selected findings for a failed check contained in an audit with at least one failed result.
Select Menu | Risk & Compliance | Audits, then click an audit.
In the Rules Failed column, click a number.
Under the Result column, click fail for a rule.
From the Checks pane, click Results.
Select the findings that you want to hide or show.
Use this... | To do this... |
|---|---|
Actions | Hide Findings | Hide findings in reports for the check in this audit. |
Actions | Unhide Findings | Show findings in reports for the check in this audit. |
Using dashboards and queries
Dashboards allow you to keep constant watch on your environment. Dashboards are collections of monitors, or reports. Monitors can be anything from a chart-based query to a small web application that is refreshed at a user-configured interval.
You can create your own dashboards from query results or use the Trellix Policy Auditor default dashboards. Users must have the appropriate permissions to use and create dashboards.
Are you setting up dashboards for the first time?
When setting up dashboards for the first time:
Decide which default dashboards and default monitors that you want to use.
Create any needed dashboards and their monitors.
See the Trellix ePO - On-prem documentation for detailed information about how to build query reports that can be added to a dashboard.
Reporting queries and systems deleted from the System Tree
Trellix Policy Auditor deletes audit results based on the policy audit retention settings. This means that audit results are not deleted when a system is removed from the Trellix ePO - On-prem System Tree. Because of this, Trellix Policy Auditor reporting queries cannot use permissions based on the System Tree or a subset.
If a Trellix ePO - On-prem user has access to run or create report queries, the report shows audit results for all systems that have had results collected and maintained according to the policy audit retention settings. This also applies to systems deleted from the System Tree.
Trellix Policy Auditor default dashboards
Trellix Policy Auditor ships with seven default dashboards, each of which has its own default monitors.
All dashboards are owned by the Trellix ePO - On-prem Administrators. Administrators must make additional dashboards active and public before other users can view them.
When you log on to Trellix ePO - On-prem, these are the visible Trellix Policy Auditor dashboards.
PA: Applications Summary
PA: Compliance Summary
PA: MS Patch Status Summary
PA: Operations
PA: Patch Supersedence
PA: PCI Summary
PA: Scans Summary
PA: Systems Summary
PA: Top 10 Host Inventory
You can make other dashboards visible from the Dashboards page by clicking Options | Select Active Dashboards, and selecting Available Dashboards.
PA: Applications Summary
The PA: Applications Summary dashboard provides a high-level overview of the number of installed and removed applications and their variations. The dashboard also allows you to drill-down each list item for detailed information. The drill-down allows you to view the systems associated with an application, patch, or browser extension.
PA: Applications Summary
The monitors included in this dashboard are:
Discovered Applications – Displays a list of Installed applications. The list also displays the number of systems where these are installed.
Discovered Applications Version(s) – Displays a list of all installed software and their versions. The list also displays the number of systems where the software is installed with each row for individual versions.
Discovered Software Patches – Displays a list of software patches installed. The list also displays the number of applications that has the patches applied.
Discovered Browser Extensions – Displays a list of installed Browser extensions. The list also displays the number of browsers discovered with the extensions.
Removed Applications – Displays a list of all removed applications and their versions. The list also displays the number of systems from which the software was removed with each row for individual versions.
PA: Compliance Summary
The PA: Compliance Summary dashboard provides a high-level overview of audit results with links and drill down access to detailed information.
PA: Compliance Summary dashboard
The monitors included in this dashboard are:
PA: Benchmark Results - Pass/Fail/Unknown — Displays a pie chart, grouped by benchmark results and classified by status.
PA: Benchmark Results - Failed by Scoring Category — Displays a pie chart grouped by scoring category.
PA: Rule Results By Benchmark Group — Displays a grouped bar chart with each bar representing the number of benchmark results. The benchmark results are categorized by benchmark group.
PA: Benchmark Results - Fail/Unknown by L1 Group — Displays a grouped bar chart of benchmark results, with each bar representing the number of benchmark results. The chart is categorized by first-level System Tree group where the system status is failed or unknown.
PA: Waivers In Effect — Displays a list of waivers currently in effect, grouped by first-level System Tree group and classified by type of waiver.
PA: Errors by Rule — Displays rules from audits that fail with a result of error.
PA: MS Patch Status Summary
The PA: MS Patch Status Summary dashboard is a set of monitors providing a high-level overview of Microsoft patches with links and drill down access to detailed information.
PA: MS Patch Status Summary dashboard
The monitors included in this dashboard are:
PA: Status for MS Patch Benchmarks — Displays a bar chart representing the deployment of all Microsoft patches, classified by status:
PA: MS Critical Patch Status — Displays a pie chart representing the deployment of all critical Microsoft patches
PA: MS Unpatched Systems Grouped by MS Patch — Displays the unpatched checks grouped by check ID.
PA: MS Patch Status Grouped by Tag — Displays a bar chart of patch status grouped by tag.
PA: MS Patch Status Grouped By Severity — Displays the patch status of Microsoft patches grouped by the vendor-assigned severity.
PA: Trend of Unpatched Critical MS Patches — Displays the deployment status of all critical unpatched Microsoft patches by month. The count displayed for each month is the number of critical patches that are not patched.
PA: Operations
The PA: Operations dashboard is a set of monitors providing a high-level overview of information about the database, unprocessed audit results, unprocessed findings results and agent events.
PA: Operations dashboard
The monitors included in this dashboard are:
PA: Unprocessed Audits Results by Audit — Displays unprocessed audit results grouped by audit.
PA: Unprocessed Finding Results by Audit — Displays unprocessed finding results grouped by audit.
PA: Agent Events Grouped by Event Type — Displays events reported by Trellix Policy Auditor agent grouped by the event type.
PA: Table Space Usage — Displays the space used by each table in the Trellix ePO - On-prem database. Values are updated when the PA: Get Index and Space Statistics server task is run.
PA: Maintenance - Ending Index Fragmentation Compared to 30% — Display details on index fragmentation gathered after index maintenance. Values are updated when the PA: Maintain Database server task is run.
PA: Last Reported Index Fragmentation Level Compared to 30% — Displays the latest index fragmentation information gathered compared to 30%. Values are updated when the PA: Get Index and Space Statistics server task is run.
PA: Patch Supersedence
As new patches are released, some replace or supersede older patches, and some patches become obsolete. Trellix Policy Auditor now reports which patches are the latest that you must apply to your systems.
For this release, the patch supersedence reports work with audit result data generated when running benchmarks auditing for Microsoft Windows, Microsoft Office, and Adobe (for Microsoft Windows) patches.
Patch supersedence reporting occurs on the server with no impact to the Trellix Agent.
PA: Patch Supersedence dashboard
This dashboard is similar to the MS Patch Status Summary dashboard, but it excludes obsolete patches. The dashboard includes the following monitors:
PA: Critical Patch Status for non-superseded patches — Displays the critical patches that have not been superseded by other patches.
PA: Patch count by Vendor for non-superseded patches — Displays the patch count by vendor for non-superseded patches.
PA: Patch Status Grouped By Severity for non-superseded patches — Displays the status of non-superseded patches, grouped by the vendor assigned severity.
PA: Trend of Unpatched Critical Patches for non-superseded patches — Displays the trend of unpatched critical patches for non-superseded patches.
PA: Number of superseded patches — Displays the count of superseded patches by vendor.
PA: Number of superseded patches by platform and application — Displays the superseded patches by platform and application.
The PA: MS Patch Status Summary report is still accessible. The PA: MS Patch Status Summary displays all Microsoft patches, including superseded and obsolete patches.
Patch results are shown in the Audit Patch Results table, which is accessible using the Trellix ePO - On-prem Query Builder. This table includes three new columns:
Is Patch OVAL Check Superseded — A Boolean value which represents whether the patch is obsolete. If you want a report that contains only the most current patches, select this column as a filter.
Latest Superseding OVAL Check ID's — If this patch is obsolete, this column contains the latest OVAL patch check ID.
Superseding OVAL Check ID's — If this patch is obsolete, this column lists all OVAL patch check IDs that supersede this specific patch.
The Patch Supersedence Mapping table allows you to view the directory of OVAL patch checks and the mapping to other OVAL patch checks that supersede it. This table drives the PA: Number of superseded patches and PA: Number of superseded patches by platform and application queries.
PA: PCI Summary
The Payment Card Industry dashboard (PA: PCI Summary) provides a high-level overview of audit results with links and drill down access to detailed information.
PA: Compliance Summary dashboard
Some reports are grouped by PCI aggregation names. These are the PCI aggregation names:
Requirement 1: Install and maintain a firewall configuration.
PCI Failed Systems Grouped By Aggregation.
Requirement 3: Protect stored data.
Requirement 4: Encrypt transmission of data across public networks.
Requirement 5.1: Anti-virus software installed.
Requirement 5.1: Anti-virus software up-to-date.
Requirement 7: Restrict access to data.
Requirement 8: Assign a unique ID to each computer user.
Requirement 10: Track and monitor all access to network resources and data.
The monitors included in this dashboard are:
PA: PCI Req 1: Install & Maintain Firewall Config — Displays a pie chart grouped by scoring category.
PCI Req 2: Do Not Use Vendor Supplied Defaults — Displays a grouped bar chart of benchmark results, with each bar representing the number of benchmark results. The chart is categorized by first-level System Tree group where the system status is failed or unknown.
PCI Req 4: Encrypt Transmission of Data — Displays a pie chart, grouped by benchmark results and classified by status.
PCI Req 5: Use AV or App Whitelisting — Displays rules from audits that fail with a result of error.
PCI Req 6.4: Automate documentation in CMS — Displays a grouped bar chart with each bar representing the number of benchmark results. The benchmark results are categorized by benchmark group.
PCI Req 7: Restrict Access to Data — Displays a list of waivers currently in effect, grouped by first-level System Tree group and classified by type of waiver.
PCI Req 8: Unique ID for each computer user — Displays a list of waivers currently in effect, grouped by first-level System Tree group and classified by type of waiver.
PCI Req 10.3, 10.5, 11.5: File Integrity Monitoring — Displays a list of waivers currently in effect, grouped by first-level System Tree group and classified by type of waiver.
PCI Req 11.2 Run Vulnerability Scans — Displays a list of waivers currently in effect, grouped by first-level System Tree group and classified by type of waiver.
PA: Scans Summary
The PA: Scans Summary allows you to search for specific systems. It also displays a graphical representation of the number of systems scanned successful per week for a defined period.
PA: Scans Summary
The monitors included in this dashboard are:
Scanned System Summary – Displays a graphical representation of the number of systems scanned successful per week for a defined period.
Quick Find – Search for systems that consist of items that match your search keyword. The items considered for the search are based on the category you select from the Collected Item drop-down list. For example:
Select Applications from the Collected Items drop-down.
Search with the keyword
Java.The search result displays all systems that contain applications with the word Java in its file name, description, and properties.
PA: Systems Summary
The PA: Systems Summary dashboard provides a high-level overview of the total number of installed applications, running services, and ports for the systems on your network.
PA: Systems Summary
The monitors included in this dashboard are:
Applications per system – Displays a list of all systems and the total number of applications installed on them individually.
Services per system – Displays a list of all systems and the total number of running services on them individually.
Ports per system – Displays a list of all systems and the total number of open ports on them individually.
CPEs per system – Displays a list of all systems and the total number of CPEs on them individually.
PA: Top 10 Host Inventory
The Top 10 Host Inventory (PA: Top 10 Host Inventory) provides a high-level overview of inventory scan results through graphs and drill down access to detailed information.
PA: Top 10 Host Inventory dashboard
The monitors included in this dashboard are:
Top 10 Applications – Displays a graphical representation of the list of top 10 applications installed across all systems in your enterprise network.
Top 10 Browser Extensions – Displays a graphical representation of the top 10 browser extensions installed across all systems in your enterprise network.
Top 10 Discovered Services – Displays a graphical representation of the top 10 services running across all systems in your enterprise network.
Top 10 Package Manager Applications – Displays a graphical representation of the top 10 package manager applications installed across all linux-based systems in your enterprise network.
Top 10 Software Patches – Displays a graphical representation of the top 10 software patches installed across all systems in your enterprise network.
Top 10 Discovered Ports – Displays a graphical representation of the top 10 open ports across all systems in your enterprise network.
Run a query
After an audit completes, use the Trellix Policy Auditor queries to view the results.
Task
Select Menu | Reporting | Queries & Reports.
Expand Trellix Groups, then select from these query groups available for Trellix Policy Auditor:
Host Inventory
Policy Auditor
Policy Auditor Rollup
Find the query you want to run, then click Run.
Queries as dashboard monitors
Use any chart-based query as a dashboard that is refreshed at a user-configured frequency, so you can use your most useful queries on a live dashboard.
Caution
Using pie chart or bar chart could affect the performance of your Trellix ePO - On-prem. This is due to the large volume of data processed by the Policy Auditor queries. Instead we recommend that you create a custom query using Table based chart..
Trellix Policy Auditor default queries
The Queries & Reports page provides a set of queries that provide high-level reports on benchmarks, checks, rules, audit results, file integrity monitoring, findings, rollup reporting, waivers, applications, services, ports, and CPEs.
You can run these queries or use them as starting points to create custom queries. See the Trellix ePO - On-prem documentation for details about customizing and creating queries.
The results would return large data. We recommend you use the Trellix ePO - On-prem filters while creating the queries or while viewing the results.
You can export the report to CSV format by clicking Export to CSV.
From the Reports page, you can tag systems by clicking Tag Systems. The dialog displays all the tags that you have created. See the Trellix ePO - On-prem documentation for details about creating and using Tags.
Attention
You must create the tags on the Tag Catalog page for them to appear in the Reports page.
Important:
The query results might show duplicate entries. The could be due to a difference in the value of any of the other columns.
For example, when your run the Discovered Applications query, you might see the same application and version listed twice. This happens when the value in any of the other columns such as Install Date and Install Location are different.
Ensure that you select appropriate labels and values while creating custom queries for an accurate report.
Table 12-1 Trellix Policy Auditor custom query types
Query | Description |
|---|---|
Applications per System | Displays the count of applications on scanned systems. |
CPEs per Asset | Displays the count of applicable CPEs on scanned systems. |
Discovered Applications | Displays the applications discovered across the systems in your enterprise network. |
Discovered Applications (with System property filter) | Refines your search results using System property filters. This displays the applications discovered across the scanned system/group of systems in your enterprise network. |
Discovered CPEs | Displays the discovered applicable CPEs on scanned systems. |
Discovered CPEs (with System property filter) | Refines your search results using System property filters. This displays the applicable CPEs discovered across the scanned system/group of systems in your enterprise network. |
Discovered Network Interface | Displays all network-related information about scanned systems. |
Discovered Network Interface (with System property filter) | Refines your search results using System property filters. This displays the network-related information discovered across the scanned system/group of systems in your enterprise network. |
Discovered Ports | Displays the ports discovered across the systems in your enterprise network. |
Discovered Ports (with System property filter) | Refines your search results using System property filters. This displays the ports discovered across the scanned system/group of systems in your enterprise network. |
Discovered Registered Extension | Displays the discovered file formats on the scanned systems. |
Discovered Registered Extension (with System property filter) | Refines your search results using System property filters. This displays the file formats discovered across the scanned system/group of systems in your enterprise network. |
Discovered Services | Displays the services discovered across the systems in your enterprise network. |
Discovered Services (with System property filter) | Refines your search results using System property filters. This displays the services discovered across the scanned system/group of systems in your enterprise network. |
Discovered System Information | Displays the discovered system information of the scanned systems. |
Ports per Asset | Displays the count of ports on scanned systems. |
Removed Applications | Displays the list of removed applications on the scanned system. |
| |
Scan Summary | Displays the list of systems scanned in a set period across the enterprise. |
Scan Summary (with System property filter) | Refines your search results using System property filters. This displays list of systems scanned in a set period discovered across the scanned system/group of systems in your enterprise network. |
Services per Asset | Displays the count of services on scanned systems. |
System Information (with System property filter) | Refines your search results using System property filters. This displays the discovered BIOS, serial number and other system information discovered across the scanned system/group of systems in your enterprise network. |
Top 'n' Discovered Applications | Displays the most installed applications discovered across the systems in your enterprise network. You can define value of n in your query. |
Top 'n' Discovered Services | Displays the most run services discovered across the systems in your enterprise network. You can define value of n in your query. |
Top 'n' Discovered Ports | Displays the most opened ports discovered across the systems in your enterprise network. You can define value of n in your query. |
Table 12-2 Findings default queries
Query | Description |
|---|---|
FND: Chart of Current Finding Status Types | Pie chart of the current Finding Status types. |
FND: Chart of Finding Status Grouped By Finding Identifier | Displays a grouped summary of the Finding Status grouped by the Finding Identifier. |
FND: Count of Violations Grouped By Message | Displays the count of violations grouped by the message. |
FND: Finding Status Grouped By Finding Identifier | Displays a grouped summary of the Finding Status that is grouped by the Finding Identifier. |
FND: Findings By Status and Message | Displays the current Findings grouped by their status and the Finding message. |
FND: Grouped Summary of Finding Status for Systems | Displays a grouped summary of a system showing the counts of Finding Status. |
Table 12-3 Host Inventory default queries
Query | Description |
|---|---|
Discovered Browser Extensions | Displays a list of installed Browser extensions. The list also displays the number of browsers discovered with the extensions. |
Discovered CPEs | Displays the number of CPEs detected on the systems. |
Discovered Network Interfaces | Displays the list of network interfaces and their details. |
Discovered Package Manager Applications | Displays the managed Linux systems and the total number of installed applications on these systems. |
Discovered Ports | Displays the list of ports used by various processes and their details. |
Discovered Registered Extensions | Displays the list of all file formats and their associated executables on these systems. |
Discovered Services | Displays the list of services and their details. |
Discovered Software Patches | Displays the list of installed software patches and the number of systems that have them. |
Discovered Applications | Displays the list of installed applications, App store applications, and Windows features. |
Discovered Applications Version(s) | Displays the list of installed applications and their versions. |
Removed Applications | Displays the managed systems and the list of removed applications on these systems. |
Scanned System Summary | Displays a graph on the number of successful inventory scans. |
System Information | Displays a list of system information, such as BIOS details, FQDN, and System manufacture. |
12 | Using dashboards and queries
Table 12-3 Host Inventory default queries (continued)
Query | Description |
|---|---|
Top 10 Browser Extensions | Displays a bar chart with the list of top 10 browser extensions across all systems in your enterprise network. |
Top 10 Discovered Ports | Displays a list of top 10 open ports across all systems in your enterprise network. |
Top 10 Discovered Services | Displays a bar chart with the list of top 10 services running across all systems in your enterprise network. |
Top 10 Package Manager Applications | Displays a bar chart with the list of top 10 installed applications across all Linux systems in your enterprise network. |
Top 10 Software Patches | Displays a bar chart with the list of top 10 software patches across all systems in your enterprise network. |
Top 10 Windows Applications | Displays a graphical representation of the list of top 10 applications installed across all systems in your enterprise network. |
Table 12-4 Trellix Policy Auditor default queries
Query | Description |
|---|---|
PA: Agent Events | Displays a list of threat events received from the Trellix Policy Auditor Agent. |
PA: Agent Events Grouped by Event Type | Displays a list of events reported by Trellix Policy Auditor Agent grouped by the event type. |
PA: Benchmark Checks | Displays a bar chart count of checks included in all activated benchmarks, grouped by benchmark. |
PA: Benchmark Results - Pass/Fail/Unknown | Pie chart of benchmark results categorized as pass/fail/unknown. |
PA: Benchmark Rules | Displays a count of rules included in all activated benchmarks, grouped by benchmark. |
PA: Check Catalog List | List of OVAL checks in the check catalog. |
PA: Check Catalog Usage List | List of OVAL checks used in benchmarks, including the rule and benchmark associations. |
PA: Check Result Findings | Pie chart of findings for current check results. |
PA: Checks Across Benchmarks | Displays a list of checks with a count of their usage in activated benchmarks. |
PA: Critical Patch Status for non-superseded patches | Displays a pie chart of critical patches that are not superseded by other patches. |
PA: Group Results By Benchmark Group | Bar chart of results for groups in the benchmark. Counts are rolled up from child group to parent group. |
PA: Group Rule Results By Benchmark Group | Displays rule results grouped by the benchmark group. |
PA: Group Rule Results By Rule Result | Displays rule results for a benchmark group. The report is grouped on the rule result. |
PA: Index Statistic List | Displays a list of information about the indexes in the Trellix ePO - On-prem database. Values are updated when the PA: Get Index and Space Statistics server task is run. |
PA: Maintenance - Beginning Index Fragmentation Compared to 30% | Displays details about index fragmentation gathered during index maintenance. Values are updated when the PA: Maintain Database server task is run. |
12 | Using dashboards and queries
Table 12-4 Trellix Policy Auditor default queries (continued)
Query | Description |
|---|---|
PA: Maintenance - Index Detail | Displays information related to database index maintenance. Values are updated when the PA: Maintain Database server task is run. |
PA: MS Critical Patch Status | Displays the status of critical Microsoft patches. |
PA: MS SLA Non-Compliant Systems Grouped By Patch and Tag | Displays the noncompliant systems grouped by patch and tag. |
PA: MS SLA Non-Compliant Systems Grouped By Tag and Patch | Displays the noncompliant systems grouped by the tag and patch. |
PA: Number of superseded patches | Displays the count of superseded patches by vendor. |
PA: Number of superseded patches by platform and application | Displays the superseded patches by platform and application. |
PA: Patch count by Vendor for non-superseded patches | Displays the patch count by vendor for non-superseded patches. |
PA: Patch Status Grouped by Severity for non-superseded patches | Displays the trend of unpatched critical patches for non-superseded patches. |
PA: Systems by Audit | Displays the systems assigned to an audit. |
PA: Trend - Rollup of Systems Reporting Failed Benchmarks Status | Displays the trend of failed benchmark audits over time, grouped by rollup server. |
PA: Trend Of Benchmarks Reporting As Failed | Displays the trend of benchmarks that failed during the audit process. |
PA: Trend Of Checks Reporting As False | Displays the trend of checks that reported as false during the audit process. |
PA: Trend Of File Integrity Events | Displays the trend of File Integrity Events received from managed systems. |
PA: Trend Of Rules Reporting As Failed | Displays the trend of rules that failed during the audit process. |
PA: Trend of Unpatched Critical MS Patches | Displays the trend of the systems reporting unpatched critical Microsoft patches. |
PA: Trend of Unpatched Critical Patches for non-superseded patches | Displays the trend of unpatched critical patches for non-superseded patches. |
PA: Unprocessed Audit Results | Displays unprocessed audit results. |
PA: Unprocessed Audit Results by Audit | Displays unprocessed audit results, grouped by audit. |
PA: Unprocessed Audit Results By System | Pie chart of unprocessed audit results grouped by system. |
PA: Unprocessed FIM Results by System | Displays the unprocessed FIM results, grouped by system. |
PA: Unprocessed Finding Results | List of unprocessed Finding results. |
PA: Unprocessed Finding Results By Audit | Displays the unprocessed finding results, grouped by system. |
PA: Unprocessed Finding Results By System | Pie chart unprocessed Finding results grouped by system. |
Trellix Policy Auditor agent debug tool
The Trellix Policy Auditor agent debug tool allows you to run audits, benchmarks, and checks on system and save the results, including debug information and the log file, to a .zip file.
The debug tool has an interactive console interface for all non-windows systems and a graphical interface for Windows systems.
Run checks on non-Windows systems
Run a check on a non-Windows system from the terminal.
Open the terminal on your non-Windows system.
Navigate to the folder containing the agent plug-in.
Type
enginemain -nand press Enter.Run on of the following commands:
Interface | Definition |
|---|---|
Audits | Run an audit on a system based on the available benchmarks. 1 Enter 2 Enter 3 Enter |
Benchmarks | Run a benchmark for a system. 1 Enter 2 Enter 3 Enter |
Checks | Run OVAL checks on a system. 1 Enter 2 Enter 3 Enter |
File integrity | Run file integrity checks on a system. 1 Navigate to 2 Enter |
5 Enter exit, to close the console.
Run a check on a Windows system
Run a check on a Windows system using the Debug Tool.
Navigate to your Trellix Policy Auditor installation folder.
By default, Policy Auditor is installed to
C:\Program Files (x86)\McAfee\Policy Auditor Agent.Run DebugConsole.exe, do any of the following
Interface | Definition |
|---|---|
Audits | Run an audit on a system based on the available benchmarks.
Note: The Version and Content Version provides the respective details |
Benchmarks | Run a benchmark for a system.
Note: The Content Version would provide the respective details |
Checks | Run OVAL checks on a system.
|
File Integrity | Run file integrity checks on a system.
|
Blackout times | Click Blackout times to view the blackout times of the week. The page also displays the day and time of the blackout. |
Click Close to close the Debug tool.
Save debug information
You can save debug information, including the log file and database, to a .zip file on the system.
Execute the agent plug-in debug tool and perform an action, such as run an audit.
Save the debug information to a file.
Interface | Definition |
|---|---|
Graphical | 1 Click Save Debug info. 2 Type a file name and location to save the .zip file, then click OK. |
Interactive | Enter |
Enable debug logging
Enable debug logging with the required detail, number of logs, and their maximum size.
Open the Trellix Policy Auditor agent plug-in debug tool console.
Go to the%PA installation directory%\Policy Auditor Agent\directory, then double-click DebugConsole.exe.Click Enable Debug Logging, then set these options as required.
Option | Definition |
|---|---|
Max Backup Index | Provide the number of previous logs to include. |
Log Details | Select the level of detail that you want to include in logs.
|
Max File Size | Specify the maximum file size for the logs. |
(Optional) Click the Save Debug Info to generate logs.
Display help
You can obtain online help on running the tool from the command prompt or command-line interface.
Task
Open a command prompt on a Windows system or a command-line interpreter on a non-Windows system.
Navigate to the folder containing the agent plug-in. On Windows systems, this is usually
c:\Program Files (x86)\McAfee\Policy Auditor Agent.Execute the tool, then type the appropriate command to display help.
Command | Description |
|---|---|
| Displays help for the graphical version of the tool on Windows systems. |
| Displays help for the interactive console version of the tool on all supported systems. |
Implementing the Security Content Automation Protocol
Security Content Automation Protocol (SCAP) is a collection of open standards to identify vulnerable software and configuration issues. These security standards are developed jointly by United States government organizations and the private sector. Trellix Policy Auditor uses SCAP to perform automated audits, including policy compliance evaluations such as the Federal Information Security Management Act (FISMA).
Trellix Policy Auditor uses SCAP version 1.3. Security content conforming to the SCAP standard can be used by any product supporting the standard and the results can be shared between these products.
Trellix Policy Auditor also supports importing data streams and data streams with tailoring. A data stream is a collection of component files.
Note
Imported tailored SCAP 1.3 benchmarks are read-only. You can't edit these benchmarks. Importing SCAP 1.3 benchmarks that are not tailored allows you to edit, tailor, or duplicate a benchmark.
Statement of FDCC compliance
Trellix asserts that Trellix Policy Auditor does not alter or conflict with the Federal Desktop Core Configuration (FDCC) settings on Microsoft Windows XP and Vista systems.
These ports are used by Trellix Policy Auditor.
Setting | Port | Can be edited |
|---|---|---|
Agent-server communication | 80 | No |
Agent wake-up communication | 8081 | Yes |
Agent broadcast communication | 8082 | Yes |
Console-application server communication | 8443 | Only during installation |
Sensor-server communication | 8444 | Only during installation |
Security threats communication | 8801 | Only during installation |
SQL server TCP | 1443 | Only during installation |
Statement of SCAP implementation
The Security Content Automation Protocol (SCAP) is a collection of six open standards developed jointly by United States government organizations and the private sector. Security content conforming to the SCAP standard can be used by any product that supports the standard and the results can be shared among these products.
Trellix Policy Auditor allows users to import and export benchmarks and checks that use SCAP. Users can tailor or edit benchmarks within the Trellix Benchmark Editor interface and activate them for use in audits. Benchmarks determine whether a system complies with the benchmark rules. Benchmarks also return results that can be converted to a human-readable format.
Benchmarks and checks incorporate the following reference protocols to make sure that all rules are processed accurately and appropriately, and that the results appear properly in reports and export files.
Common Vulnerabilities and Exposures (CVE)
Common Configuration Enumeration (CCE)
Common Platform Enumeration (CPE)
Common Vulnerability Scoring System (CVSS)
eXtensible Configuration Checklist Description Format (XCCDF)
Open Vulnerability and Assessment Language (OVAL)
Trellix Policy Auditor is compliant with SCAP 1.3 and detects and assesses thousands of systems from a Trellix Policy Auditor server. This standardization allows regulatory authorities and security administrators to construct definitive security guidance and to compare results reliably and repeatedly.
Trellix Policy Auditor is designed exclusively around SCAP and manages all aspects of analyzing systems for compliance. It uses XCCDF and OVAL to determine which items to check and how to check them. It uses the CPE, CCE, CVSS, and CVE reference protocols to make sure that all rules are accurately and appropriately evaluated during system audits. The SCAP standard references are visible in the interface, reports, and export files.
Statement of CVE implementation
Trellix Policy Auditor fully implements and supports the Common Vulnerabilities and Exposures (CVE) standard vulnerability dictionary. CVE provides unique, standardized identifiers for security vulnerabilities. CVE address vulnerability and exposure issues, not compliance items.
Trellix Policy Auditor implements and supports CVE enumeration, which provides standardized references to known vulnerabilities. CVE uses a named list of information security weaknesses, providing standardized identifiers to facilitate a universal naming convention.
Each CVE identifier consists of:
A CVE identifier number, such as CVE-2008-0042
An indication of whether the CVE has a status of "entry" or "candidate"
A description of the vulnerability
A list of any references, such as advisories or OVAL identification
Trellix Policy Auditor patch and vulnerability definitions are updated periodically when new content is available. The audit results can be viewed from the Audits, Reports, or Dashboard user interface.
CVE information is accessible from the Checks interface, which displays details of Common Vulnerabilities. Users can view even more detailed CVE information from the Check Details page, which displays the Source, ID, and URL.
For example, the URL http://cve.mitre.org/cgi-bin/cvename.cgi?name=CVE-2005-2122 refers the user to the Mitre site to view details about CVE-2005-2122. The security content provided by Trellix refers to CVE identifiers when addressing vulnerabilities and whether a vendor's patch has been applied to address the vulnerability.
Previous versions of Trellix Policy Auditor have been certified by Mitre as CVE-compatible.
Statement of CCE implementation
CCE provides a standard system for identifying and referencing system configuration settings. CCE identifies the configuration itself, not the way the configuration was reached. CCE encourages interoperability, improves the correlation of test results, and simplifies gathering metrics.
Trellix Policy Auditor includes CCE references in the checks content. The Checks tab lists all the checks available to users. Clicking on a check with CCE content lists CCE references that identify the CCE system configuration settings.
Trellix Policy Auditor incorporates and supports version 5.0 of the Common Configuration Enumeration (CCE) standard. Previous versions of Trellix Policy Auditor have been certified by Mitre as CCE-compatible.
Statement of CPE implementation
Trellix Policy Auditor implements version 2.3 of the Common Platform Enumeration (CPE) standard. CPE provides a standard reference and notation method for information technology systems, platforms, and packages.
Trellix Policy Auditor contains the CPE data dictionary in the database, with some of it in aggregated format to promote ease of use. Information from this dictionary drives aspects of the Trellix Policy Auditor interface. Trellix Policy Auditor associates OVAL definitions with CPE names and allows users to specify CPE names at the benchmark, group, profile, or rule level. Trellix Policy Auditor users can create audits with SCAP content that cover a number of common operating systems and platforms.
When CPE platforms are specified, Trellix Policy Auditor uses this information to determine whether it should evaluate compliance with a rule or group of rules. For example, an audit can cover Windows XP and Windows Vista operating systems, but not the Windows 2000 operating system. CPE allows Trellix Policy Auditor to use the correct content on the correct systems.
Previous versions of Trellix Policy Auditor have been certified by Mitre as CPE-compatible.
Statement of CVSS implementation
Trellix Policy Auditor incorporates version 3.0 of the Common Vulnerability Scoring System (CVSS). CVSS is a standardized open framework for measuring the effect of vulnerabilities.
Each CVE includes an associated CVSS vector to determine the relative severity of vulnerabilities. CVSS is built on a quantitative model that ensures repeatable measurements on systems, valid comparisons between systems, and that allows users to view the underlying vulnerability characteristics. Using CVSS scores helps an organization to determine and prioritize responses to detected vulnerabilities.
Trellix Policy Auditor supports all four standard SCAP scoring models:
Flat
Unweighted
Absolute
Default
The default setting for Trellix Policy Auditor is a flat unweighted scoring model normalized to a maximum possible score of 100. The scoring model can be changed for comparison purposes.
Previous versions of Trellix Policy Auditor have been certified by Mitre as CVSS-compatible.
Statement of XCCDF implementation
The eXtensible Configuration Checklist Description Format (XCCDF) is an XML specification language that supports the exchange of information, generation of results, tailoring, automated compliance testing, and compliance scoring. It also provides a data model and format for storing results of benchmark compliance testing.
XCCDF provides a uniform standard for the expression of benchmarks and other configuration guidance to encourage good security practices. Trellix Policy Auditor uses benchmarks from Trellix or third-party sources to construct audits. Users can select the benchmark profile, if any, to use for the audit. After a system is audited, the audit results are returned to Trellix Policy Auditor, which analyzes and reports on the configuration and vulnerability data.
The users can specify how long audit data is retained so that they or auditors can review changes in the state of a system over time.
Trellix Policy Auditor implements version 1.2 of XCCDF. Previous versions of Trellix Policy Auditor have been certified by Mitre as XCCDF-compatible.
Statement of OVAL implementation
The Open Vulnerability and Assessment Language (OVAL) describes the ideal configuration of systems, compares systems to the ideal configuration, and reports the test results. It provides a structured model for network and system administrators to detect vulnerabilities and configuration issues on systems.
Trellix Benchmark Editor uses the Checks interface to import and export OVAL definitions and other formats supported by XCCDF. These checks can be filtered based on OVAL IDs, platforms, or any criteria set by the user. The Check Details interface display a hyperlink to specific OVAL IDs, which displays OVAL in XML format.
When a system is audited, the OVAL content is processed according to the information in the XCCDF benchmarks contained in the audit. The OVAL content captures the state of the system at the particular time that the audit is run. The results are returned to Trellix Policy Auditor for analysis and reporting. The users specifies how long to retain audit data so that they or auditors can review changes in the state of a system over time.
Trellix Policy Auditor provides fully integrated support for OVAL 5.11.2. Previous versions of Trellix Policy Auditor have been certified by Mitre as OVAL-compatible.