Use the Custom Reports section to define settings in a new custom report for managed appliances using the Central Management System appliance Web UI.
Note
You can define settings in a custom report only using the Web UI.
Access to the Web UI of the Central Management System appliance as Admin, Analyst, or Monitor
In the Web UI, choose Reports > Custom Reports.
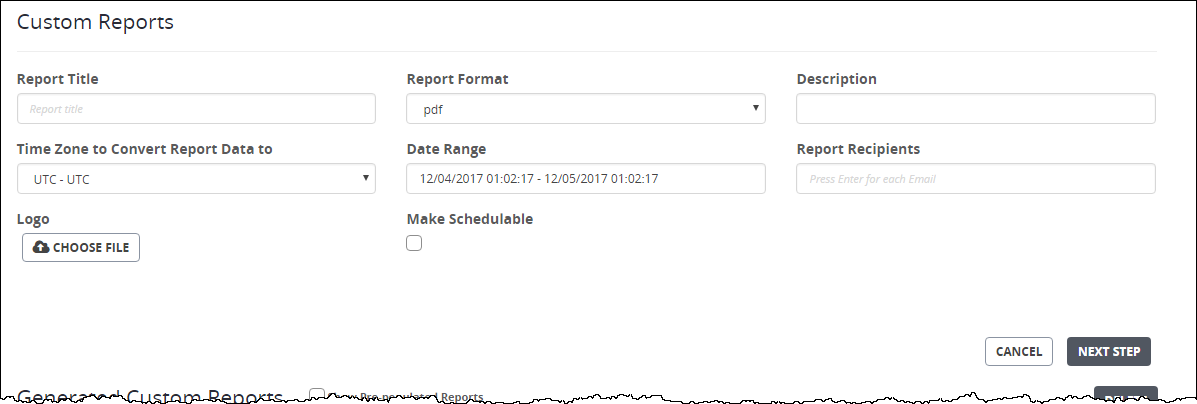
In the Report Title field, enter a name for your custom report.
In the Report Format drop-down menu, select the output format for the custom report:
xml—Generate the report in XML format.
pdf—Generate the report in PDF format.
csv—Generate the report in CSV format.
json—Generate the report in JSON format.
(Optional) In the Description field, enter a description of your custom report. You can specify any number of characters.
In the Time Zone to Convert Report Data to drop-down menu, select the time zone for the custom report.
In the Date Range drop-down menu, select the time period for this custom report:
past hour—Report covers analysis generated during the past 1 hour.
past 7 hours—Report covers analysis generated during the past 7 hours.
past 12 hours—Report covers analysis generated during the past 12 hours.
past 7 days—Report covers analysis generated during the past 7 days.
past 30 days—Report covers analysis during the past 30 days.
custom—Report covers analysis generated for a custom time period that ranges from the last 15 minutes to the past 1 year.
Click Apply.
In the Report Recipients field, enter the email address of the report recipient. To add multiple recipients, press Enter for each additional email address.
To delete a recipient, click X next to the email address you want to delete.
(Optional) If you want to schedule the generated custom report in the Reports > Schedule Reports page, select the Make Schedulable checkbox. The custom report that has been generated appears under "Custom Reports" in the Report Type drop-down menu.
For details about how to schedule a generated custom report, see Scheduling reports for managed appliances using the Web UI .
Click Next Step to add a table or graph, or click Save if you are finished configuring the custom report.
To add a table to a section of a custom report, see Adding tables to a custom report using the Web UI .
To add a graph to a section of a custom report, see Adding graphs to a custom report using the Web UI .