The histogram transform displays a bar chart or pie chart of results.
Note
A query cannot contain both groupby and histogram transforms.
Note
The histogram transform works only for custom dashboards.
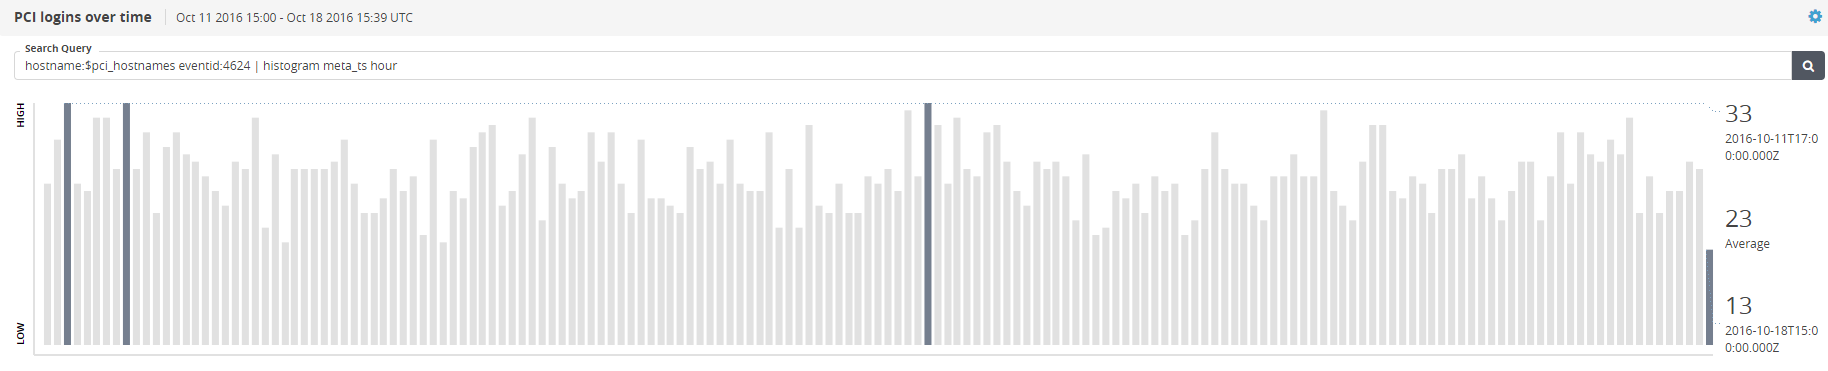
Histogram syntax
mql query | histogram <field> <period>
| The field determines what data is plotted. |
| The time period for the bar chart to cover. Valid values are |
Note
TQL was previously called MQL. You still use and see
mqlin TQL queries.
Examples
Query | Result |
|---|---|
| Display results for |
| Display results for |
| Display results for |
| Display results for |