Integrating Network Detection and Response NDR with SIEM provides real-time visibility of all activities on your systems, networks, databases, and applications.
Log into the NDR CLI using a terminal window or SSH client:
Using the NDR SSH protocol, log into the appliance with management interface's IP address or hostname.
$ ssh npadmin@<NDR IP address>Enter the password when prompted. The
hostname > promptis displayed after you have logged in.
Enter privileged mode on the NDR CLI.
npadmin@hostname> enableEnter the
npadminpassword, when prompted. The password can be 5 to 24 characters long.[sudo] password for npadmin: <password>Enter configuration mode.
npadmin@hostname# configure systemThe prompt changes to
npadmin@hostname(config)#on the terminal indicating that configuration mode is enabled.Type
SIEMat the terminal and pressEnter.In the SIEM Configuration page, type
1and then pressEnterto configure consumers.Type
1and pressEnterto configure Splunk. The Configure Splunk options are displayed.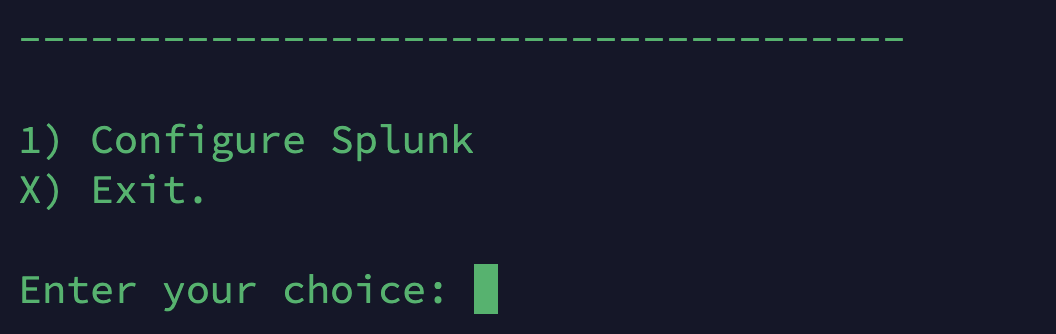
Type
Aand pressEnterto add a Spunk server.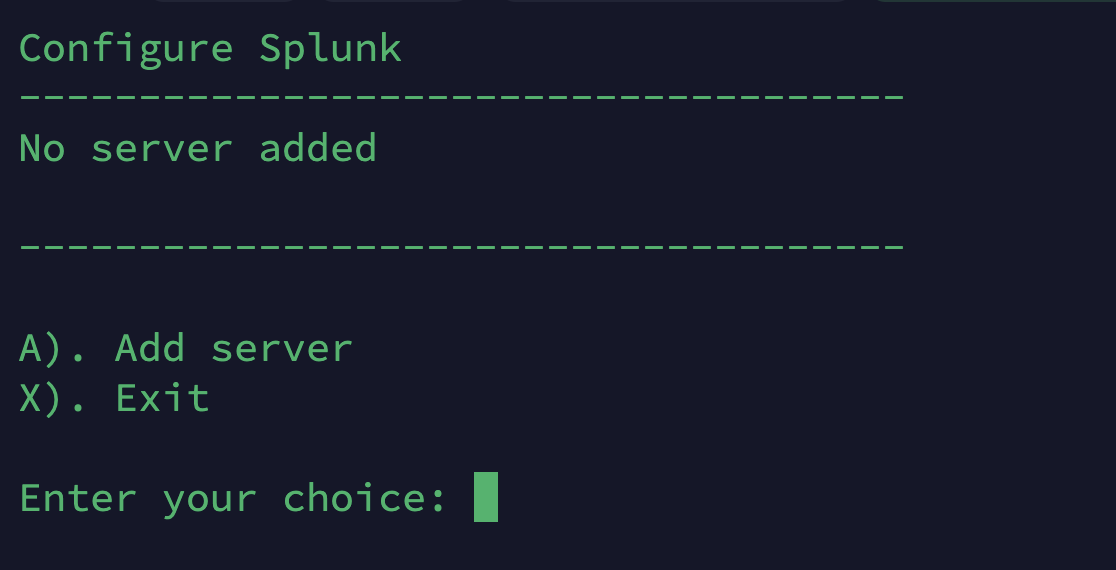
Type
1and pressEnter. Provide a name for the server.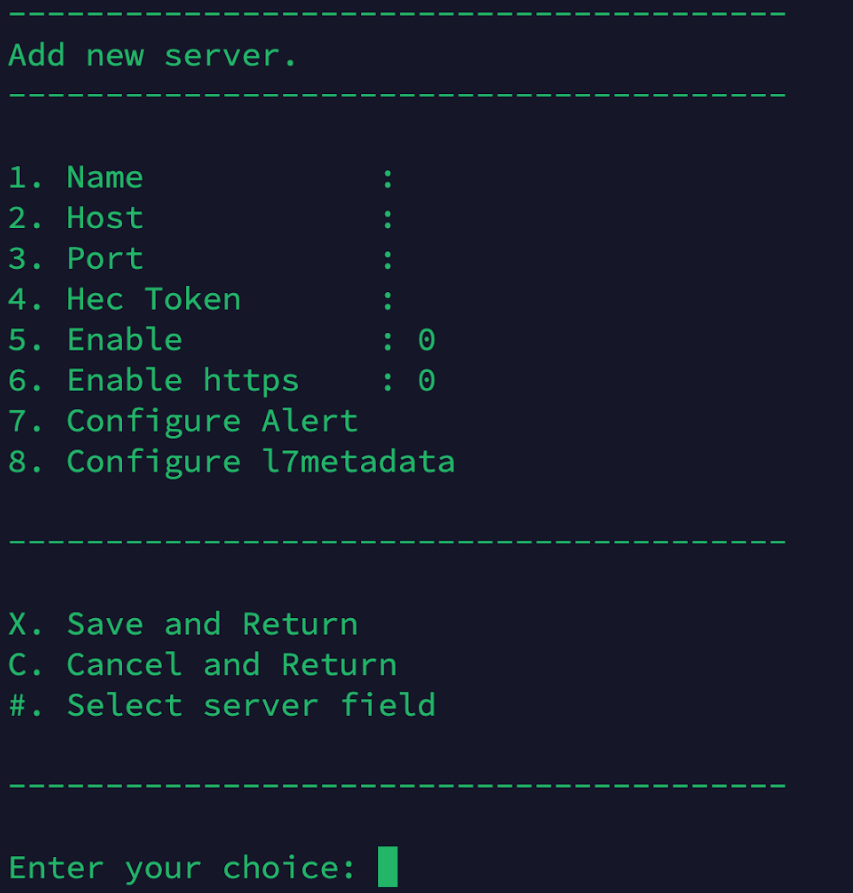
Type
2and pressEnterto specify IP address (IP address of Splunk server).Type
3and pressEnter. Specify the port on which Splunk is listening for HTTP Event Collector (HEC) logs.Type
4and pressEnter. Specify Hec token. This is the HTTP Event Collector token in Splunk, which you will need to generate within the Splunk interface. The token is used to authenticate the Network Detection and Response system when sending logs.Type
5and pressEnterto export from NDRC to Splunk.Type
6and pressEnterto enable the export of events or alerts over https to Splunk.Type
7and pressEnterto configure alerts.Type
8and pressEnterto configure L7 metadata.Type
Xand pressEnterto save the settings and return to the previous page.Type
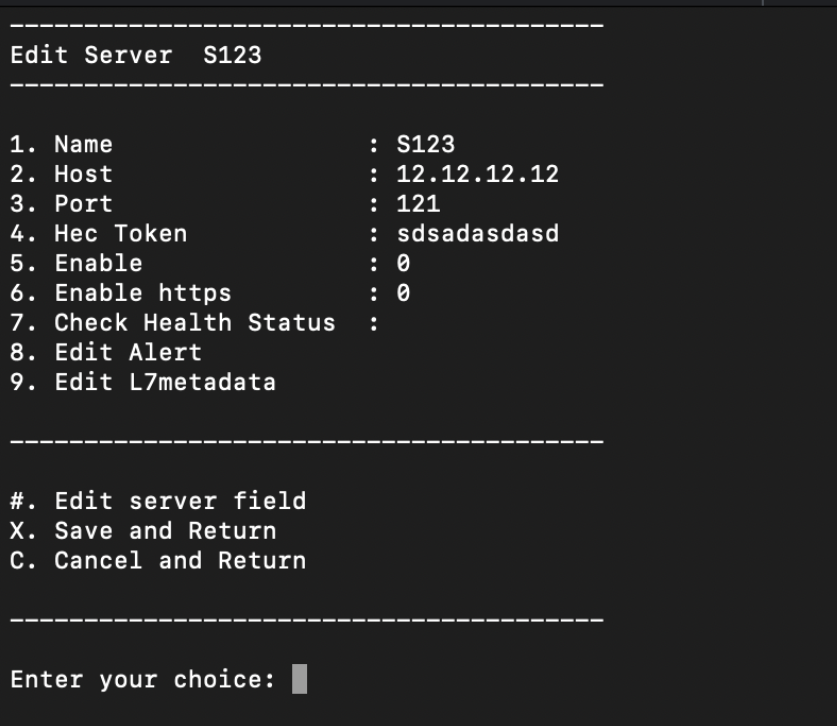
Cand pressEnterif you want to cancel the settings and return to the previous page.From configure Splunk menu, type the required number beside the configured Splunk server and press
Enterto edit the server details.Note
The connection status of the Splunk server (whether the server is up or down) can be verified using the Check Health Status feature option available in the Edit Server page.
Type
Xand pressEnterto save the settings and return to the Configure Spunk page.Type
Xand pressEnterto save the settings and return to the Configure SIEMs to export metadata and alert page.Note
Alerts generated or stored in the NDR Console are forwarded to Splunk only when the following conditions are satisfied:
Alert forwarding is enabled in the Splunk configuration.
The alert severity meets or exceeds the configured severity threshold. Only alerts whose severity is equal to or higher than the configured threshold are forwarded.
To configure other parameters, type
2and pressEnter.Type
1and pressEnterto specify the batch size.Type
2and pressEnterto specify the export interval. This is the time elapsed since the previous export surpasses the defined export interval.Important
NDR allows you to set both a batch size and an export interval. Data is exported to Splunk if either of the following conditions are met:
The amount of specific data received by NDR that needs to be exported exceeds the configured batch size.
The time elapsed since the previous export is greater than the defined export interval.
Type
Xand pressEnterto save the settings and exit.Type
Cand pressEnterto cancel the settings and return to the previous page.
Type
Xand pressEnterto exit the configure SIEM page.
Note
If HTTPS is enabled, you must upload certificates (generated on Splunk server) in NDR using following APIs:
curl -k -u npadmin:Fireeye@123 https://NDRC_IP/config/v1/siem/Splunk/cert/<configuration name> -XPOST -F "cert=@ca.pem
curl -k -u npadmin:Fireeye@123 https://NDRC_IP/config/v1/siem/Splunk/cert/<configuration name> -XPOST F "cert=@client cert.pemwhere <configuration name> is the name of an integration or confguration that is given in step 7b.
Alert severity threshold behavior
Configured Severity | Alerts forwarded |
|---|---|
Low | Low, Medium, High, Critical |
Medium | Medium, High, Critical |
High | High, Critical |
Critical | Critical only |