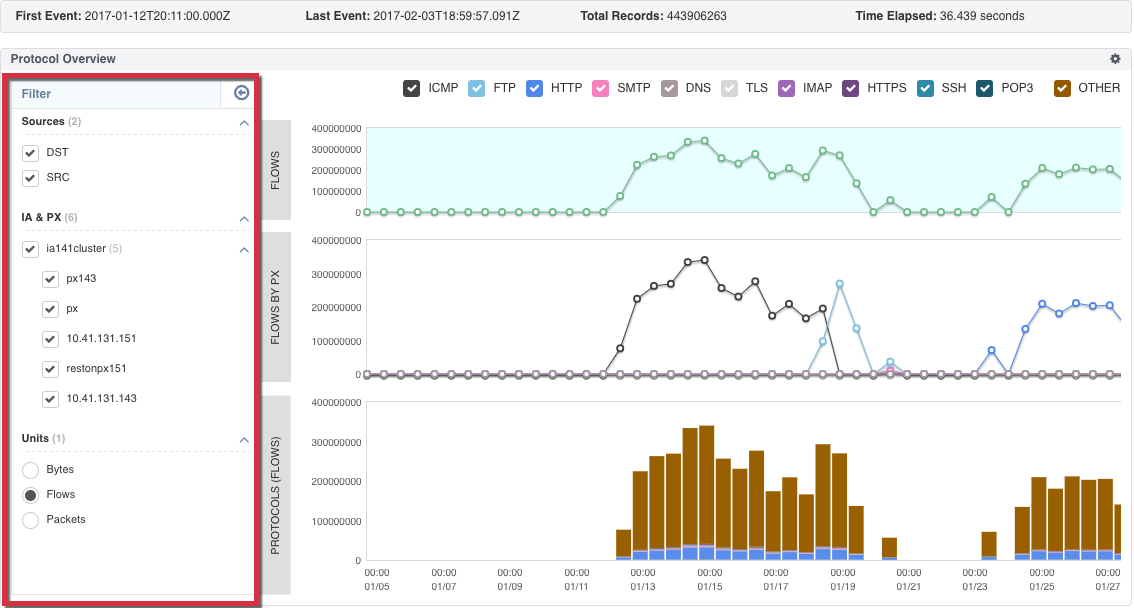
The Protocol Summary chart provides a byte, packet, or flow summary of all network traffic captured by all of your NDR and PX appliances. The chart displays data results by three metrics: Flows, Flows by PX, and Protocols (Flow). The top of the chart provides a count of the total records with a specific time frame, the timestamps for the first and last recorded event, and the elapsed time in seconds between the first and last recorded event.
The Flow section provides an aggregated line graph of all network traffic flows by all of your NDR and PX appliances within a specific time frame. The Flows by PX section provides a line graph of the total flows for your PX appliances. The Protocols (Flows) section displays a bar graph of the total flows, bytes, or packets for all captured network traffic flow within a specific time frame. Color-coded protocol types summarize the data.
The Filter tab within the chart allows you to refine your flow statistic summary by destination and source, connected NDR and PX appliances, protocol type, and statistical unit (bytes, flows, and packets). You can also use the protocol filter checkbox to refine the packet flow data displayed in the Protocol Summary chart.
From the selected dashboard, click the Add Component button and select Protocol Summary.
Name the Protocol Summary chart.
Click Add Component to save the Protocol Summary chart to your dashboard.
Click the arrow on the Protocol Summary Filter tab and select the filters you want to apply to your search.
Click the search icon in the Query Bar to run your query and display the results.