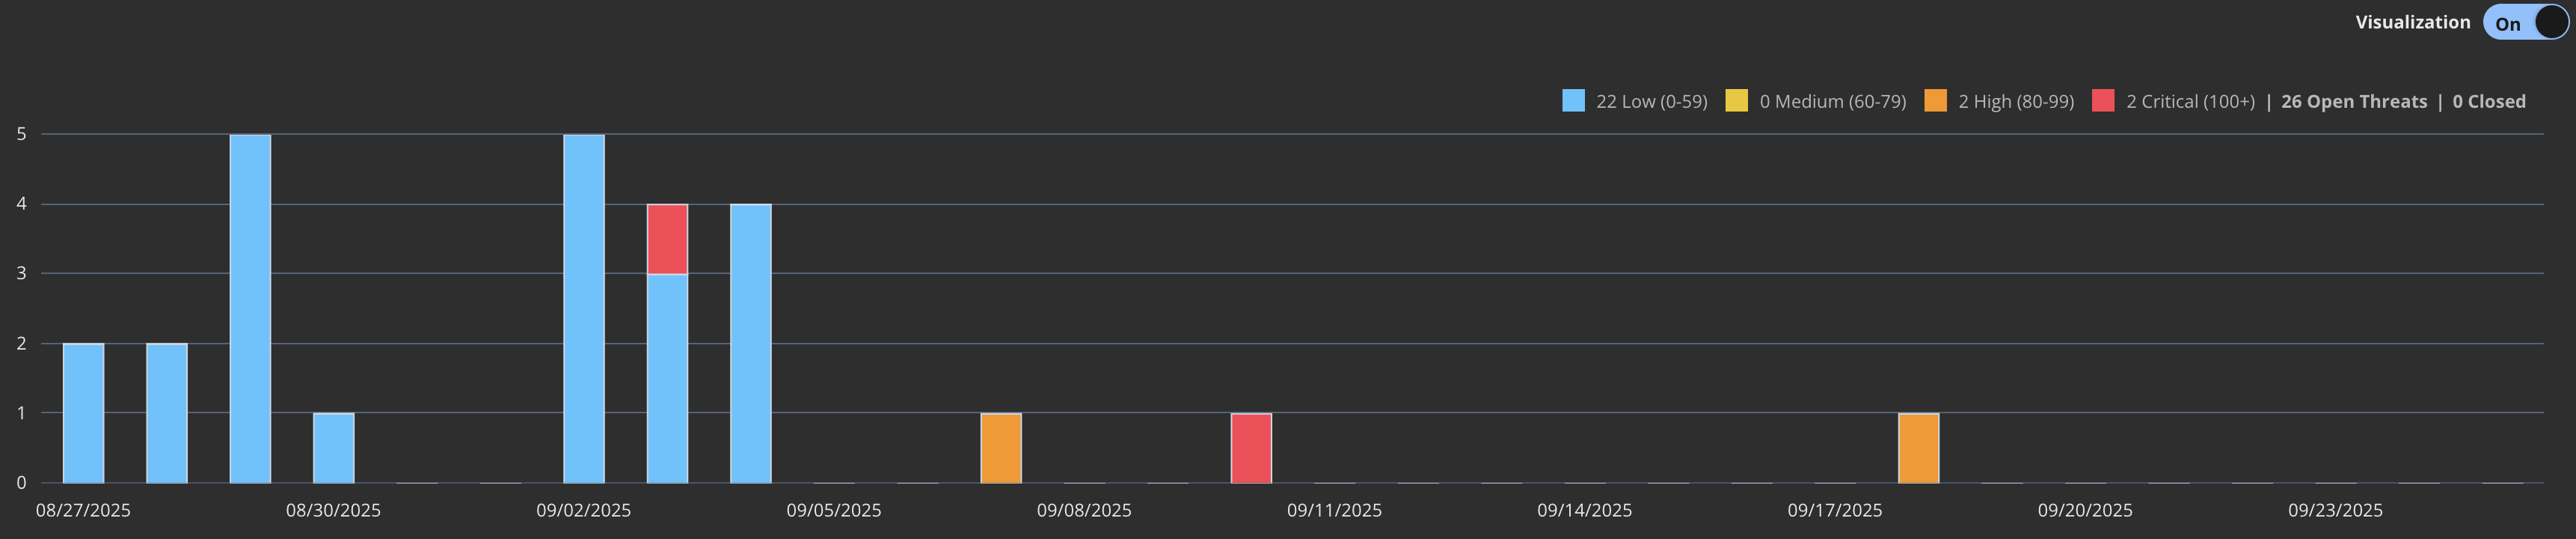
The top of the Threats page contains a chart with summary threat statistics over the last 30 days. The chart uses colors to denote the threat severity.