The Network Security appliance continuously gathers and reports relevant data about its utilization. There are recommended levels of utilization, known as rated limits, that are specific to each appliance model. Exceeding these limits can cause reduced malware detection efficacy, packet loss, and queuing errors.
You can use the utilization data as a tool for future capacity planning. When your appliance continuously or critically exceeds the rated limits, prominent messages and event notifications advise you to contact Trellix for guidance.
Utilization data and the associated rated limits are reported in the Appliance Utilization section on the Dashboard in the Web UI and in the show sizing stats CLI command output. On the Dashboard, you can view statistics for the current day, past week, or past month.
The Appliance Utilization section of the Network Security Dashboard includes a verdict that states the utilization zone your appliance is operating in (based on the most recent one-hour average) and recommended actions to take.
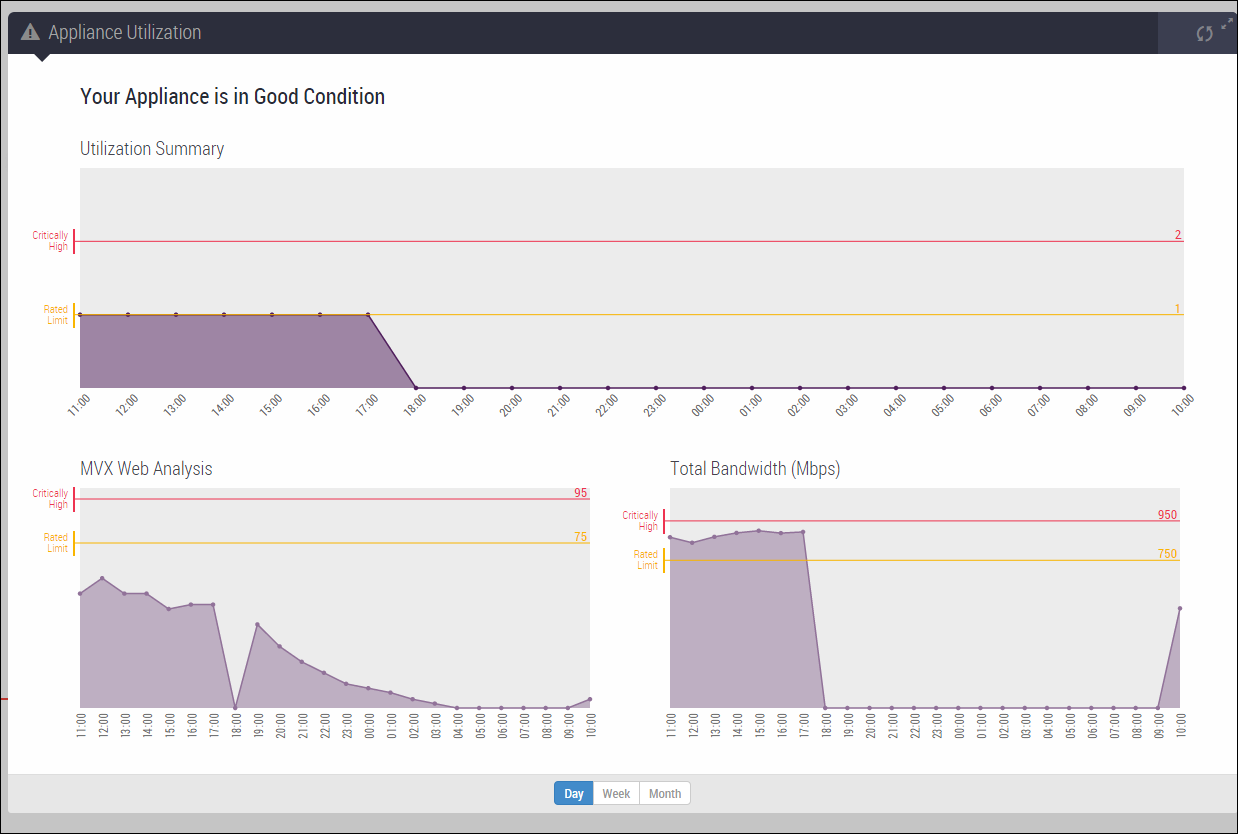
The Dashboard section also includes the following charts:
Utilization Summary shows the overall appliance utilization level.
MVX Web Analysis shows the Web pages waiting to be analyzed by the Network Security MVX engine, displayed as a percentage of capacity.
Total Bandwidth (Mbps) shows the total amount of traffic going through the monitoring ports, measured in Mbps. The thresholds are based on the rated bandwidth for the appliance.
In the following example, the appliance is operating in the good zone. Although it exceeded the rated limit for total bandwidth during the reporting period, it was back in the good range at the time the chart was rendered.
Monitor, Operator, or Admin access
Viewing utilization statistics using the Web UI
Use the Appliance Utilization section of the Network Security Dashboard to view utilization statistics for the current day, past week, or past month.
Click the Dashboard button at the top of the Network Security Web UI to open the Dashboard.
If your appliance is operating in the warning or critical zone, the Appliance Utilization section is displayed at the top of the Dashboard. If it is operating in the good zone, scroll to the bottom of the Dashboard to view this section.
To specify the time period to report, click the Day, Week, or Month button at the bottom of the section.
 .
.To refresh the data, click the
 icon.
icon.
Tip
To hide all other Dashboard sections, click the
icon. Click the icon again to show the other sections.
Viewing utilization statistics using the CLI
Use the show sizing stats command to view utilization statistics.
Go to CLI enable mode:
hostname > enable
Display the statistics:
hostname # show sizing stats
Example
As shown in the following example, this command displays the current status and value for each measurement, as well as the benchmarks from which the measurements are made.
hostname # show sizing stats Stat Status Value Warning Critical Level Level Utilization summary: Warning 1 1 2 Web analysis MVX utilization(%): ok 9 75 95 Total bandwidth (Mbps): Warning 888 750 950