The About > Deployment Check page contains three sections:
Dynamic Threat Intelligence Cloud—Checks whether the appliance can receive security content updates from and upload analysis statistics to the DTI network. See Checking DTI services using the web UI .
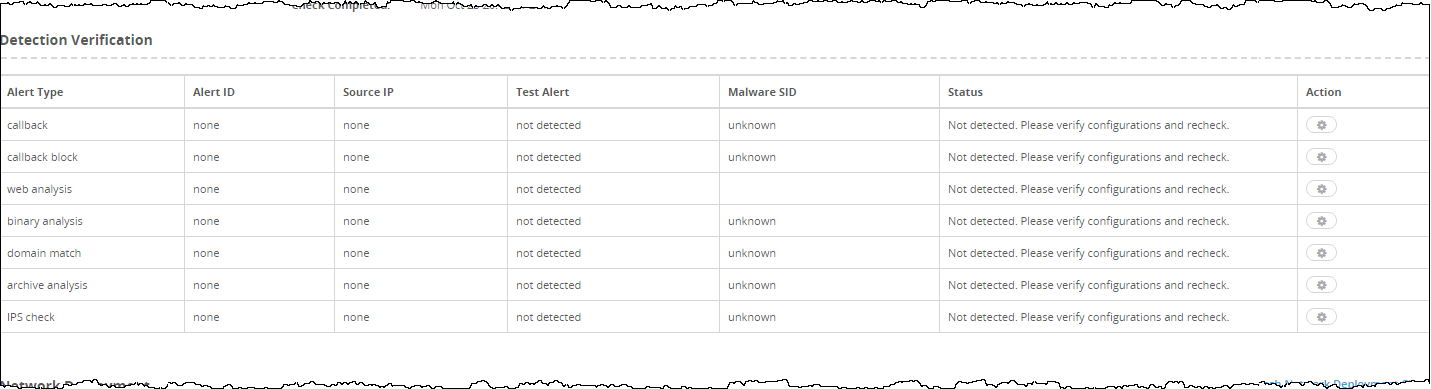
Detection Verification—Checks whether the appliance can detect the callback, callback block, Web analysis, binary analysis, domain match, archive analysis, and IPS alert types. See Checking alert detection .
Network Deployment Check—Captures all TCP traffic for a specific duration and checks for network issues, including duplicate packets, asymmetric TCP traffic, packet loss, and out-of-order packets. See Checking network deployment .
Checking DTI services using the Web UI
The DTI Cloud section of the About > Deployment Check page shows whether the appliance can receive security content updates from and upload analysis statistics to the DTI network. See Validating DTI access if the services in this section are not reachable.
Note
The other two sections on the About > Deployment Check page do not depend on DTI cloud services being reachable.

Monitor, Analyst, Operator, or Admin access
Click the About tab.
Click Deployment Check.
Click Refresh DTI Cloud and Detection Verification Check.
Checking alert detection
Alert detection tests allow you to check whether the appliance can detect callback, callback block, Web analysis, binary analysis, domain match, archive analysis, and IPS alerts.
Important
The laptop or device from which you are testing must be in the network in which the Network Security appliance is deployed inline.
Checking alert detection using the Web UI
Use the About > Deployment Check page in the Detection Verification section to check Network Security appliance alert detection.
Monitor, Analyst, Operator, or Admin access.
Network Security appliance is deployed inline.
Laptop or device from which you are testing is in the network in which the Network Security appliance is deployed.
Alerts and notifications are configured.
Click the About tab.
Click Deployment Check.
In the Detection Verification table, click the action icon (
.png) ) in the Action column, and then click Check to test whether the appliance can detect the following alert types:
) in the Action column, and then click Check to test whether the appliance can detect the following alert types:Callback
Callback block
Web analysis
Binary analysis
Domain match
Archive analysis
IPS check (if IPS is enabled)
Click Refresh DTI Cloud and Detection Verification Check to display the check results in the Detection Verification table.
If any of the checks fails, check that the hardware is installed correctly for your deployment (see the Hardware Administration Guide for your Network Security appliance for installation and deployment instructions). If the hardware is installed correctly, contact Trellix Technical Support.
Checking network deployment
The Network Security software automatically checks for network status information that might indicate appliance deployment problems. The system automatically runs the deployment check process at midnight. You can explicitly start a deployment check from the appliance Web UI or CLI, provided that a deployment check process is not already running.
A network deployment check captures all TCP traffic that enters and exits the monitoring ports for a certain duration and then analyzes the captured traffic for duplicate packets, out-of-order packets, packet loss, and asymmetric traffic flows. Based on packet counts, the network deployment check produces an overall score of success or failure. If the network deployment check fails, the Web UI and CLI output identify the specific packet counts that indicate network deployment problems.
To investigate appliance network deployment problems, you can upload the most recent packet capture files to analyze captured traffic data (such as source, destination, packet number, and description). For more information, see Uploading packet capture files for analysis .
The following events trigger network deployment check notifications:
The deployment check results transition from success to failure.
The system restarts and the last deployment check fails.
Any managed process restarts and the last deployment check resulted in failure.
If the deployment-check-failure and deployment-check-recover notifications are configured and enabled on your appliance, network deployment check notifications are sent by email and SNMP traps. For instructions, see Sending traps .
This section contains the following topics:
Viewing network deployment check results
You can view the network deployment check results. The system automatically runs the network deployment check every day at midnight.
Monitor, Analyst, Operator, or Admin access
Viewing network deployment check results using the Web UI
Use the About > Deployment Check page in the Network Deployment section to display the network deployment check results.

The following table describes the fields for the network deployment check results.
Field | Description |
|---|---|
Status | Overall status of the network deployment: success—No network deployment errors were detected. failed—Network deployment check errors were found. |
Check start time | Date and time the packet capture started. |
Check completion time | Date and time the analysis finished. |
Total captured pkts | Size (in packets) of analyzed packet capture. If this number is below a system-defined threshold, an asterisk (*) indicates that there might be a network deployment problem. |
Re-Transmitted pkts | Number of packets retransmitted. If this number exceeds a system-defined threshold, an asterisk (*) indicates that there might be a network deployment problem. |
Dup Ack pkts | Number of TCP DUP ACK records in the capture. If this number exceeds a system-defined threshold, an asterisk (*) indicates that there might be a network deployment problem. |
Out-of-Order pkts | Number of reordered packets in the capture. If this number exceeds a system-defined threshold, an asterisk (*) indicates that there might be a network deployment problem. |
Acked unseen pkts | Number of TCP ACKed unseen segments in the capture. If this number exceeds a system-defined threshold, an asterisk (*) indicates that there might be a network deployment problem. |
Previous seg not captured pkts | Number of packets that arrived with a sequence number greater than the next expected sequence number on that connection. If this number exceeds a system-defined threshold, an asterisk (*) indicates that there might be a network deployment problem. |
Malformed pkts | Number of packets in the capture that are malformed. A sender might transmit a malformed packet, or a packet can become corrupted in transit. If this number exceeds a system-defined threshold, an asterisk (*) indicates that there might be a network deployment problem. |
Asymmetric stream count | Number of asymmetric streams in the capture. If this number exceeds a system-defined threshold, an asterisk (*) indicates that there might be a network deployment problem. |
Messages | Latest deployment check is still running. Following is status for previous check: If you run this command while a network deployment check is still in progress, this message is displayed. The results of the previous network deployment check are displayed. Captured network output is available in file deployment_check.pcap. It can be uploaded with 'file tcpdump upload deployment_check.pcap'. Network statistics are available in deployment_check.pcap.txt. It can be uploaded with 'file tcpdump upload deployment _check.pcap.txt'. Whether the network deployment check overall result is success or failed, you can upload the captured and analyzed network traffic to a remote host as described in Uploading packet capture files for analysis . |
Click the About tab.
Click Deployment Check.
Review the results at the Network Deployment section.
Viewing network deployment check results using the CLI
Use the CLI commands in this topic to view the results.
The following table describes the fields for the network deployment check results.
Field | Description |
|---|---|
Status | Overall results of packet capture analysis: success—No network deployment errors were detected. failed—Network deployment check errors were detected. |
Start time | Date and time the packet capture started. |
End time | Date and time the analysis finished. |
Captured data size (bytes) | Size (in bytes) of the packet capture analyzed. |
Captured packet count | Size (in packets) of analyzed packet capture. If this number is below a system-defined threshold, an asterisk (*) indicates that the value might indicate a network deployment problem. |
Re-transmit packet count | Number of packets retransmitted. If this number exceeds a system-defined threshold, an asterisk (*) indicates that the value might indicate a network deployment problem. |
Dup ACK packet count | Number of TCP DUP ACK records in the capture. If this number exceeds a system-defined threshold, an asterisk (*) indicates that the value might indicate a network deployment problem. |
Out-Of-Order packet count | Number of reordered packets in the capture. If this number exceeds a system-defined threshold, an asterisk (*) indicates that the value might indicate a network deployment problem. |
ACKed unseen packet count | Number of TCP ACKed unseen segments in the capture. If this number exceeds a system-defined threshold, an asterisk (*) indicates that the value might indicate a network deployment problem. |
Previous seg not captured packet count | Number of packets that arrived with a sequence number greater than the next expected sequence number on that connection. If this number exceeds a system-defined threshold, an asterisk (*) indicates that the value might indicate a network deployment problem. |
Malformed packet count | Number of packets in the capture that are malformed. A sender might transmit a malformed packet, or a packet can become corrupted in transit. If this number exceeds a system-defined threshold, an asterisk (*) indicates that the value might indicate a network deployment problem. |
Stream count | Number of active streams in the capture. If this number exceeds a system-defined threshold, an asterisk (*) indicates that the value might indicate a network deployment problem. |
Asymmetric stream count | Number of asymmetric streams in the capture. If this number exceeds a system-defined threshold, an asterisk (*) indicates that the value might indicate a network deployment problem. |
Messages |
If you run this command while a previous network deployment check is still in progress, this message is displayed. The results of the previous network deployment check are displayed.
Whether the network deployment check overall result is
If you cleared the results of the last network deployment check, this message is displayed instead of the status lines. |
Go to CLI enable mode:
hostname > enable
Show full results:
hostname # show deployment check network
Network deployment check configuration: Packet Capture Duration: 120 Network deployment check status: Status: success Start time: 2017/07/21 00:00:00 End time: 2017/07/21 00:00:19 Captured data size (bytes): 10712908 Message: Captured network output is available in file deloyment_check.pcap. It can be downloaded with 'file tcpdump upload deployment_check.pcap'. Network statistics are available in deployment_check.pcap.txt. It can be uploaded with 'file tcpdump upload deployment _check.pcap.txt'.
Show configuration information only:
hostname # show deployment check network config
Network deployment check configuration:
Packet Capture Duration: 120
Show status information only:
hostname # show deployment check network status
Network deployment check status:
Status: success
Start time: 2017/07/21 01:19:55
End time: 2017/07/21 01:20:56
Captured data size (bytes): 10277941
Message: Captured network output is available in file deployment_check.pcap. It can be uploaded with 'file tcpdump upload deployment_check.pcap'. Network statistics are available in deployment_check.pcap.txt. It can be uploaded with 'file tcpdump upload deployment _check.pcap.txt'.
Show status details only:
hostname # show deployment check network status detail
Latest deployment check is still running. Following is status for previous check Network deployment check status: Status: failed Start time: 2017/07/24 08:44:38 End time: 2017/07/24 08:44:48 Captured data size (bytes): 10691225 Captured packet count: 97239 Re-transmit packet count: 12079 Dup ACK packet count: 870 Out-Of-Order packet count: 21303 * Acked unseen packet count: 162 Previous seg not captured packet count: 4180 Malformed packet count: 0 Stream count: 1260 Asymmetric stream count: 94 Message: Captured network output is available in file deployment_check.pcap. It can be downloaded with 'file tcpdump upload deployment_check.pcap'. Network statistics are available in deployment_check.pcap.txt. It can be uploaded with 'file tcpdump upload deployment _check.pcap.txt'. * Indicates error
Uploading packet capture files for analysis
To investigate appliance network deployment problems, you can upload the most recent files containing captured traffic data to a remote host.
deployment_check.pcap—After you upload this file, use a packet browser to analyze the captured traffic.
deployment_check.pcap.txt—After you upload this file (which is derived from the deployment_check.pcap file), open it in a text editor to analyze the captured traffic.
You can upload the files over File Transfer Protocol (FTP), Trivial File Transfer Protocol (TFTP), Secure File Transfer Protocol (SFTP), or Secure Copy (SCP).
Admin access
Uploading packet capture files for analysis using the CLI
Use the commands in this section to upload packet capture files to a remote location.
Go to CLI configuration mode:
hostname > enable hostname # configure terminal
To upload the
.pcapfile:hostname (config) # tcpdump upload deployment_check.pcap <URL>
To upload the
.txtfile:hostname (config) # tcpdump upload deployment_check.pcap.txt <URL>
The <URL> parameter must be the full path to the upload destination. For example:
ftp://<domain>/<path>/<fileName>tftp://<domain>/<path/<fileName>scp://<username>:[<password>]@hostname>/<path>/<fileName>
Example
The following example uploads the deployment_check.pcap file to the debug directory at acme.com.
nx-12 (config) # file tcpdump upload deployment_check.pcap scp://it123:it123pass@acme.com/debug/deployment_check.pcap
Starting a network deployment check
You can explicitly start a network deployment check from the Network Security Web UI or CLI.
Monitor, Analyst, Operator, or Admin access.
Monitoring interfaces are "up."
Starting a network deployment check using the Web UI
You can manually start a network deployment check from the Network Security Web UI if another check is not running.
Click the About tab.
Click Deployment Check.
Click Refresh Network Deployment Check.
For information about viewing the results, see Viewing network deployment check results .
Starting a network deployment check using the CLI
You can manually start a network deployment check from the CLI if another check is not running.
Go to CLI enable mode:
hostname > enable
Start the check:
hostname # deployment check network start Network deployment check has been started. Please run 'show deployment check network status' for status update
For information about viewing the results, see Viewing network deployment check results .
For command details, see the CLI Command Reference.
Configuring the maximum packet capture duration
You can override the default maximum packet capture duration used by the network deployment checking feature. The default value is 120 seconds. The maximum capture number is 100,000 packets, regardless of the packet capture duration.
Operator or Admin access
Go to CLI enable mode:
hostname > enable
(Optional) Display the current duration:
hostname # show deployment check network
Specify the new duration:
hostname # deployment check network duration <seconds>
Example
The following example sets the upper limit for packet capture duration to 60 seconds:
hostname # deployment check network duration 60
For command details, see the CLI Command Reference.
Clearing network deployment check results
You can clear the results of the last network deployment check. This operation leaves the packet capture itself intact. The packet capture data is stored in the deployment_check.pcap and deployment_check.pcap.txt files, which you can upload to a remote host (see Uploading packet capture files for analysis ). The next network deployment check, whether started automatically at 00:00 (midnight) or started explicitly using the CLI or Web UI, generates a new set of results.
Note
If a network deployment check results in the failed status, network deployment check notifications are triggered to report the failed events. If you do not clear the results, subsequent system restarts and managed process restarts will trigger new notifications for the same events.
Monitor, Analyst, Operator, or Admin access
Go to CLI enable mode:
hostname > enable
Clear the results:
hostname # deployment check network clear
Example
The following example shows the network deployment check status after the results are cleared.
hostname # show deployment check network status detail Network deployment check status: Message: Please run 'deployment check network start' * Indicates error
For command details, see the CLI Command Reference.
Configuring the maximum packet capture duration
You can override the default maximum packet capture duration used by the network deployment checking feature. The default value is 120 seconds. The maximum capture number is 100,000 packets, regardless of the packet capture duration.
Operator or Admin access
Go to CLI enable mode:
hostname > enable
(Optional) Display the current duration:
hostname # show deployment check network
Specify the new duration:
hostname # deployment check network duration <seconds>
Example
The following example sets the upper limit for packet capture duration to 60 seconds:
hostname # deployment check network duration 60
For command details, see the CLI Command Reference.
Clearing network deployment check results
You can clear the results of the last network deployment check. This operation leaves the packet capture itself intact. The packet capture data is stored in the deployment_check.pcap and deployment_check.pcap.txt files, which you can upload to a remote host (see Uploading packet capture files for analysis ). The next network deployment check, whether started automatically at 00:00 (midnight) or started explicitly using the CLI or Web UI, generates a new set of results.
Note
If a network deployment check results in the failed status, network deployment check notifications are triggered to report the failed events. If you do not clear the results, subsequent system restarts and managed process restarts will trigger new notifications for the same events.
Monitor, Analyst, Operator, or Admin access
Go to CLI enable mode:
hostname > enable
Clear the results:
hostname # deployment check network clear
Example
The following example shows the network deployment check status after the results are cleared.
hostname # show deployment check network status detail Network deployment check status: Message: Please run 'deployment check network start' * Indicates error
For command details, see the CLI Command Reference.