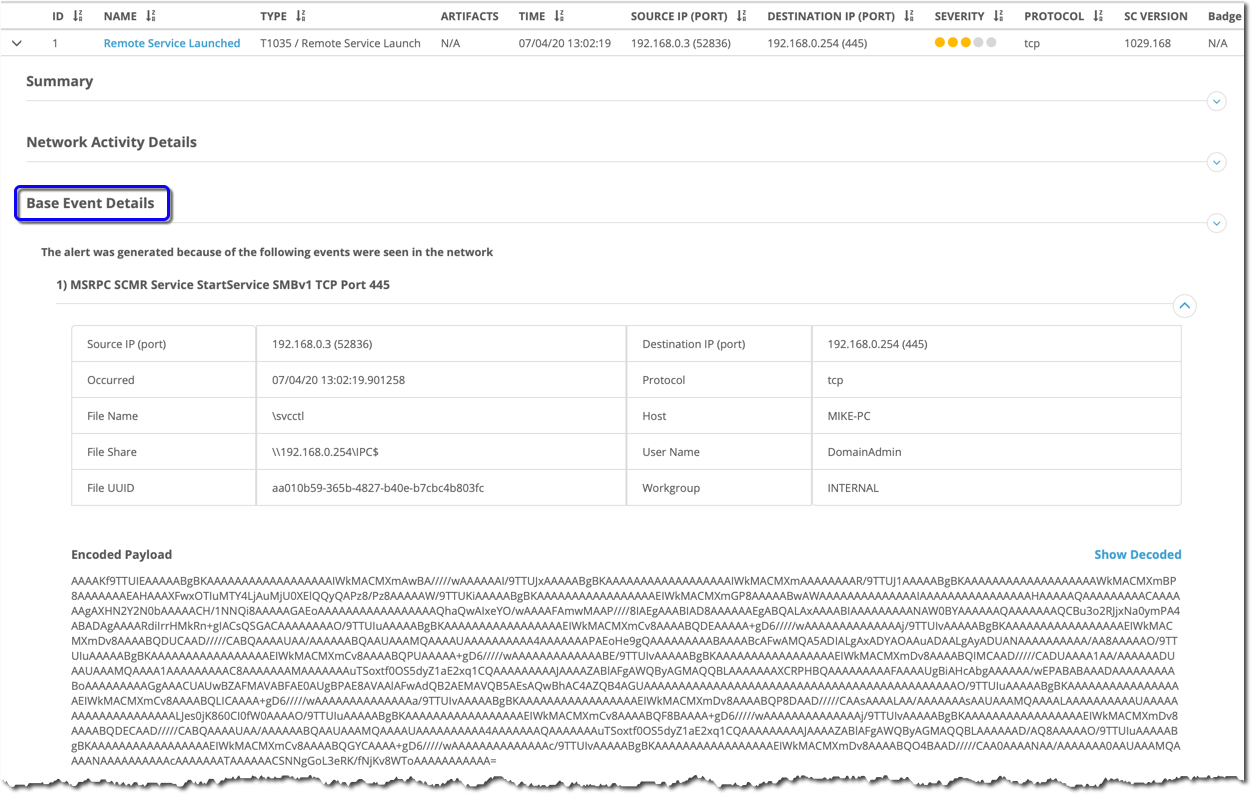
The Base Event Details panel lists the indicators that triggered the selected SmartVision alert.
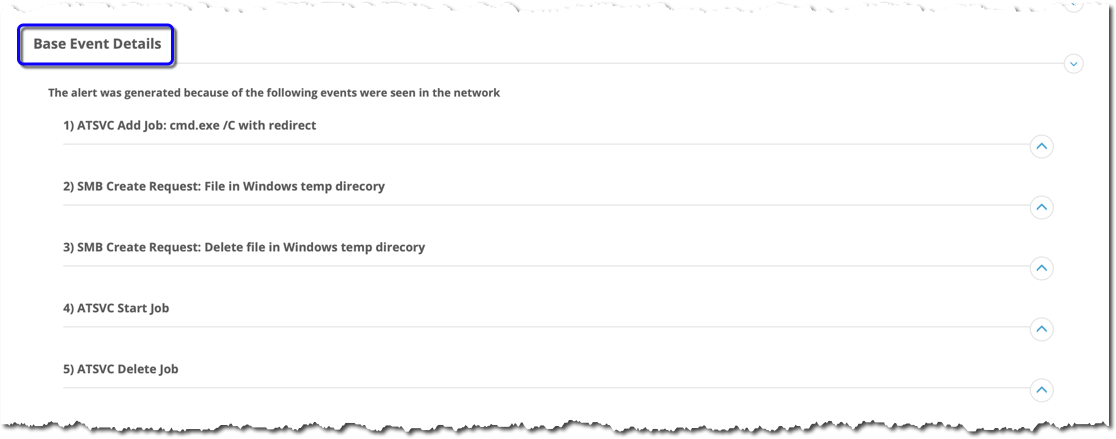
The Base Event Details panel lists all indicators that triggered the alert and shows the following information for each indicator:
Field | Description |
|---|---|
Displayed for all alert base events | |
Name | The name of the base event. Example: |
Source IP (port) | The IP address of the network host that originated the event and the port number from which the traffic was sent. Example: |
Destination IP (port) | The IP address of the network host that was targeted by the event and the port number to which the traffic was sent. Example: |
Occurred | Date and time when the event occurred. Example: |
Protocol | The protocol used to transport data. Example: |
Payload | By default, the payload is displayed encoded. Example: Click Show decoded to view the payload decoded. Example: |
Extracted from SMB traffic (if the victim and host are authenticating over NTLM) | |
File name | The files transferred from attacker to the victim machine. Can include named pipes, executables, plain-text files, and scripts. Example: |
File share | The remote shares used to initiate a transfer or to access named pipes. Usually one of the following hidden shares for Windows hosts: Example: |
File UUID | The universally unique identifier associated with the files transferred from attacker to the victim machine. Example: |
Host | The name of the attacker machine. Example: |
User name | The username on the attacker machine. Example: |
Workgroup | The workgroup of the host. Example: |
Prerequisites
Log in to the appliance Web UI and choose Alerts > SmartVision.
Click the arrow at the left side of the SmartVision alert group you want to explore.
Click the arrow at the left side of the individual SmartVision alert you want to explore. The Summary panel is expanded by default.
Click Base Event Details. The panel lists the events seen in the network that caused the alert to be generated.
Expand a numbered event to view base event details.