Follow the below steps to navigate to Alerting dashboard and perform alert analysis.
Log on to Trellix EDR.
Navigate to Menu → Alerting.
Based on the time frame of alert occurrence, filter the duration.
Note
The alerting dashboard displays up to 5,000 alerts. We recommended you to filter the alert occurrence duration for more accurate and effective analysis.
Based on the alert duration selected, you receive a list of alerts, each color-coded according to severity. Red corresponds to high severity, orange for medium, and yellow for low.
Each alert is provided with a pre-defined set of metrics for alert analysis. They include:
Device Name — gives you the details of the device from which the alert originated.
Agent ID — displays the Agent ID associated with the device for which the alert was generated.
Note
The EDRF Client generates a unique Agent ID for each endpoint. The interface displays the Agent ID only when the endpoint runs on the EDRF Client and is connected to the Endpoint Security (HX) server. The field remains blank if the endpoint is disconnected.
Date — points out the date of occurrence of the alert corresponding to the device.
Detection Date — displays the time the Trellix EDR cloud server processed the trace event.
Note
The Detection Date can differ from the Date when an endpoint is offline. The Detection Date displays the time the endpoint reconnects to the cloud server.
Command Line — refers to the command or script that was executed on the corresponding device, triggering the underlying alert.
Technique Id — corresponds to the unique ID of a MITRE knowledge base article. This ID can be used to obtain information about the tactical goal of the underlying alert. For details, see MITRE Techniques.
Process Name — refers to the name of the process or the executable file that was run on the device, causing the alert.
Suspicious Indicators — are suggestive indicators informing about the possible suspicious actions intended by the alert.
Note
Filters are provided for each metric that allows you to filter the the alert list based on the filtered option chosen in metric. You can sort any predefined metric using operators such as AND, OR, Group By, etc.
You can click any alert from the Alerting dashboard to view the alert details, device information, user details, process name, suspicious indicator, and MITRE ATT&CK Tactics and Techniques corresponding to the alert and View Trace Graph. For more information about View Trace Graph, see View Trace Graph.
You can analyze a device in detail by clicking the device name in the Device Name column. You are directed to Device Search page, where you can perform more detailed analyses on the device by using the functionalities available in Device Search. For more information about Device Search investigations, see Search for historical data on a single endpoint..
View Trace Graph
The View Trace Graph feature in the EDRF Alerting dashboard provides detailed sequential view of a particular alert, that includes processes, API calls, files, registry keys, network connections, DLL files, and threats for each event type during alert progression.
Follow these steps to use the View Trace Graph feature.
In the Alerting dashboard, click the alert to be analyzed, upon which a Alert Details pane is displayed to the right. In the Alert Details pane, you can find details pertaining to the alert such as Alert Time Stamp, Command Line, MITRE ATT&CK Tactics and Techniques, Device details and user details.
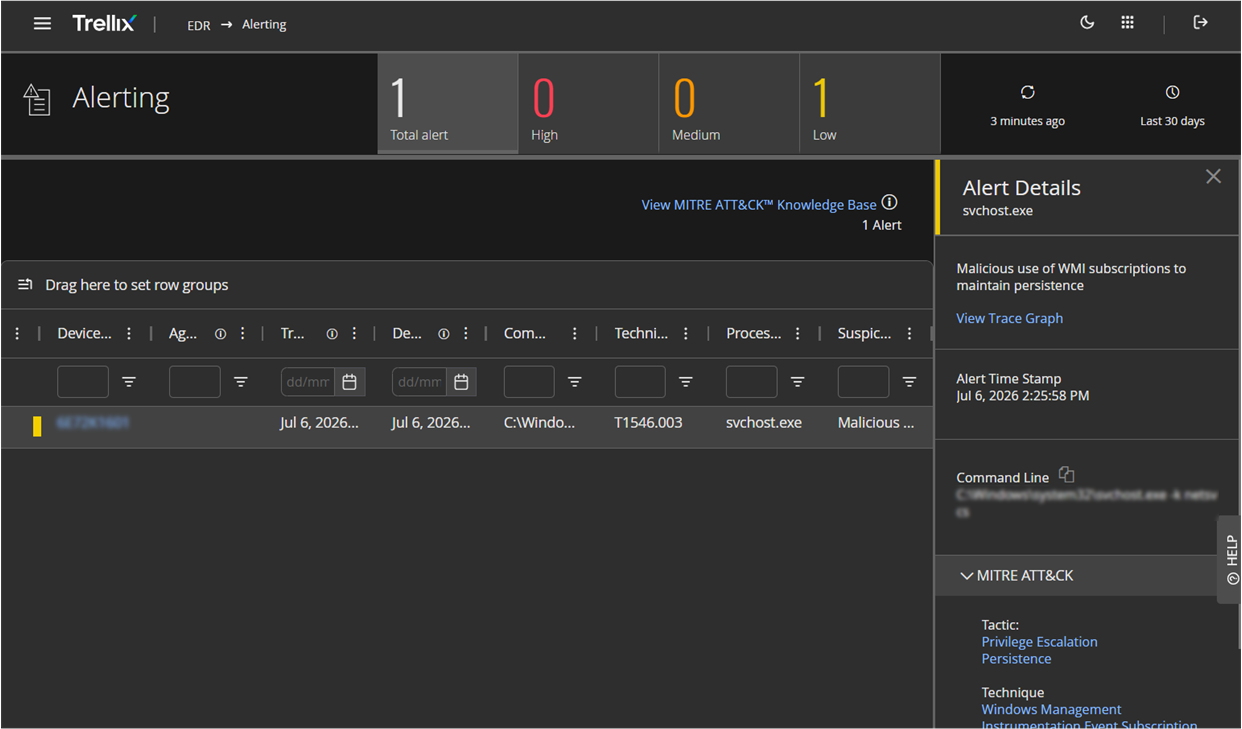
Select the View Trace Graph option.
A new pane appears. This contains Threat Behavior, Trace Graph , and Sequential View details along with the Alert Details pane.
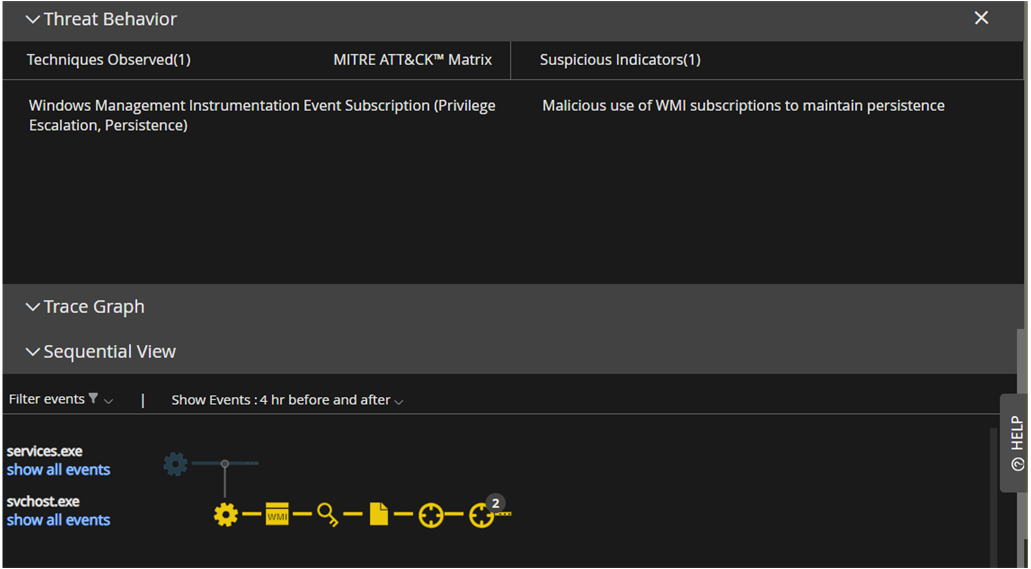
Note
You can collapse or minimize the Alert Details pane after navigating to the View Trace Graph pane.
Each Event Type is associated with a unique icon. Click them to view more details associated with each Event Type at a specific point in the Trace Graph in the Event details pane. Additionally, you can view the operation performed on any Windows Management Instrument (WMI) events in the Event details pane.
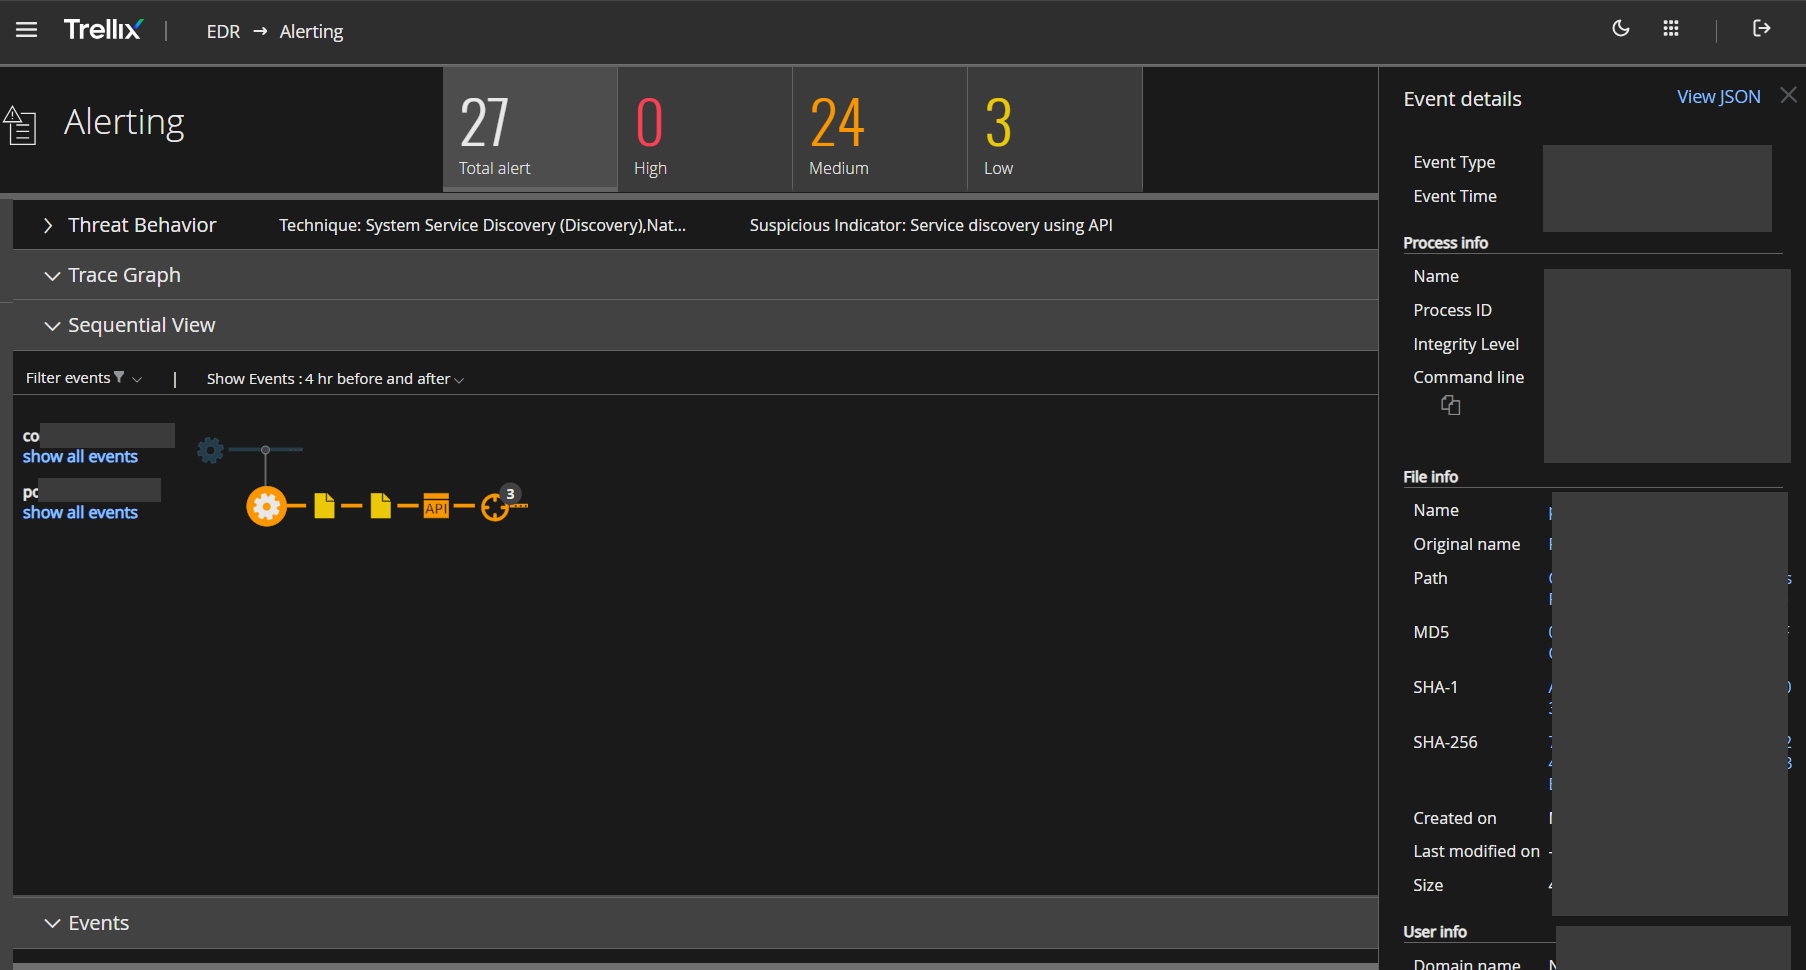
The filter option allows you to optimize the Trace Graph. Use this filter option to filter the severity and Event Types.
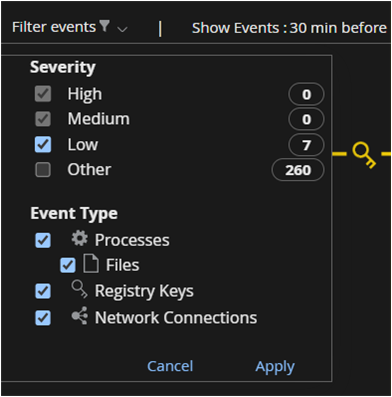
Additionally, you can view the process details in the Trace Graph, pertaining to the trace view obtained from the filtered options.
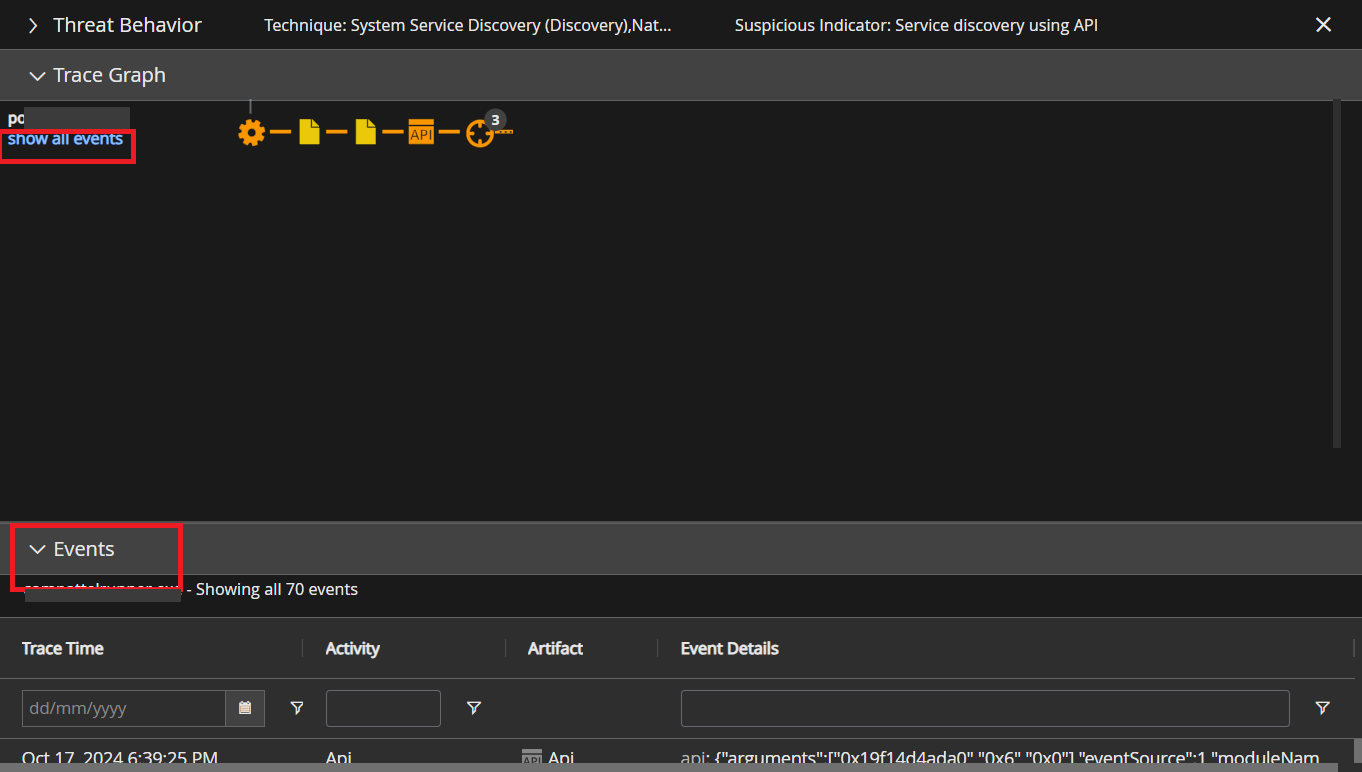
Click show all events to view all events associated with the selected Trace Graph view.
Note
The unique symbols and their descriptions tied to each event type can also be viewed in the Events section.
Some event types are denoted with a number on top
 . This denotes the number of similar event types detected at that point in the Trace Graph. Click the respective event type to view the details pertaining to the multiple event types at a particular point in the trace graph.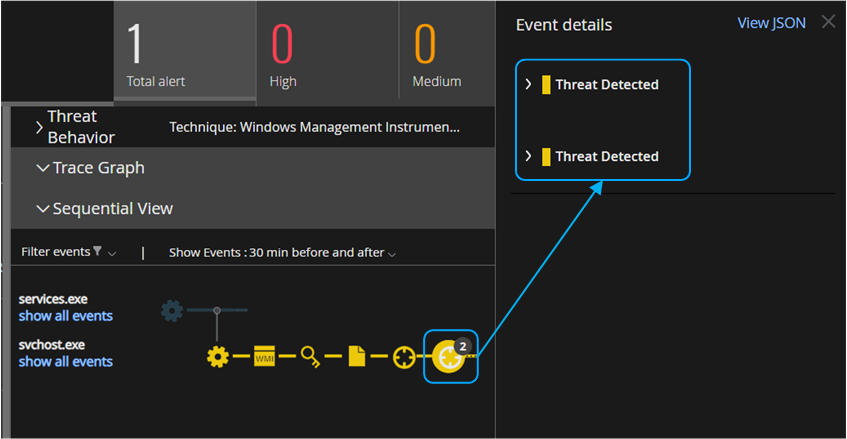
You can also view the JSON script associated with each Event Type by selecting the applicable Event Type on the Trace Graph and then clicking the View JSON option.