The Scan Management page gives a visual representation of all scans that are created. It allows you to create scans or edit scan configuration settings. It also shows you whether a scan is running, completed, paused, or stopped. When you create a scan, the scan gets added to the top of the list. You can select a scan to view and edit its details on a separate pane.
You can access the Scan Management page from Menu → Data Protection → DLP Discover. The Scan Management page consists of the Scans and the scan details panes. When you click a scan, the scan details are shown in a separate pane on the right.
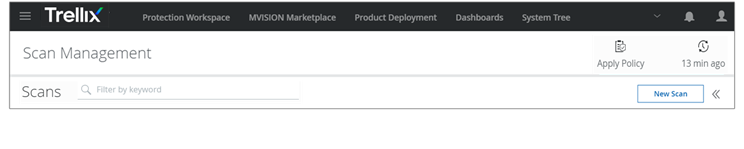
The Scan Management header shows the last refreshed time of the page and the Apply Policy option.
Click Apply Policy to apply all pending policy changes to the scans. Apply Policy is enabled when there is any change made to a scan. For example, changes in schedule, classifications, or rule set. After you make a change, click Save and then click Apply Policy to bring the changes into effect.
Click the refresh icon to update the Scan Management page with the latest scans and to see the updated scan status.
Use Filter by keyword to search for specific scans by name.
Click New Scan and enter the details required to create a scan.
Click
 to show or hide the panes on the Scan Management page.
Scans pane
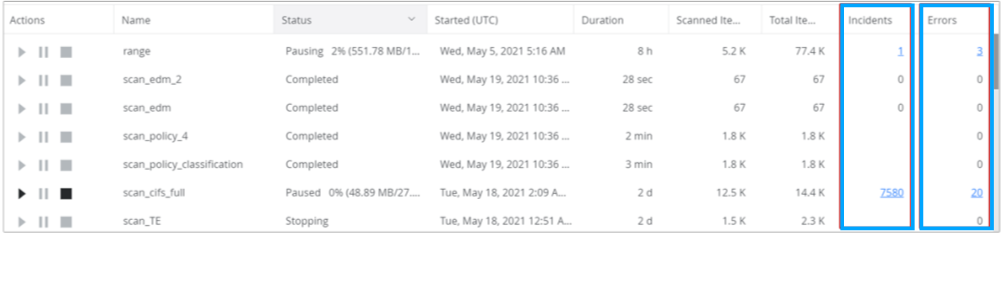
On the Scans pane, view the list of scans. View the scan names, status, start time, and duration of the scan. You can also view the number of files that are scanned out of the total number of files that are in the repository, number of incidents, and errors generated during a scan. Click the
 ,
,  ,
,  icons in the Actions column to resume, pause, or stop a scan.
You can click the value in the Incidents column to see the incident details in the Incident Management page. For more information, see Managing Trellix DLP – SaaS incidents.
You can click the value in the Errors column to see the event details in the Operational Event Management page. You can view details of the event such as the date on which the event occurred, the type of event, and reason for the error. For more information, see Managing operational events.