The new dashboard platform provides a centralized view of your security data. You can customize layouts to monitor email insights and threat management tasks efficiently. Use this page to view system dashboards, create custom ones, and manage public or private dashboard visibility from the dashboard table.
Go to View > New Dashboard to access the new dashboard management workspace. Refer to the sections below to know more about managing the dashboards.
Dashboard overview table
The dashboard overview table shows a list of all the custom dashboards. The My Organization Dashboards tab shows the public dashboards shared by you and other team members. The My Private Dashboards tab shows your private dashboards.
You can toggle between tile and list views. Use the search bar to search a dashboard by name.
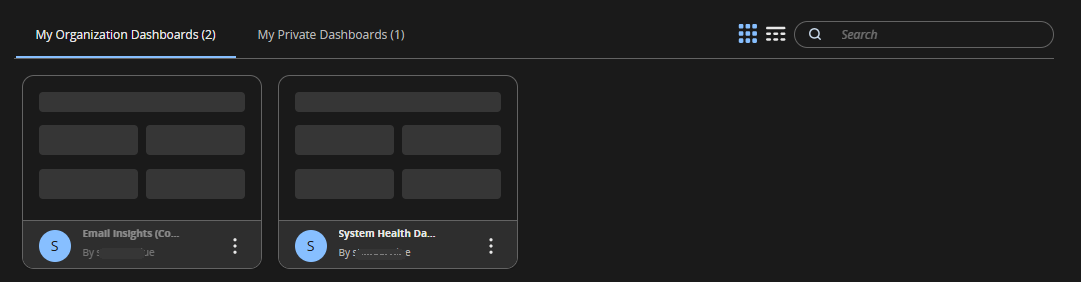

The Actions column lists the following tasks:
Add (+) button adds a hidden dashboard or a public dashboard to your workspace.
Use the Copy button to make a copy of a dashboard.
Use the Hide button to hide a dashboard from your workspace. Use the Add button to add it back.
The Manage button lets you modify the names, description and visibility of a dashboard.
Use the Delete button to delete a dashboard.
Trellix-managed system dashboards
System dashboards are created and maintained by Trellix, including the layouts and the widgets.
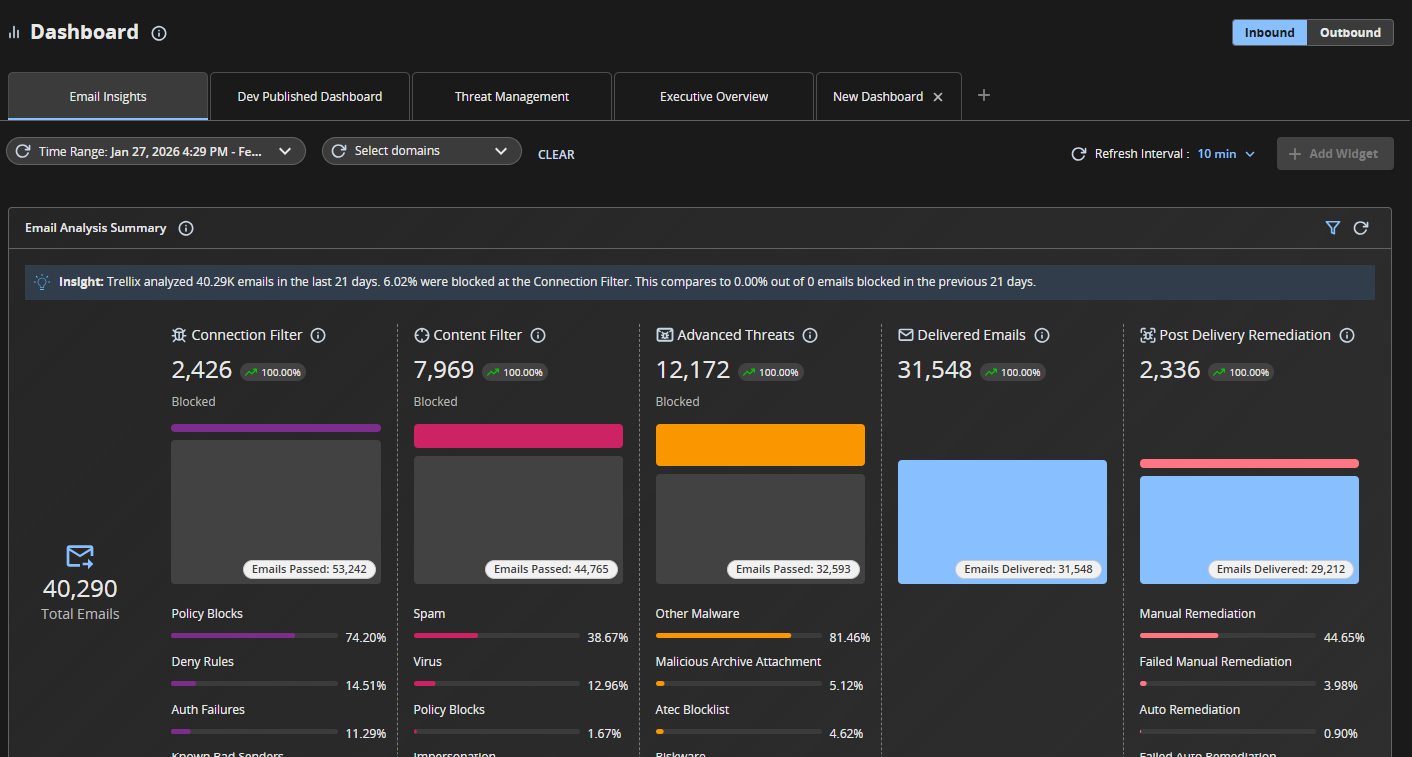
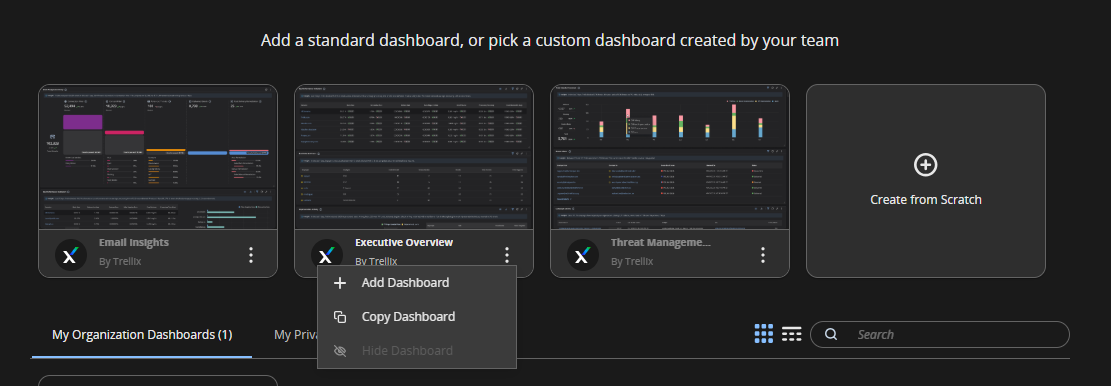
The Email Insight system dashboard provides a centralized view of email analysis, traffic trends, and rule performance. Use this dashboard to monitor threat protection and system efficiency across your domains.
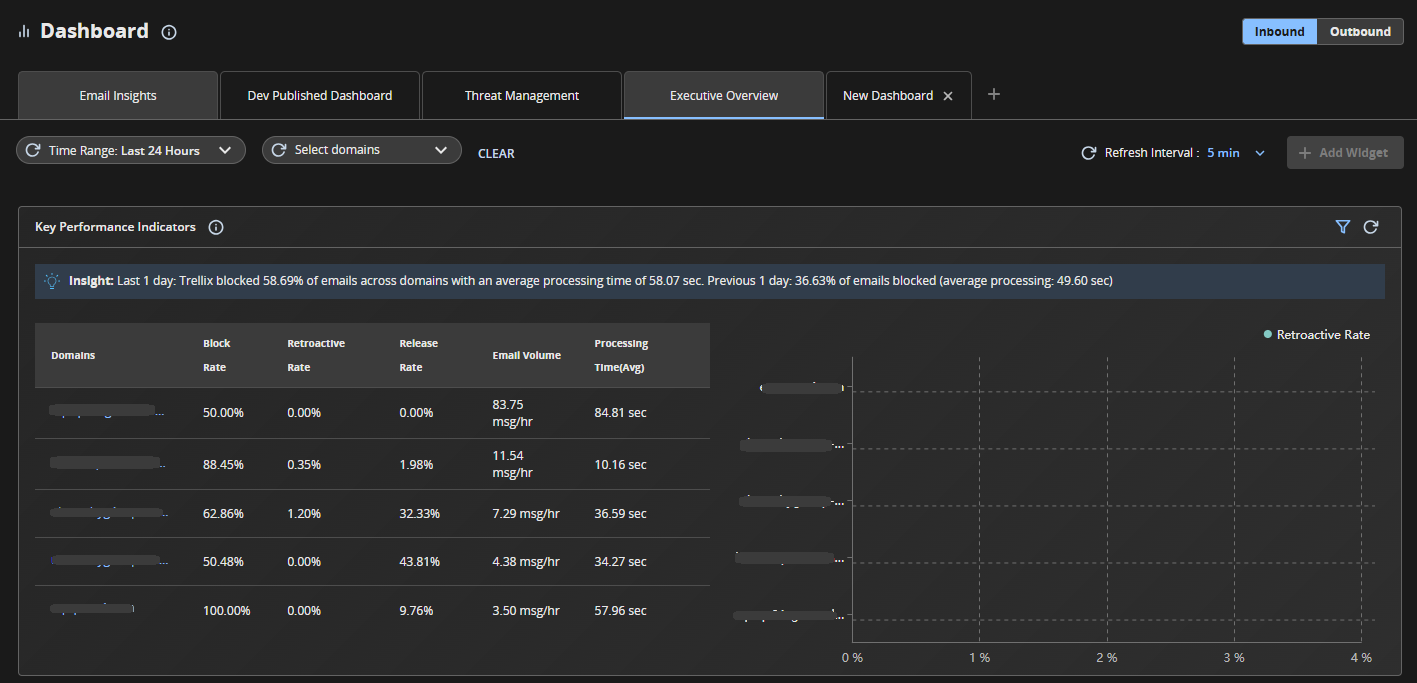
The Executive Overview system dashboard provides a high-level summary of system performance, email traffic, and threat mitigation. Use this dashboard to monitor key metrics and evaluate the effectiveness of your security policies across all domains.
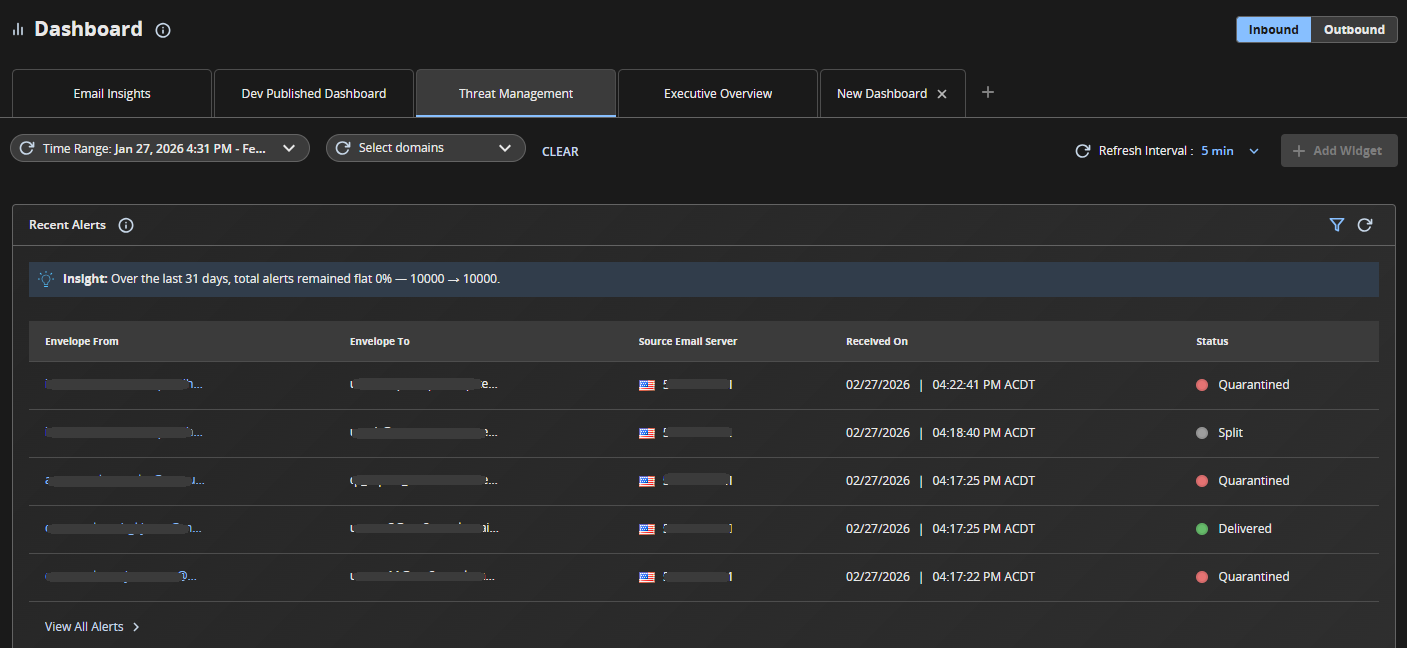
The Threat Management system dashboard provides visibility into security events, threat actor profiles, and mitigation trends. Use this dashboard to analyze how threats enter your environment and to verify the stability of your security posture.
Follow the steps below to manage system dashboards:
Click on a system dashboard tile and click Add Dashboard to add it to your workspace.
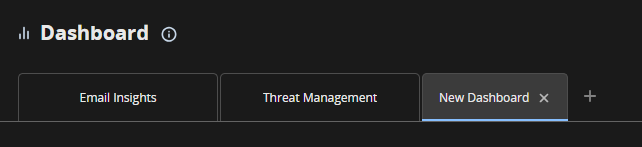
Click + adjacent to the last tab to add another dashboard.
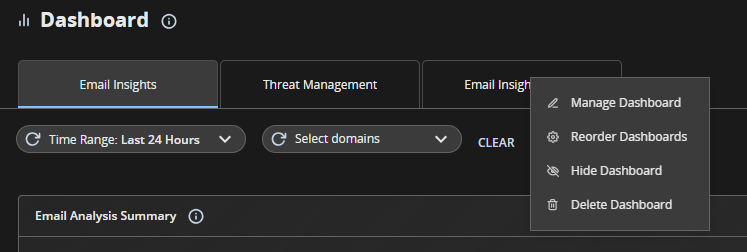
Right-click on a dashboard tab to avail the following options: Manage, Reorder, Hide and Delete. Add a hidden dashboard from the Dashboard Overview table. You can only reorder or hide system dashboards. You cannot edit or delete a system dashboard.
You can filter the dashboards based on Time and Domains. Use the Save Changes button to save the filtered views.
Use the Inbound and Outbound toggle buttons to view the respective datasets.
Select a Refresh Interval from 5, 10, or 15 minutes.
You cannot add, delete or modify any widgets in a Trellix-managed system dashboard. You can only filter and refresh data in a widget.
Private dashboards
You can create and own private dashboards and manage the layouts and widgets. Only you can view your private dashboards.
Customised Trellix-managed system dashboard
Click Copy Dashboard to create a custom dashboard from a Trellix-managed system dashboard. Additional to the existing functionalities of a system dashboard, you can add, delete or modify widgets in a custom dashboard. There are two ways to copy a system dashboard:
Click on a system dashboard tile and click Copy Dashboard to make a copy and add it to your workspace.
In the dashboard overview table, click Copy in Actions column to make a copy of the dashboard.
Creating a dashboard from scratch
Click the Create from Scratch tile to create a new dashboard. Provide a name and description. Select the privacy settings for the dashboard. Add, delete or modify widgets as per your requirement.
You can perform the following actions on your private dashboards:
Add, remove and rearrange widgets.
Rename a widget or export the widget details as a CSV file.
Modify the dashboard layout.
Apply filters and save the filtered views.
Add, edit, hide, copy or delete the private dashboards.
Public dashboards
Change the visibility of your private dashboards to create public dashboards and share it with other users of your organization. The layout, widgets, and filters are read-only for viewers. You can do it in two ways.
Right-click on a dashboard tab, select Manage and change visibility.
In dashboards overview table, select Manage for a dashboard and change visibility.
You can perform the following actions on a public dashboard you created:
Add, remove and rearrange widgets.
Rename a widget or export the widget details as a CSV file.
Modify the dashboard layout.
Apply filters and save the filtered views.
Add, edit, hide, copy or delete the private dashboards.
Other users can perform the following actions on a public dashboards you created:
View the dashboard.
Add and Hide the dashboard.
Copy the published dashboard to create a private dashboard.
Widgets
The following widgets enables you to monitor your environment and evaluate the effectiveness of your security policies. The following widgets are repeated across multiple system dashboards.
Email Admin Widgets:
Email Analysis Summary: Provides a summary of email analysis metrics, including total emails analyzed. |
Email Trace: Displays email trace information for auto or manual remediation actions taken on emails |
Top Rules: Displays the top rule hits |
Recent Alerts: Displays a list of the latest email alerts, showing key metadata including its final processing status |
SOC Analyst Widgets:
Key Performance Indicators: Displays key performance indicators for the system, including email processing times and block rates |
Rules Configured: Provides an overview of the rules configured |
Threat Source: Maps the global origins of incoming cyberattacks |
DMARC Authentication Report: Evaluates overall email security health by tracking DMARC pass/fail trends alongside individual SPF, DKIM, and DMARC performance metrics |
CISO Widgets:
Email Traffic Summary: Summarizes email traffic metrics, including total emails received, accepted, and rejected. |
Attack Vectors: Categorizes and counts threats based on the primary attack mode used, such as attachments and URLs |
Attacker Profiles: Identifies the most frequent indicators of compromise by listing the Top Sender Details, and malicious content associated with the attacks |
Campaign Activity: Provides an overview of malicious campaigns directed at your organization |
Add a widget to a dashboard:
Click Add Widget.
Select a widget tile from the widget library and click Next.
You can modify the widget name and description.
Select Add Widget.
You can perform the following actions on a widget:
Rename the widget.
Remove the widget.
Export the widget details as a CSV file.
Apply filters.
Refresh widget data.