159
Getting Started
!
INFO
LOGIN INFORMATION
As part of the onboarding process, the Cloudvisory team will provide credentials for your administrator. Please contact your Cloudvisory account representative if there are any problems.
Log In
To log in, enter the credentials provided by Cloudvisory.
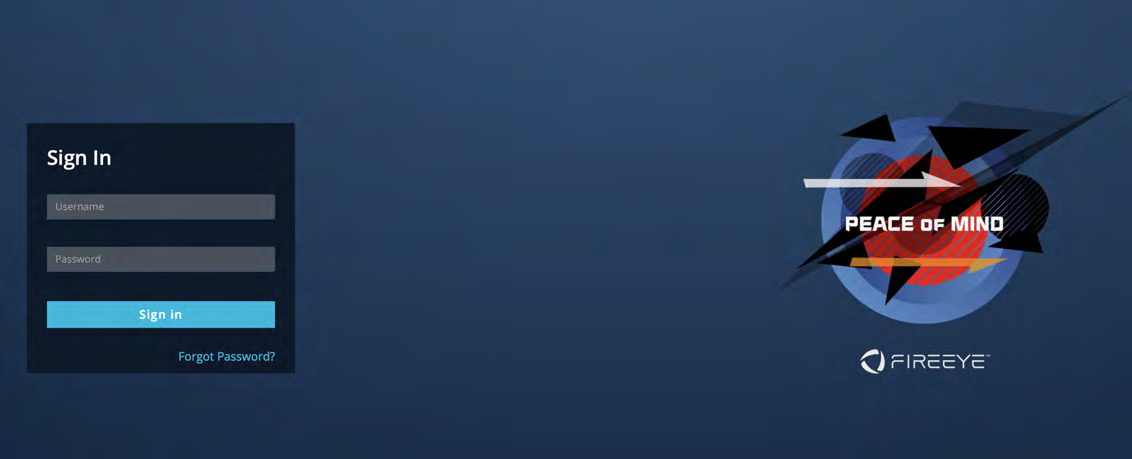
First time log in
Use the username and password provided by your administrator/credentials sent to your registered email. For security reasons and to secure the account users are forced to change the password. Without resetting the password user will not be able to proceed further.
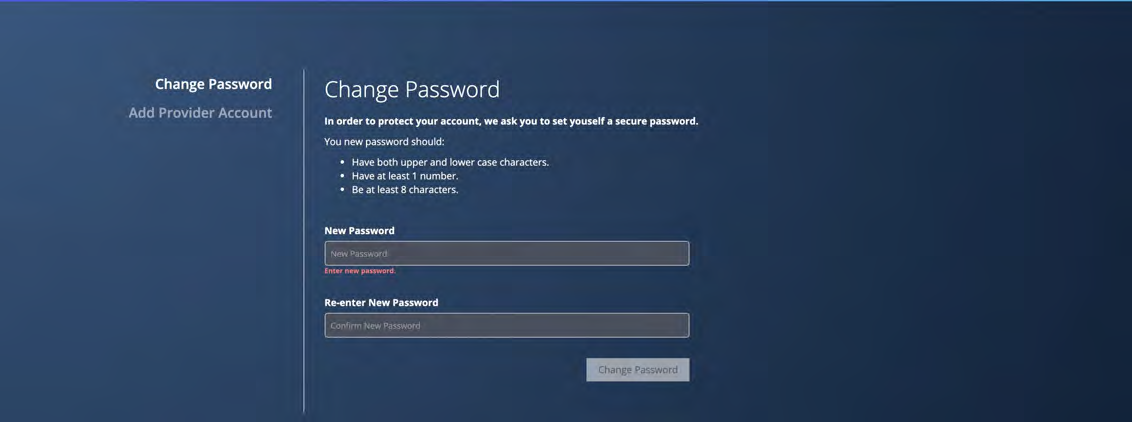
First time On-Boarding provider account
Once the password is updated user can add provider accounts before proceeding further or you have an option to skip to the dashboard. Use the onscreen instruction to add provider account.
Copyright © 2021 Cloudvisory Documentation, Fireeye Inc.
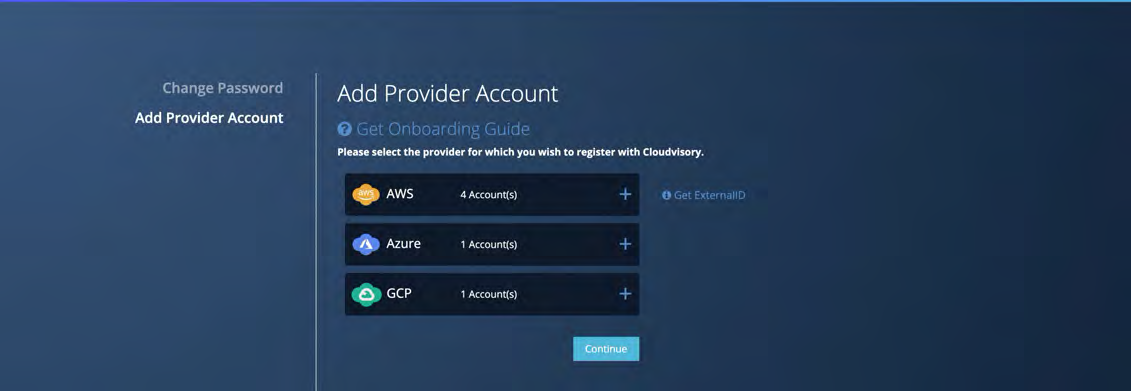
NOTE
Onscreen on-boarding will appear if the account has no provider account or for first time user login.
See On-Boarding_provider for more info.
Log Out
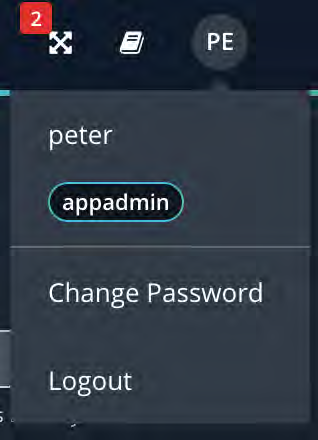
You can manually log out by clicking Logout in the user dropdown menu on the top right corner of the application.
You will be automatically logged out after 30 minutes of inactivity.
Administrators can change the account password by clicking Change Password.
Copyright © 2021 Cloudvisory Documentation, Fireeye Inc.
5
Support
Contact our product experts 24x7 via the FireEye online support portal, live Chat or our network of global customer support centers.
Copyright © 2021 Cloudvisory Documentation, Fireeye Inc.
6
Workload License
What is a "Workload"?
A Workload is a discovered cloud asset that can perform work, communicated over a network and be associated with at least five (5) security controls which can be monitored and/or managed by Cloudvisory.
What is the "Workload license Limit"?
The Workload license Limit entitles your Cloudvisory environment to protect a specific number of Workloads. For each active Workload, a single Workload-license is consumed from Workload license Limit.
When a Workload is deleted / terminated, Cloudvisory automatically detects and stores this change; in the process, the associated Workload-license is automatically returned to the available pool of licenses.
Workload license Limit Alert
Cloudvisory automatically generates alerts when the system utilizes pre-defined percentages (80%, 90%, 95% and 100%) of the Workload license Limit. In order to provide visibility to users in the Cloudvisory UI, these alerts are shown in the “Dashboard” and also in the “Alerts” tab.
In order to provide visibility outside of the product, alerts are sent to users through customizable email templates.
Utilizing 80% of
Workload license Limit(Severity=LOW)Utilizing 90% of
Workload license Limit(Severity=MEDIUM)Utilizing 95% of
Workload license Limit(Severity=HIGH)Utilizing 100% of
Workload license Limit(Severity=CRITICAL)
Cloudvisory generates a CRITICAL severity alert when the system utilizes 100% of the WORKLOAD LICENSE LIMIT.
Cloudvisory will keep protecting licensed workloads, though discovery of new workloads will stop once the TOTAL WORKLOADS exceeds the Workload license Limit.
Requesting an update to Workload license Limit
Because cloud environments are dynamic by nature, Cloudvisory’s Workload license Limit is designed to allow for fluctuations in the number of managed workloads.
If you consistently have more Workloads to manage than your license allows, however, you may need to request an increase to your “Workload license Limit” for Cloudvisory:
SaaS Deployments
If your deployment is created through AWS Marketplace, please go to Cloudvisory Marketplace to increase Workload license Limit.
If your deployment is managed by FireEye (but not created through a cloud “Marketplace”), please contact the FireEye Support team to request an increase to Workload license Limit.
On-Premises/Remote Deployments
If your deployment is in your own datacenter, please contact your FireEye sales representative to request an increase to Workload license Limit. Contact FireEye Support
AWS (Deployed in AWS Cloud)
Step-by-step guide
You need the following information to onboard an AWS (Cloud) Provider Account in Cloudvisory:
RoleARN: The ARN of the AWS role which provides permission to access the aws account from Cloudvisory.
ExternalID: To assume the RoleARN of the AWS role, users must be in the trusted account and provide this exact external ID.
Get External ID
Go to Settings > Providers > AWS and click the "Get ExternalID"

S3BucketName: The name of the S3 bucket for VPC flow log.
INFO
If you have workloads in one of following regions, follow the steps in "Onboard AWS Account in Cloudvisory (Data Center)" instead. By default, AWS has restricted these regions and disabled STS tokens for them.
Middle East (Bahrain), Africa (Cape Town), Asia Pacific (Hong Kong), Europe (Milan).
Configure Using a CloudFormation Template
Create a file named cloudvisory-aws-onboard.yaml and paste the following cloudformation template code in it.
You can also download the .yaml cloudformation template code here
NOTE
Get the externalID from AWS tab from Providers page under settings menu. Get externalID
cloudvisory-aws-onboard.yaml
AWSTemplateFormatVersion: 2010-09-09
Parameters:
CloudvisoryFlowS3BucketName:
Description: Bucket to collect vpc flows
Type: String
Default: cloudvisory-flows
CloudvisoryTrailName:
Description: Trail to collect cloudtrail logs
Type: String
Default: cloudvisory-trail
CloudvisoryTrailS3BucketName:
Description: Bucket to collect cloudtrail logs
Type: String
Default: cloudvisory-trail
CloudvisoryRoleName:
Description: Name of the IAM Role to be created by this template and used by FireEye Cloudvisory
Type: String
Default: cloudvisory-fireeye-service
ExternalAccountId:
Description: ID of the monitoring AWS account where the Cloudvisory deployment is running
Type: String
Default: "690625724779"
ExternalSecretId:
Description: Shared secret used to validate the trust relationship between the monitored and monitoring AWS accounts, This value must be get from Cloudvisory UI(Click 'Get External Id' in Aws tab in Provider page under Settings menu item)
Type: String
Default: "" # Copy the External ID by clicking "Get ExternalID" from Aws tab in Providers page under Settings menu item.
CloudvisoryFlowLogsPolicyEnable:
Description: Control the optional creation of the policy named by the 'CloudvisoryFlowLogsPolicyName' parameter
Type: String
Default: "enable"
CloudvisoryFlowLogsPolicyName:
Description: Name of the IAM Policy to be created and attached to the IAM Role ; grants Cloudvisory discovery permissions for VPC Flow Logs
Type: String
Default: cloudvisory-flow-permissions
CloudvisoryCloudtrailPolicyName:
Description: Name of the IAM Policy to be created and attached to the IAM Role ; grants Cloudvisory discovery permissions for VPC Flow Logs
Type: String
Default: cloudvisory-cloudtrail-permissions
Copyright © 2021 Cloudvisory Documentation, Fireeye Inc.
CloudvisoryReadPolicyName:
Description: Name of the IAM Policy to be created and attached to the IAM Role ; grants Cloudvisory read permissions for AWS asset discovery
Type: String
Default: cloudvisory-read-permissions
CloudvisoryWritePolicyEnable:
Description: Control the optional creation of the policy named by the 'CloudvisoryWritePolicyName' parameter
Type: String
Default: "enable"
CloudvisoryWritePolicyName:
Description: Name of the IAM Policy to be created and attached to the IAM Role ; grants Cloudvisory write permissions for compliance remediation and policy enforcement
Type: String
Default: cloudvisory-write-permissions
Conditions:
CreateFlowLogsPolicy: !Equals [!Ref CloudvisoryFlowLogsPolicyEnable, "enable"]
CreateWritePolicy: !Equals [!Ref CloudvisoryWritePolicyEnable, "enable"]
Resources:
CVReadPolicy:
Type: AWS::IAM::Policy
DependsOn: CVServiceRole
Properties:
PolicyName: !Sub "${CloudvisoryReadPolicyName}"
PolicyDocument:
Statement:
- Action:
- ce:GetCostAndUsage
- ce:GetCostForecast
- cloudtrail:LookupEvents
- cognito-identity:DescribeIdentityPool
- cognito-identity:ListIdentities
- cognito-idp:DescribeUserPool
- cognito-idp:ListGroups
- cognito-idp:ListUsers
- dynamodb:DescribeBackup
- ecr:ListTagsForResource
- eks:DescribeUpdate
- eks:ListUpdates
- elasticfilesystem:DescribeTags
- iot:GetV2LoggingOptions
- lambda:GetFunction
- logs:FilterLogEvents
- logs:GetLogEvents
- s3:ListBucket
- ses:GetEmailIdentity
- ses:ListEmailIdentities
- sns:GetSubscriptionAttributes
- sns:ListSubscriptions
- sns:ListTagsForResource
- sqs:GetQueueUrl
- ssm:GetParametersByPath
Effect: Allow
Resource: "*"
Roles:
- Ref: CVServiceRole
CVFlowLogsPolicy:
Type: AWS::IAM::Policy
Condition: CreateFlowLogsPolicy
DependsOn:
- CVServiceRole
- CVFlowS3Bucket
Properties:
PolicyName: !Sub "${CloudvisoryFlowLogsPolicyName}"
PolicyDocument:
Statement:
- Action:
- ec2:CreateFlowLogs
- ec2:DeleteFlowLogs
- sqs:CreateQueue
- sqs:SetQueueAttributes
- sqs:GetQueueUrl
- sqs:ReceiveMessage
- sqs:DeleteMessage
- logs:CreateLogDelivery
- logs:PutRetentionPolicy
Effect: Allow
Resource: "*"
- Action:
- s3:PutBucketNotification
- s3:PutBucketPolicy
Effect: Allow
Resource: !GetAtt CVFlowS3Bucket.Arn
Roles:
- Ref: CVServiceRole
CVCloudTrailPolicy:
Type: AWS::IAM::Policy
DependsOn:
- CVServiceRole
- CVTrailS3Bucket
Properties:
PolicyName: !Sub "${CloudvisoryCloudtrailPolicyName}"
PolicyDocument:
Statement:
- Action:
- sqs:CreateQueue
- sqs:SetQueueAttributes
- sqs:GetQueueUrl
- sqs:ReceiveMessage
- sqs:DeleteMessage
Effect: Allow
Resource: "*"
- Action:
- s3:PutBucketNotification
- s3:PutBucketPolicy
Effect: Allow
Resource: !GetAtt CVTrailS3Bucket.Arn
Roles:
- Ref: CVServiceRoleCVWritePolicy:
Type: AWS::IAM::Policy
Condition: CreateWritePolicy
DependsOn: CVServiceRole
Properties:
PolicyName: !Sub "${CloudvisoryWritePolicyName}"
PolicyDocument:
Statement:
- Action:
- cloudtrail:StartLogging
- cloudtrail:UpdateTrail
- ec2:AuthorizeSecurityGroupEgress
- ec2:AuthorizeSecurityGroupIngress
- ec2:CreateFlowLogs
- ec2:CreateSecurityGroup
- ec2:CreateTags
- ec2:DeleteFlowLogs
- ec2:DeleteSecurityGroup
- ec2:ModifyInstanceAttribute
- ec2:ModifyNetworkInterfaceAttribute
- ec2:RevokeSecurityGroupEgress
- ec2:RevokeSecurityGroupIngress
- ecr:PutImageScanningConfiguration
- iam:DeleteAccessKey
- iam:DeleteLoginProfile
- iam:DetachGroupPolicy
- iam:DetachRolePolicy
- iam:DetachUserPolicy
- iam:PassRole
- iam:UpdateAccessKey
- iam:UpdateAccountPasswordPolicy
- kms:EnableKeyRotation
- logs:CreateLogGroup
- logs:CreateLogStream
- logs:PutLogEvents
- logs:PutRetentionPolicy
- rds:ModifyDBInstance
- s3:PutBucketAcl
- s3:PutBucketPublicAccessBlock
- s3:PutBucketTagging
- s3:PutBucketVersioning
- s3:PutEncryptionConfiguration
Effect: Allow
Resource: "*"
Roles:
- Ref: CVServiceRole
CVServiceRole:
Type: AWS::IAM::Role
Properties:
AssumeRolePolicyDocument:
Statement:
- Action: sts:AssumeRole
Condition:
StringEquals:
sts:ExternalId: !Sub "${ExternalSecretId}"
Effect: Allow
Principal:
AWS: !Sub "${ExternalAccountId}"
Description: IAM Role used by Cloudvisory service for asset discovery, compliance monitoring and (optional) policy enforcement
ManagedPolicyArns:
- arn:aws:iam::aws:policy/SecurityAudit
Path: /
RoleName: !Sub "${CloudvisoryRoleName}"
CVFlowS3Bucket:
Type: AWS::S3::Bucket
Properties:
BucketEncryption:
ServerSideEncryptionConfiguration:
- ServerSideEncryptionByDefault:
SSEAlgorithm: AES256
BucketName: !Join [ "-", [ !Sub "${CloudvisoryFlowS3BucketName}", !Ref "AWS::AccountId" ] ]
PublicAccessBlockConfiguration:
BlockPublicAcls: true
BlockPublicPolicy: true
IgnorePublicAcls: true
RestrictPublicBuckets: true
CVFlowS3BucketPolicy:
Type: AWS::S3::BucketPolicy
DependsOn:
- CVFlowS3Bucket
- CVServiceRole
Properties:
Bucket: !Ref CVFlowS3Bucket
PolicyDocument:
Version: '2012-10-17'
Statement:
- Effect: Allow
Principal:
Service: 'delivery.logs.amazonaws.com'
Action: s3:PutObject
Resource: !Join [ '', [ !GetAtt CVFlowS3Bucket.Arn, "/AWSLogs/*" ] ]
- Effect: Allow
Principal:
Service: 'delivery.logs.amazonaws.com'
Action: s3:GetBucketAcl
Resource: !GetAtt CVFlowS3Bucket.Arn
- Effect: Allow
Principal:
AWS: !GetAtt CVServiceRole.Arn
Action: s3:GetObject
Resource: !Join [ '', [ !GetAtt CVFlowS3Bucket.Arn, "/AWSLogs/", !Ref "AWS::AccountId", "/*" ] ]
- Effect: Allow
Principal:
AWS: !GetAtt CVServiceRole.Arn
Action: s3:DeleteObject
Resource: !Join [ '', [ !GetAtt CVFlowS3Bucket.Arn, "/AWSLogs/", !Ref "AWS::AccountId", "/*" ] ]
CVTrailsS3Bucket:
Type: AWS::S3::Bucket
Properties:
BucketEncryption:
ServerSideEncryptionConfiguration:
- ServerSideEncryptionByDefault:
SSEAlgorithm: AES256
BucketName: !Join [ "-", [ !Sub "${CloudvisoryTrailsS3BucketName}", !Ref "AWS::AccountId" ] ]
PublicAccessBlockConfiguration:
BlockPublicAcls: true
BlockPublicPolicy: true
IgnorePublicAcls: true
RestrictPublicBuckets: true
CVTrailsS3BucketPolicy:
Type: 'AWS::S3::BucketPolicy'
DependsOn:
- CVTrailsS3Bucket
- CVServiceRole
Properties:
Bucket: !Ref CVTrailsS3Bucket
PolicyDocument:
Version: '2012-10-17'
Statement:
- Effect: Allow
Principal:
Service: cloudtrail.amazonaws.com
Action: s3:GetBucketAcl
Resource: !GetAtt CVTrailsS3Bucket.Arn
- Effect: Allow
Principal:
Service: cloudtrail.amazonaws.com
Action: s3:PutObject
Resource: !Join [ "", [ !GetAtt CVTrailsS3Bucket.Arn, "/AWSLogs/", !Ref "AWS::AccountId", "/*" ] ]
Condition:
StringEquals:
s3:x-amz-acl: bucket-owner-full-control
- Effect: Allow
Principal:
AWS: !GetAtt CVServiceRole.Arn
Action: s3:GetObject
Resource: !Join [ "", [ !GetAtt CVTrailsS3Bucket.Arn, "/AWSLogs/", !Ref "AWS::AccountId", "/*" ] ]
- Effect: Allow
Principal:
AWS: !GetAtt CVServiceRole.Arn
Action: s3:DeleteObject
Resource: !Join [ "", [ !GetAtt CVTrailsS3Bucket.Arn, "/AWSLogs/", !Ref "AWS::AccountId", "/*" ] ]
CVTrail:
Type: AWS::CloudTrail::Trail
DependsOn:
- CVTrailsS3Bucket
- CVTrailsS3BucketPolicy
Properties:
IsLogging: true
IsMultiRegionTrail: true
IncludeGlobalServiceEvents: true
EnableLogFileValidation: true
S3BucketName: !Ref CVTrailsS3Bucket
TrailName: !Join [ "-", [ !Sub "${CloudvisoryTrailName}", !Ref "AWS::AccountId" ] ]
Outputs:
CVFlowBucketName:
Description: Name of the S3 Bucket created for VPC flow log discovery by FireEye Cloudvisory
Value: !Ref CVFlowS3Bucket
CVTrailBucketName:
Description: Name of the S3 Bucket created for Cloudtrail events by FireEye Cloudvisory
Value: !Ref CVTrailsS3Bucket
CVExternalId:
Description: Shared secret used to validate the trust relationship between the monitored and monitoring AWS accounts
Value: !Sub "${ExternalAccountId}"
CVServiceRoleArn:
Description: ARN of the IAM Role created for use by Cloudvisory service
Value: !GetAtt CVServiceRole.ArnLog into https://console.aws.amazon.com.
Under the Management & Governance tab, select CloudFormation.
Click Create Stack.
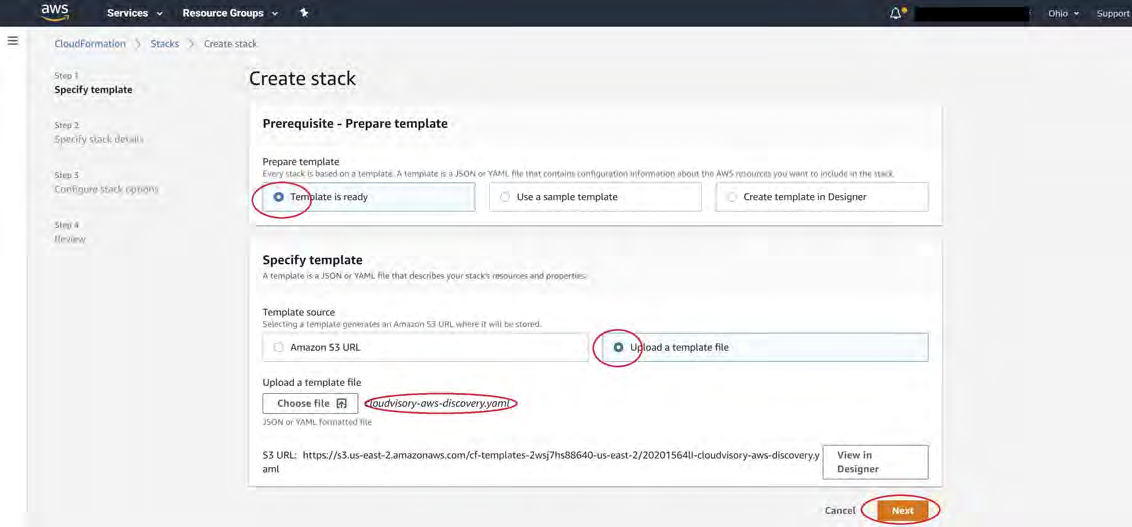
Select 'Template is ready.'
Select 'Upload a template file.'
Click 'Change file' to upload the file.
Click Next.
Copyright © 2021 Cloudvisory Documentation, FireEye Inc.
Create stack
Prerequisite - Prepare template
Prepare template
Template is ready
Use a sample template
Create template in Designer
Specify template
Template source
Amazon S3 URL
Upload a template file
Upload a template file: cloudvisory-aws-discovery.yaml
Specify stack details
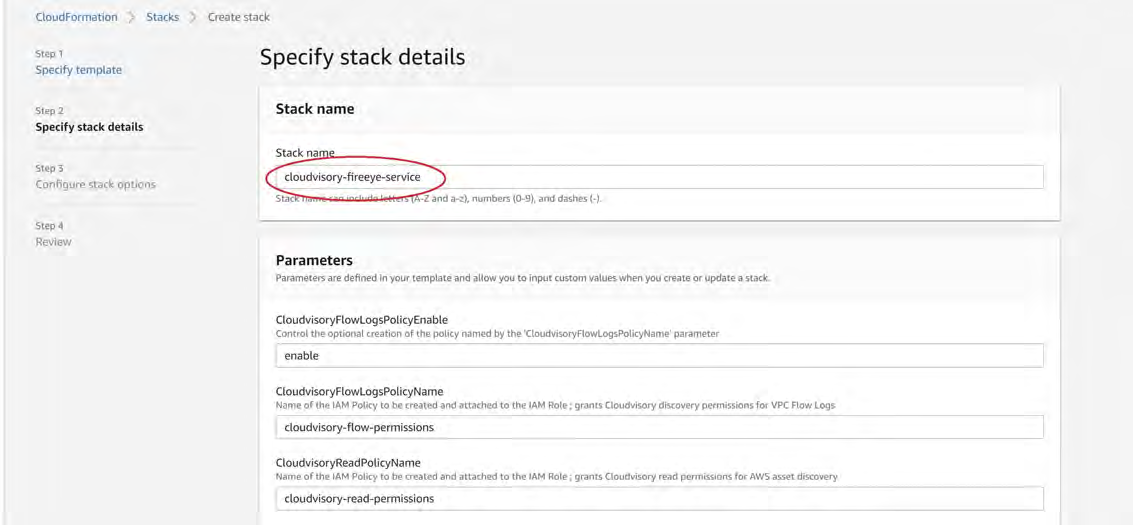
Enter the stack name.
Review the 'CloudvisoryRoleName.'
Review the 'CloudvisoryS3BucketName'. Your account ID will be concatenated at the end.
Enter or review 'ExternalAccountId.'
Click Next.
Copyright © 2021 Cloudvisory Documentation, Fireeye Inc.
12
[IMAGE PLACEHOLDER: CloudFormation parameters screenshot showing fields and values. Visible labels and values: CloudvisoryReadPolicyName — cloudvisory-read-permissions; CloudvisoryRoleName — cloudvisory-fireeye-service (circled); CloudvisoryS3BucketName — cloudvisory-flows (circled); CloudvisoryWritePolicyEnable — enable; CloudvisoryWritePolicyName — cloudvisory-write-permissions; ExternalAccountId — [redacted]; ExternalSecretId — Cloudv1s0ry; Footer buttons: Cancel, Previous, Next (Next circled).]
13. Click Next again.
[IMAGE PLACEHOLDER: CloudFormation Permissions and Advanced options screenshot. Visible text: Permissions — Choose an IAM role to explicitly define how CloudFormation can create, modify, or delete resources in the stack. If you don't choose a role, CloudFormation uses permissions based on your user credentials. Learn more; IAM role - optional — Choose the IAM role for CloudFormation to use for all operations performed on the stack. Dropdown labelled "IAM role name" with sample placeholder "Sample-role-name" and a Remove button; Advanced options heading with expandable sections: - Stack policy — Defines the resources that you want to protect from unintentional updates during a stack update. - Rollback configuration — Specify alarms for CloudFormation to monitor when creating and updating the stack. If the operation breaches an alarm threshold, CloudFormation rolls it back. Learn more - Notification options - Stack creation options Footer buttons: Cancel, Previous, Next (Next circled).]
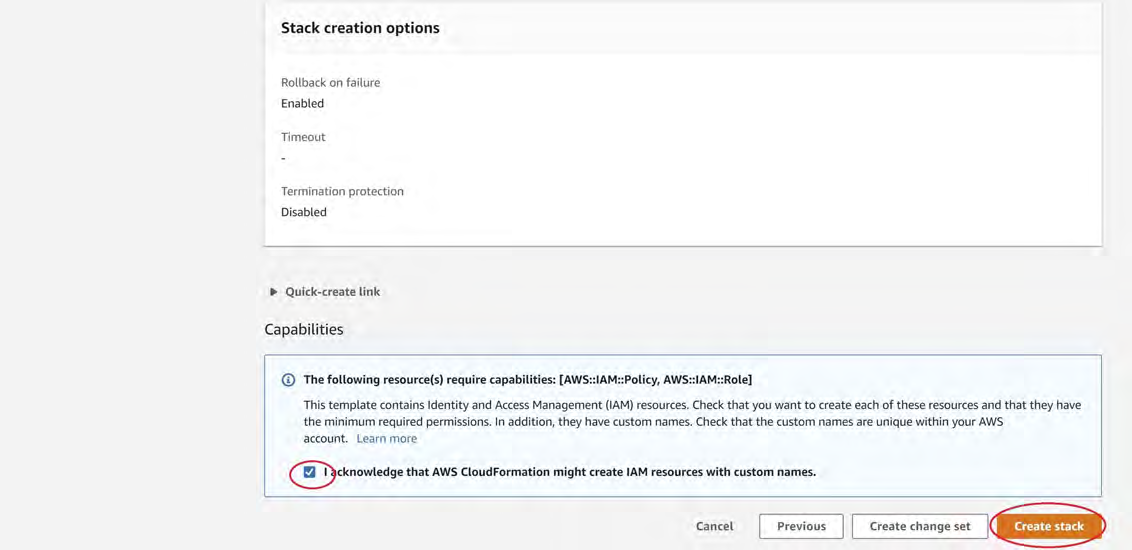
14. Click the checkbox to acknowlege and then click Create Stack.
Copyright © 2021 Cloudvisory Documentation, Fireeye Inc.
13
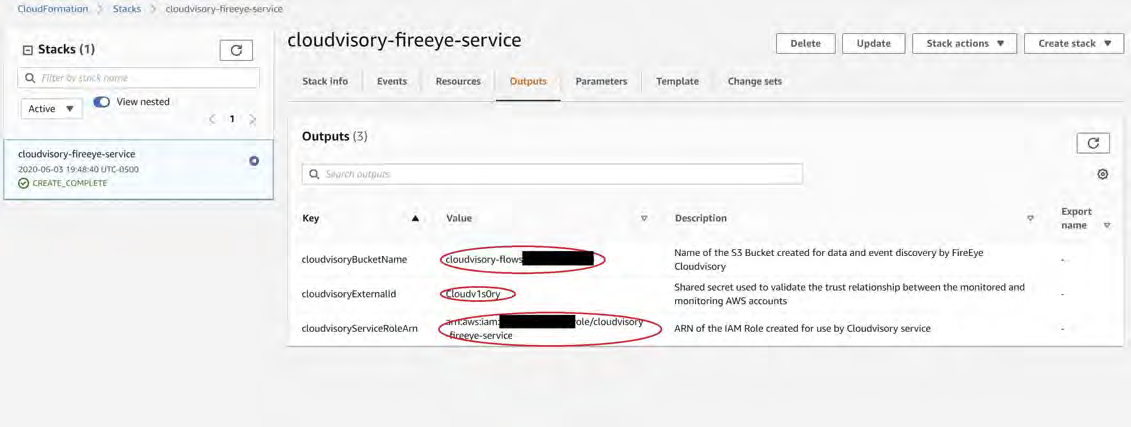
15. Copy these three output values for the Cloudvisory UI:
Configure Using the AWS Console
NOTE
Skip this section if you already run all steps in 'Configure using CloudFormation template'.
Get the externalID from AWS tab from Providers page under settings menu. Get externalID
Steps to configure the RoleARN:
Log into https://console.aws.amazon.com.
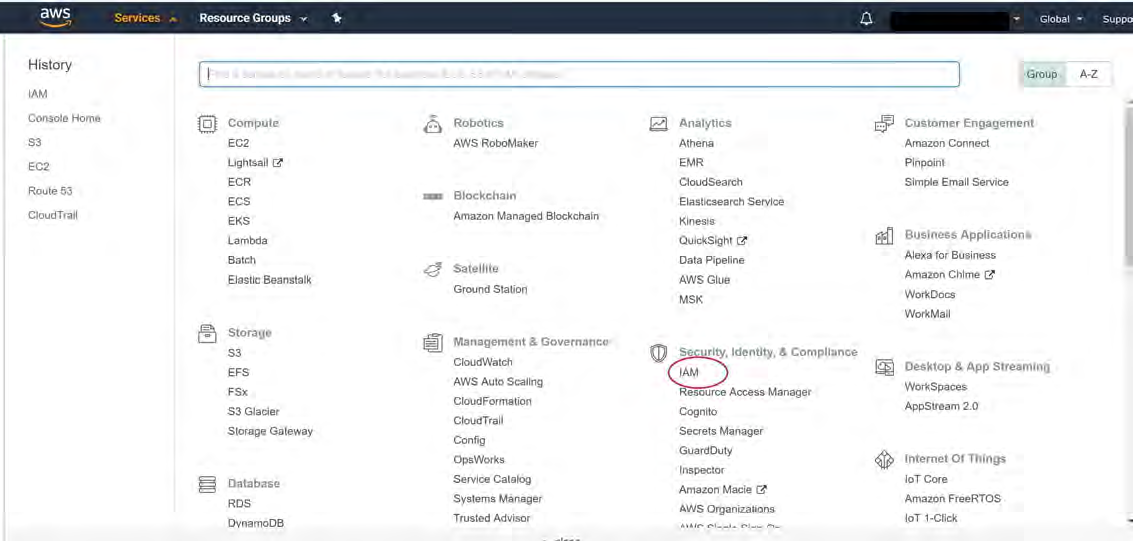
Under the Security, Identity & Compliance tab, select IAM.
Copyright © 2021 Cloudvisory Documentation, Fireeye Inc.
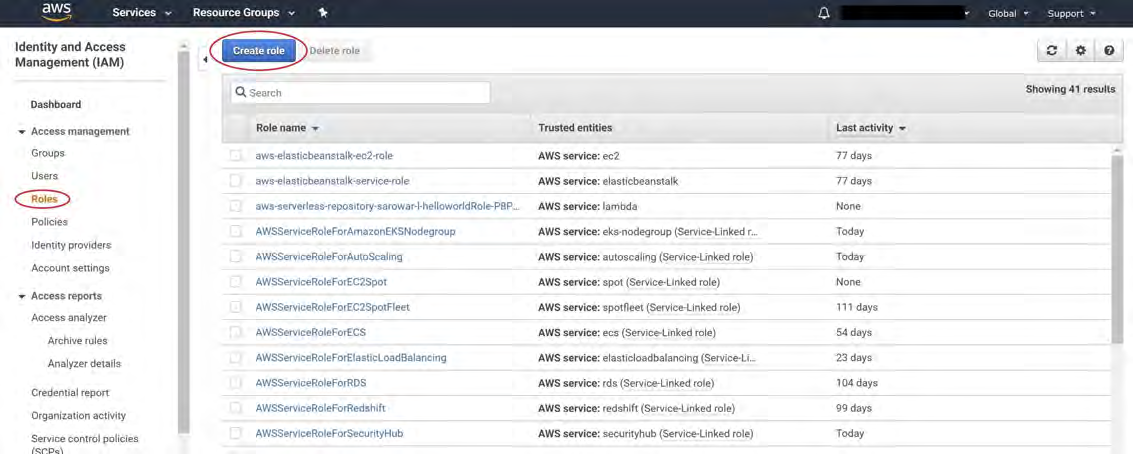
3. Click Roles and then click Create Role.
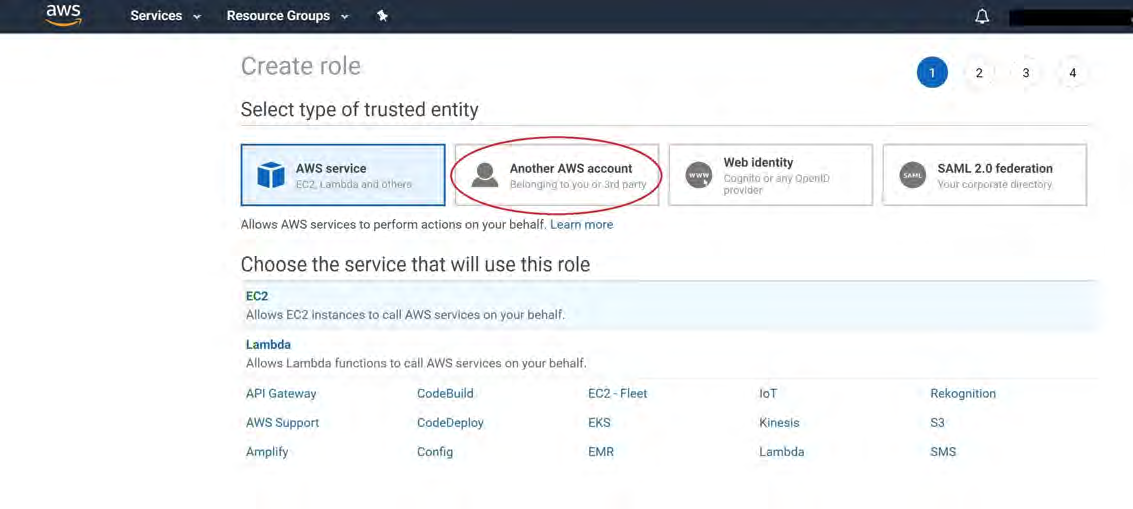
4. Select 'Another AWS account.'
5. Click Next.
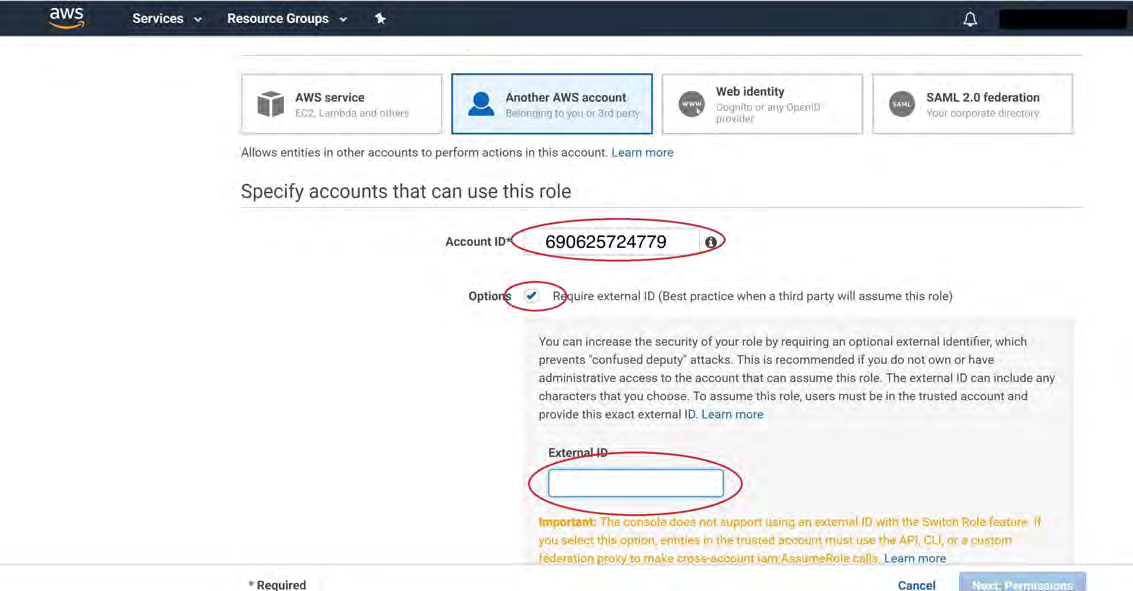
6. Enter your Account ID (provided by the Cloudvisory team, 690625724779).
7. Select the 'useBaseUrlId external ID' checkbox.
8. Enter the External ID. (Please read the note in the begining of this section for External ID)
Copyright © 2021 Cloudvisory Documentation, Fireeye Inc.
15
9. Click Next: Permissions.
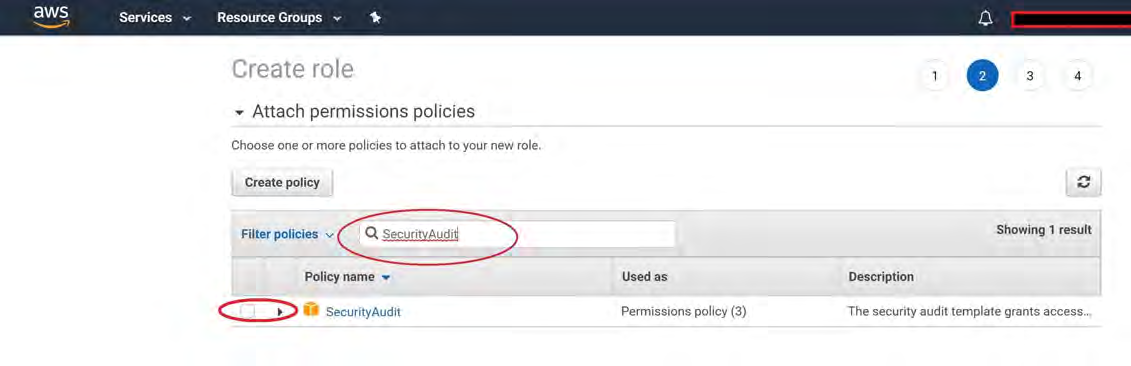
10. Enter SecurityAudit in Find Policies to find the standard AWS audit policies.
The SecurityAudit policy provides access rights to discover AWS assets and run Cloudvisory compliance checks against them, if you plan to run remediation of compliance check failures.
11. Select the SecurityAudit Policy checkbox.
12. Click Next: Tags.
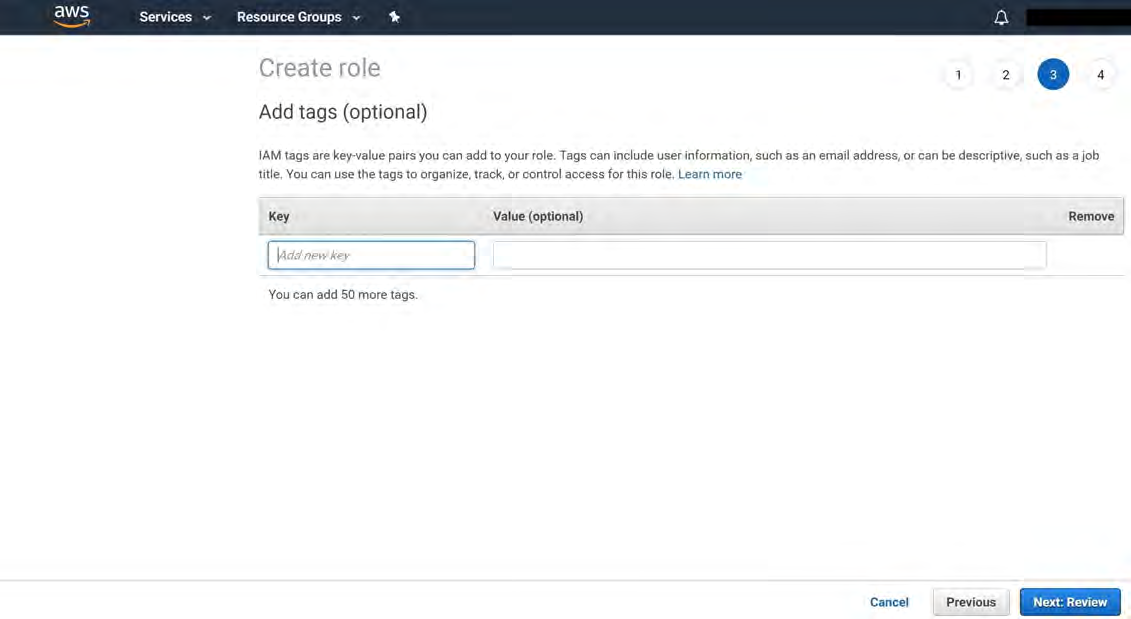
13. You can enter any tag/value (except the useBaseUrlId for Cloudvisory).
14. Click Next: Review.
Copyright © 2021 Cloudvisory Documentation, Fireeye Inc.
16
Create role
Add tags (optional)
IAM tags are key-value pairs you can add to your role. Tags can include user information, such as an email address, or can be descriptive, such as a job title. You can use the tags to organize, track, or control access for this role. Learn more
You can add 50 more tags.
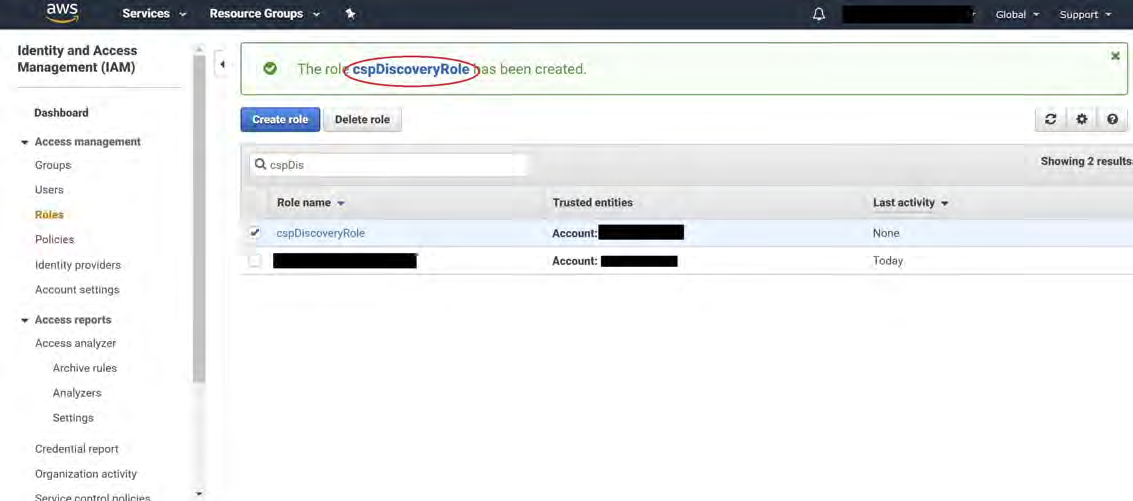
Enter a Role name, for example, cvDiscoveryRole.
Enter Role Description.
Click 'Create role.'
Click the newly created role name to open it.
19. Copy the Role ARN.
Copyright © 2021 Cloudvisory Documentation, Fireeye Inc.
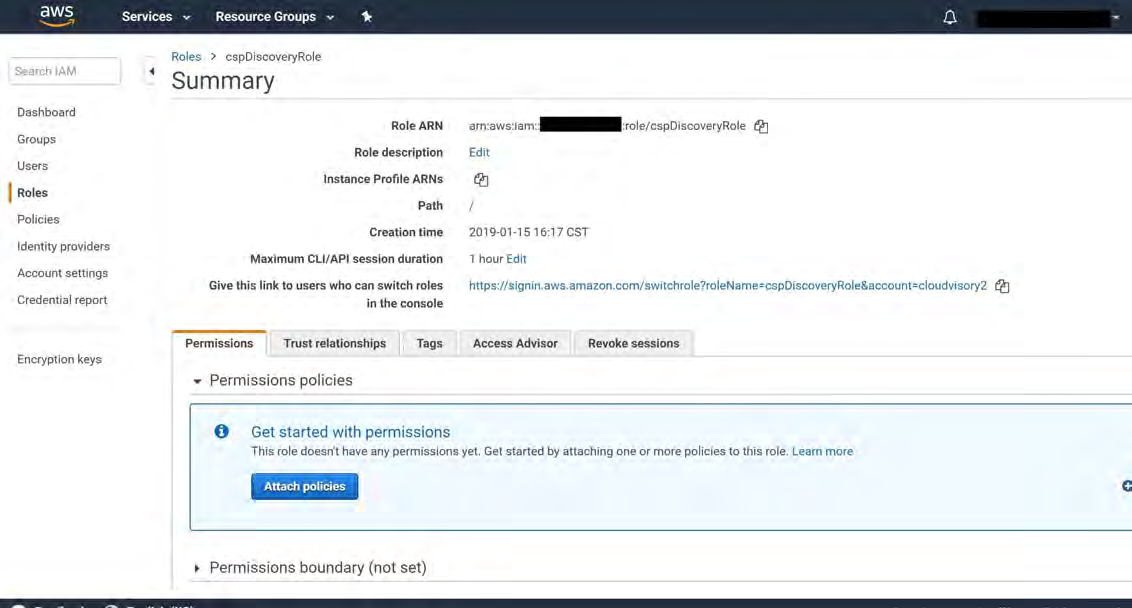
This Role ARN and External ID will be the useBaseUrl to enter in the Cloudvisory UI.
Permissions for asset discovery and compliance check:
Select the new role you created.
Create the inline policy
cvReadPermissionsby clicking Add Inline Policy. Use the following permissions:
cvReadPermissions
{
"Version": "2012-10-17",
"Statement": [
{
"Effect": "Allow",
"Action": [
"ce:GetCostAndUsage",
"ce:GetCostForecast",
"cloudtrail:LookupEvents",
"cognito-identity:DescribeIdentityPool",
"cognito-identity:ListIdentities",
"cognito-idp:DescribeUserPool",
"cognito-idp:ListGroups",
"cognito-idp:ListUsers",
"dynamodb:DescribeBackup",
"ecr:ListTagsForResource",
"eks:DescribeUpdate",
"eks:ListUpdates",
"elasticfilesystem:DescribeTags",
"iot:GetV2LoggingOptions",
"lambda:GetFunction",
"logs:FilterLogEvents",
"logs:GetLogEvents",
"s3:ListBucket",
"ses:GetIdentity",
"ses:ListEmailIdentities",
"sns:GetSubscriptionAttributes",
"sns:ListSubscriptions",
"sns:ListTagsForResource",
"sqs:GetQueueUrl",
"ssm:GetParametersByPath"
],
"Resource": [
"*"
]
}
]
}Permissions for micro segmentation, enforcement and compliance check remediation:
Select the new role you created.
Create the inline policy
cvWritePermissionsby clicking Add Inline Policy. Use the following permissions:
cvWritePermissions
{
"Version": "2012-10-17",
"Statement": [
{
"Effect": "Allow",
"Action": [
/* policy actions not fully visible in source image */
]
}
]
}Copyright © 2021 Cloudvisory Documentation, Fireeye Inc.
"Action": [
"cloudtrail:StartLogging",
"cloudtrail:UpdateTrail",
"ec2:AuthorizeSecurityGroupEgress",
"ec2:AuthorizeSecurityGroupIngress",
"ec2:CreateFlowLogs",
"ec2:CreateSecurityGroup",
"ec2:CreateTags",
"ec2:DeleteFlowLogs",
"ec2:DeleteSecurityGroup",
"ec2:ModifyInstanceAttribute",
"ec2:ModifyNetworkInterfaceAttribute",
"ec2:RevokeSecurityGroupEgress",
"ec2:RevokeSecurityGroupIngress",
"ecr:PutImageScanningConfiguration",
"iam:DeleteAccessKey",
"iam:DeleteLoginProfile",
"iam:DetachGroupPolicy",
"iam:DetachRolePolicy",
"iam:DetachUserPolicy",
"iam:PassRole",
"iam:UpdateAccessKey",
"iam:UpdateAccountPasswordPolicy",
"kms:EnableKeyRotation",
"logs:CreateLogGroup",
"logs:CreateLogStream",
"logs:PutLogEvents",
"logs:PutRetentionPolicy",
"rds:ModifyDBInstance",
"s3:PutBucketAcl",
"s3:PutBucketPublicAccessBlock",
"s3:PutBucketTagging",
"s3:PutBucketVersioning",
"s3:PutEncryptionConfiguration"
],
"Resource": [
"*"
]
}
]
}Permissions to collect and visualize VPC flows:
Select the new role you created.
Create the inline policy
cvVpcFlowPermissionsby clicking Add Inline Policy. Use the following permissions:
cvVpcFlowPermissions
{
"Version": "2012-10-17",
"Statement": [
{
"Action": [
"ec2:CreateFlowLogs",
"ec2:DeleteFlowLogs",
"sqs:CreateQueue",
"sqs:SetQueueAttributes",
"sqs:GetQueueUrl",
"sqs:ReceiveMessage",
"sqs:DeleteMessage",
"logs:CreateLogDelivery",
"logs:PutRetentionPolicy"
],
"Effect": "Allow",
"Resource": "*"
},
{
"Action": [
"s3:PutBucketNotification",
"s3:PutBucketPolicy"
],
"Effect": "Allow",
"Resource": "Permissions to collect cloud-trail events:
Select the new role you created.
Create the inline policy
cvCloudtrailPermissionsby clicking Add Inline Policy. Use the following permissions:
cvCloudtrailPermissions
{
"Version": "2012-10-17",
"Statement": [
{
"Action": [
"sqs:CreateQueue",
"sqs:SetQueueAttributes",
"sqs:GetQueueUrl",
"sqs:ReceiveMessage",
"sqs:DeleteMessage"
],
"Effect": "Allow",
"Resource": "*"
}
/* additional statements truncated in image */
]
}Copyright © 2021 Cloudvisory Documentation, Fireeye Inc.
19
{
},
{
"Action": [
"s3:PutBucketNotification",
"s3:PutBucketPolicy"
],
"Effect": "Allow",
"Resource": "<cloudtrail-bucket-arn>"
]
}Create the S3 bucket for VPC flows
NOTE
Skip this section if you already run all steps in 'Configure using CloudFormation template'.
Ensure that the policy 'cvVpcFlowPermissions' mentioned above has been created for the role.
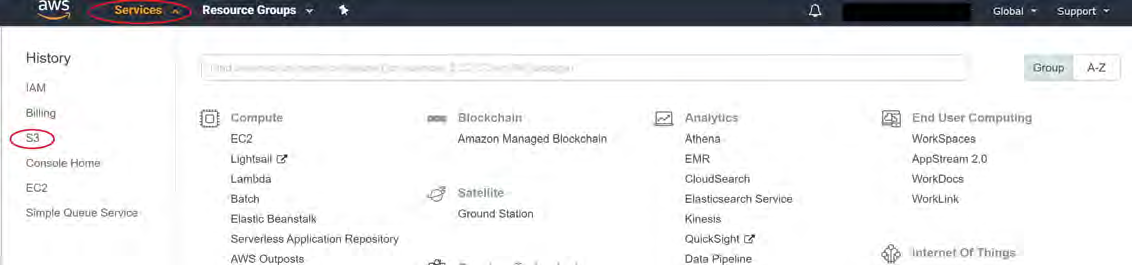
Log into https://console.aws.amazon.com and navigate to the S3 service using the Services section.
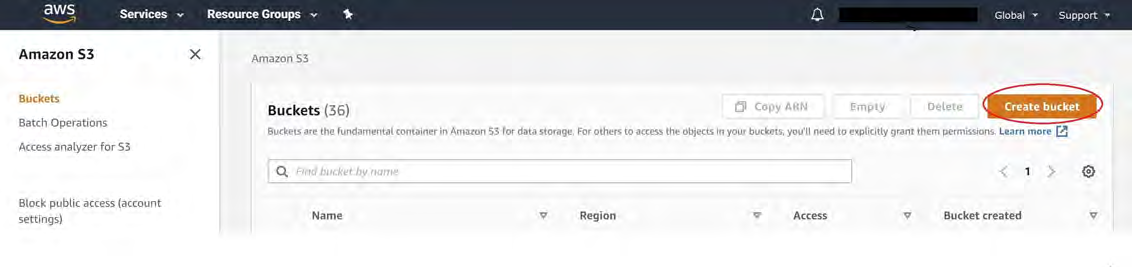
On the Amazon S3 page, click 'Create bucket.'
On the Create Bucket page, enter a name for the S3 bucket in the Bucket Name field and select a region.
The bucket name must be unique in AWS in all accounts. You can use your aws account number with the 'csp' prefix. For example:
csp-[account number of your aws account]-vpcflows To get the account number, click the drop down in the top right corner and select My Account.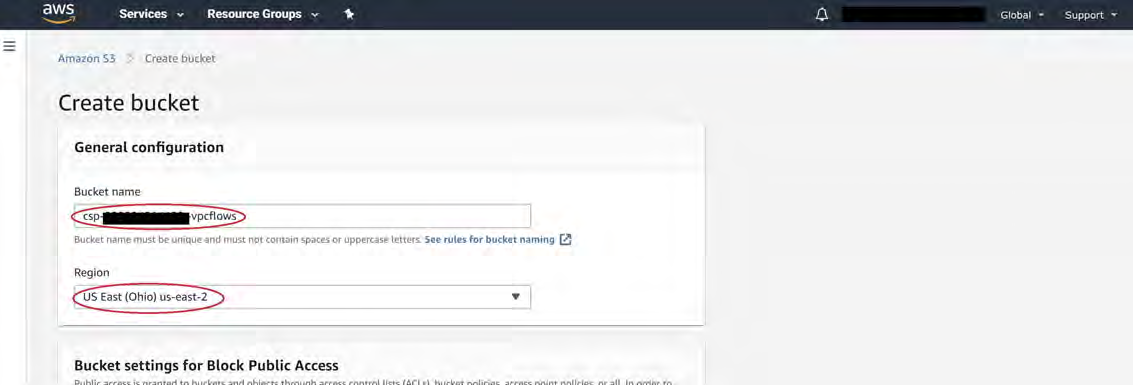
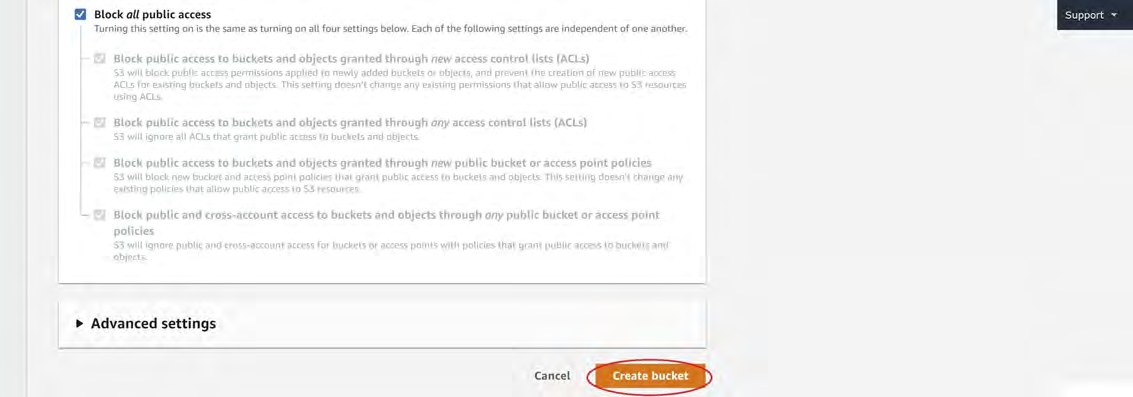
Ensure that the 'Block all public access' is selected.
Click Create Bucket to finish creating the bucket.
Copyright © 2021 Cloudvisory Documentation, Fireeye Inc.
20
Create the CloudTrail trail
NOTE
Skip this section if you already run all steps in 'Configure using CloudFormation template'.
Ensure that the policy 'cvCloudtrailPermissions' mentioned above has been created for the role.
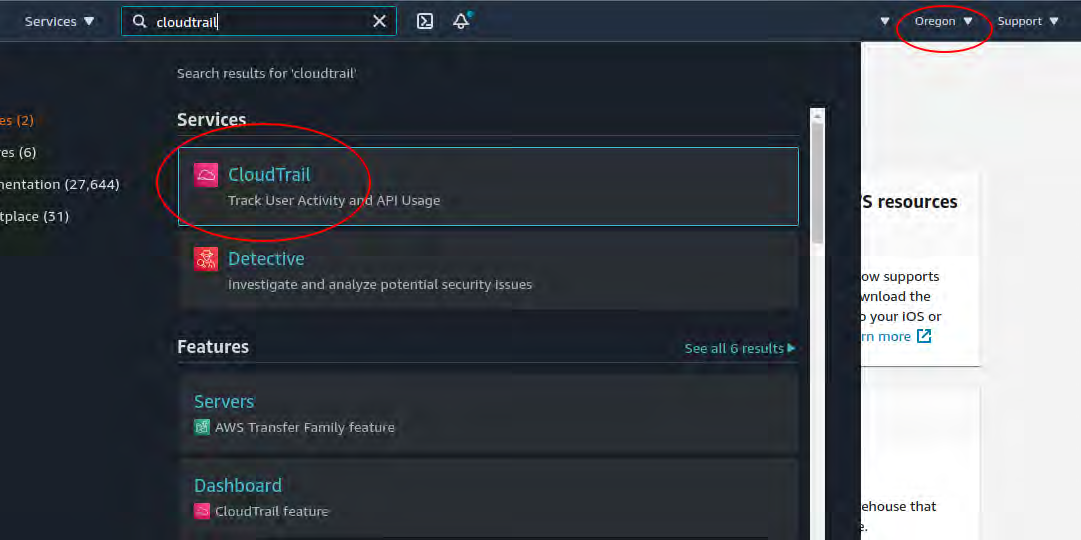
Log into https://console.aws.amazon.com and navigate to the CloudTrail service using the Services section and select a desired region.
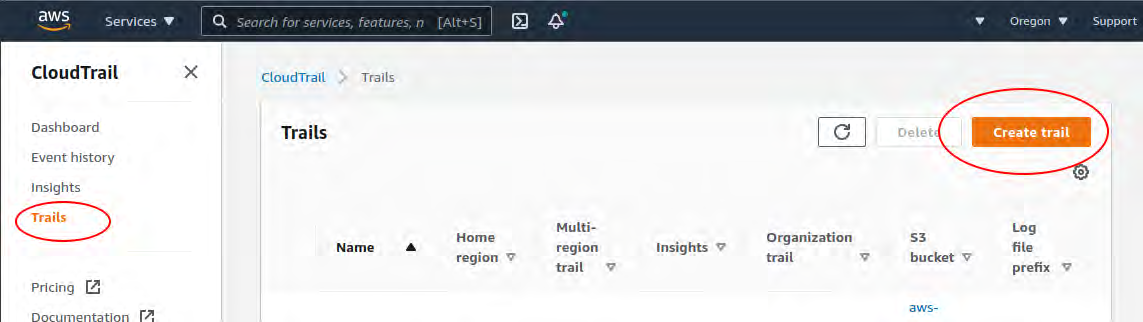
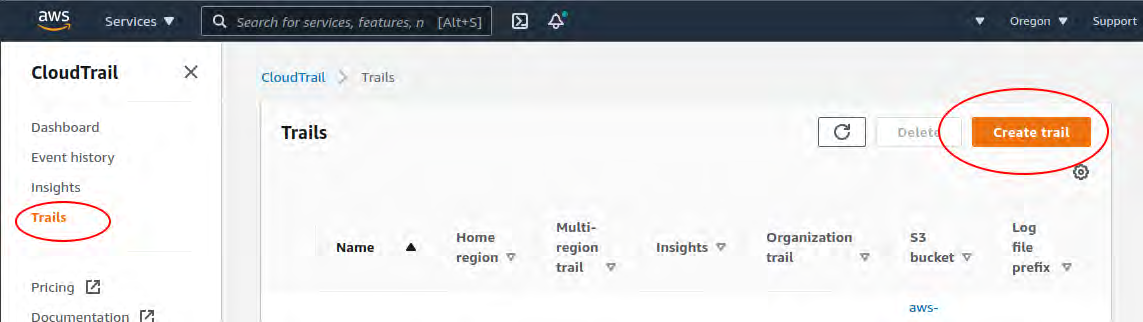
On the CloudTrail page, click Trails from the left-hand navigation and click 'Create trail.'
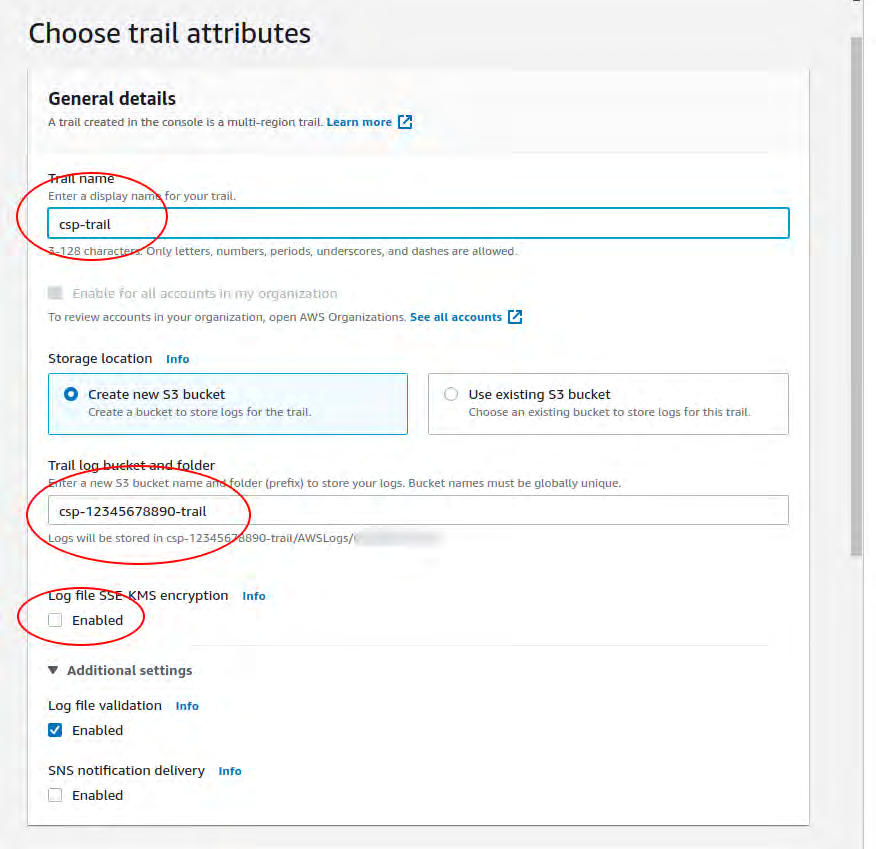
On the 'Choose trail attributes' page:
Enter a name for the trail in the Trail Name field
Specify a unique bucket name. The bucket name must be unique in AWS in all accounts. You can use your aws account number with the 'csp' prefix. For example:
Copyright © 2021 Cloudvisory Documentation, Fireeye Inc.
csp-[account number of your aws account]-trail To get the account number, click the drop down in the top right corner and select My Account.
Uncheck the 'Enabled' checkbox under 'Log file SSE-KMS encryption'
Scroll down to the end and click on Next > Next > 'Create trail' buttons, to save the changes and finish.
Permissions for discovering kubernetes resources in AWS EKS clusters
This section is optional if you don't have AWS EKS or if you want to do it later.
Cloudvisory discovers AWS EKS Clusters and also all assets from the cluster. The following additional permissions need to be added for each EKS cluster. You can use the aws cli (1.6 or later) and kubectl.
Check whether your aws credential has access to the EKS cluster. Replace
cluster namewith your cluster's name.aws eks describe-cluster --name <cluster name>If you don't have access, update your kubeconfig file. Replace
cluster region nameandcluster namewith your cluster's name and region.aws eks --region <cluster region name> update-kubeconfig --name <cluster name>
CAUTION
Your aws credential must have permission to access EKS and your aws user must be included in the aws-auth config map. (https://docs.aws.amazon.com/eks/latest/userguide/add-user-role.html).
Copyright © 2021 Cloudvisory Documentation, Fireeye Inc.
22
If not, please contact your AWS EKS cluster admin for help.
3. Add the ARN for cspDiscoveryRole to the aws-auth config map:
kubectl edit -n kube-system configmap/aws-auth4. Add the following lines under mapRoles and update the cspDiscoveryRole ARN:
- rolearn: <ARN for cspDiscoveryRole>
username: Cloudvisoryuser
groups:
- system:masters5. Save the change.
6. Confirm the new permissions:
kubectl describe configmap -n kube-system aws-authOnboarding an AWS Account in Cloudvisory
Log into the Cloudvisory UI.
Click Admin Settings > Providers.
Click AWS on left panel
Click Add Account.
Account information
Enter
Account Name.Enter Account Description (optional).
Enter
RoleARN.Enter
ExternalID.Enter S3 Bucket name (optional).
Enter AWS S3 bucket for CloudTrail (optional).
Choose AWS Cloud Type (Default, US Gov or China).
Click Next.
Configure Compliance checks
Select an option:
Auto-Configure Compliance Checks: If you select this option, Cloudvisory will create a default compliance group with this provider account and will enable default compliance checks.
Will Configure Manually : If you select this option, you must configure the compliance group and add checks manually.
[IMAGE PLACEHOLDER: Lightbulb icon in green tip box]
TIP
use Auto-Configure Compliance Checks (the default selection) and see how Cloudvisory configures the compliance group and checks after adding the provider account.
2. Click Next.
3. Review and click Submit.
Add Account Information
1. Account Information
2. Configure Compliance Checks
3. Review and Submit
Account Name
65 characters left
Access Parameters
RoleARN
CloudV1s0ry
S3 Bucket Name
Cloud-trail S3 Bucket Name
Default
US Gov
China
Account Description
120 characters left
Define Scope (Optional)
No Scopes Defined
Copyright © 2021 Cloudvisory Documentation, Fireeye Inc.
24
AWS (Deployed outside AWS Cloud)
Step-by-step guide
Cloudvisory requires following information in order to onboard an AWS account:
Access Key: The Access key ID of the AWS user, which provides permission to access the aws account from CSP.
Secret Key: The Secret access key of the AWS user.
S3 Bucket for Flow: The bucket where the network flows will be collected.
S3 Bucket for Cloudvisory: The bucket where the clou-dtrail events will be collected.
Configure the Access Key and Secret Key
Log into https://console.aws.amazon.com.
Under the Security, Identity & Compliance tab, select IAM.
[IMAGE PLACEHOLDER: A screenshot of the AWS Management Console services page showing many service categories; the 'IAM' entry is circled under the Security, Identity & Compliance section.]
Click Users.
Click Add User.
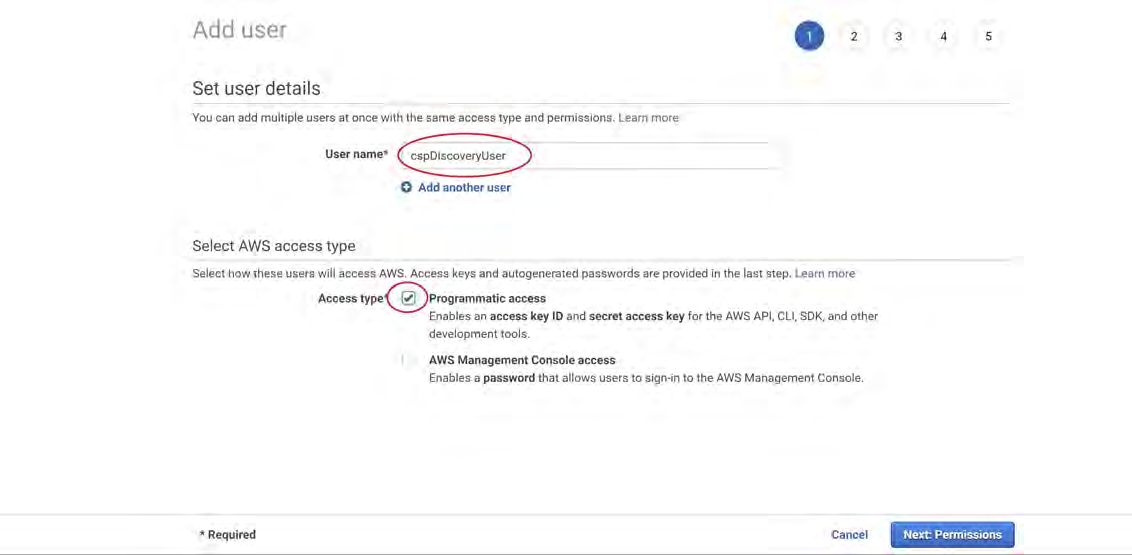
Enter User name (for example, cvDiscoveryUser).
Select the 'Programmatic access' checkbox.
Click Next:Permissions.
Select 'Attach existing policies directly.'
Enter 'SecurityAudit' in 'Filter policies'.
Select 'SecurityAudit'.
Copyright © 2021 Cloudvisory Documentation, Fireeye Inc.
25
11. Click Next:Tags.
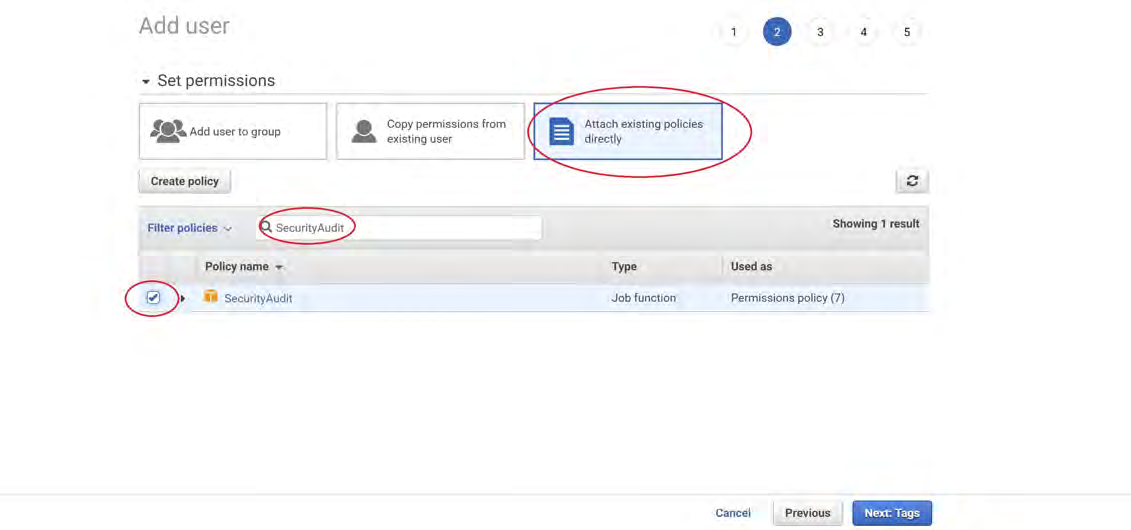
12. Add Tag is not required. Click Next:Review.
13. Click Create User.
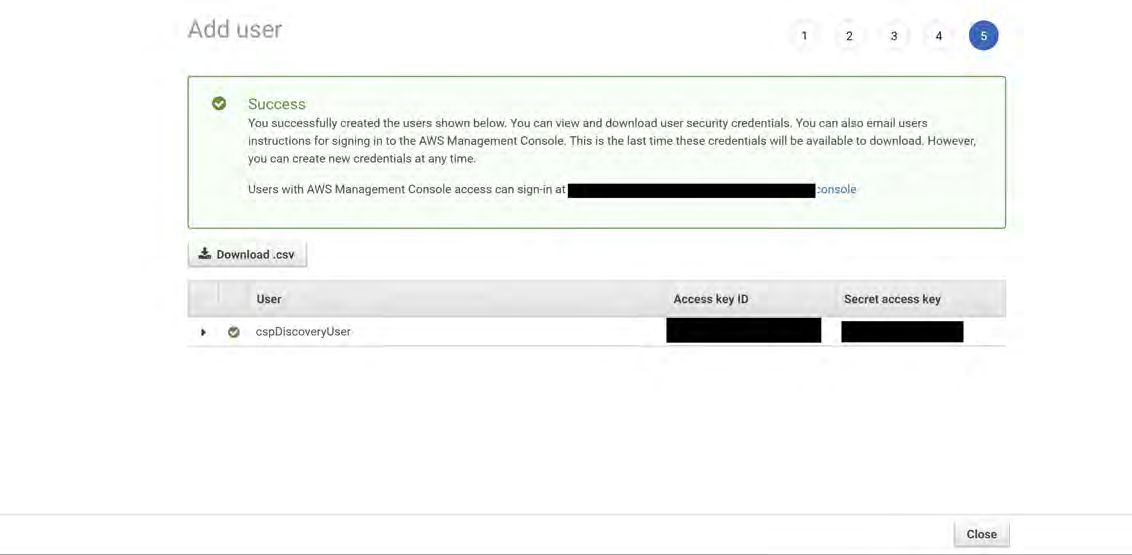
14. Copy the Access Key ID and Secret Access Key. These two values will be required in the Cloudvisory UI.
15. Click Close.
Permissions for asset discovery and compliance check:
Select the new user you created (example: cvDiscoveryUser).
Create the inline policy cvReadPermissions by clicking Add Inline Policy. Use the following permissions:
cvReadPermissions
{
"Version": "2012-10-17",
"Statement": [
{
"Effect": "Allow",
"Action": [
"ce:GetCostAndUsage",
"ce:GetCostForecast",
"cloudtrail:LookupEvents",
"cognito-identity:DescribeIdentityPool",
"cognito-identity:ListIdentities",
"cognito-idp:DescribeUserPool",
"cognito-idp:ListGroups",
"cognito-idp:ListUsers",
"dynamodb:DescribeBackup",
"ecr:ListTagsForResource",
"eks:DescribeUpdate"Copyright © 2021 Cloudvisory Documentation, Fireeye Inc.
{
"eks:ListUpdates",
"elasticfilesystem:DescribeTags",
"iot:GetV2LoggingOptions",
"lambda:GetFunction",
"logs:FilterLogEvents",
"logs:GetLogEvents",
"s3:ListBucket",
"ses:GetEmailIdentity",
"ses:ListEmailIdentities",
"sns:GetSubscriptionAttributes",
"sns:ListSubscriptions",
"sns:ListTagsForResource",
"sqs:GetQueueUrl",
"ssm:GetParametersByPath"
],
"Resource": [
"*"
]
}
]Permissions for micro segmentation, enforcement and compliance check remediation:
Select the new user you created.
Create the inline policy cvWritePermissions by clicking Add Inline Policy. Use the following permissions:
cvWritePermissions
{
"Version": "2012-10-17",
"Statement": [
{
"Effect": "Allow",
"Action": [
"cloudtrail:StartLogging",
"cloudtrail:UpdateTrail",
"ec2:AuthorizeSecurityGroupEgress",
"ec2:AuthorizeSecurityGroupIngress",
"ec2:CreateFlowLogs",
"ec2:CreateSecurityGroup",
"ec2:CreateTags",
"ec2:DeleteFlowLogs",
"ec2:DeleteSecurityGroup",
"ec2:ModifyInstanceAttribute",
"ec2:ModifyNetworkInterfaceAttribute",
"ec2:RevokeSecurityGroupEgress",
"ec2:RevokeSecurityGroupIngress",
"ecr:PutImageScanningConfiguration",
"iam:DeleteAccessKey",
"iam:DeleteLoginProfile",
"iam:DetachGroupPolicy",
"iam:DetachRolePolicy",
"iam:DetachUserPolicy",
"iam:PassRole",
"iam:UpdateAccessKey",
"iam:UpdateAccountPasswordPolicy",
"kms:EnableKeyRotation",
"logs:CreateLogGroup",
"logs:CreateLogStream",
"logs:PutLogEvents",
"logs:PutRetentionPolicy",
"rds:ModifyDBInstance",
"s3:PutBucketAcl",
"s3:PutBucketPublicAccessBlock",
"s3:PutBucketTagging",
"s3:PutBucketVersioning",
"s3:PutEncryptionConfiguration"
],
"Resource": [
"*"
]
}
]
}Permissions to collect and visualize VPC flows:
Select the new user you created.
Create the inline policy cvVpcFlowPermissions by clicking Add Inline Policy. Use the following permissions:
cvVpcFlowPermissions
{
"Version": "2012-10-17",
"Statement": [
{
"Action": [
"ec2:CreateFlowLogs",
"ec2:DeleteFlowLogs",
"sqs:CreateQueue",
"sqs:SetQueueAttributes",
"sqs:GetQueueUrl",
"sqs:ReceiveMessage",
"sqs:DeleteMessage",
"logs:CreateLogDelivery",
"logs:PutRetentionPolicy"
]
}
]
}Copyright © 2021 Cloudvisory Documentation, Fireeye Inc.
27
Permissions to collect cloud-trail events:
Select the new user you created.
Create the inline policy
cvCloudtrailPermissionsby clicking Add Inline Policy. Use the following permissions:
cvCloudtrailPermissions
{
"Version": "2012-10-17",
"Statement": [
{
"Action": [
"sqs:CreateQueue",
"sqs:SetQueueAttributes",
"sqs:GetQueueUrl",
"sqs:ReceiveMessage",
"sqs:DeleteMessage"
],
"Effect": "Allow",
"Resource": "*"
},
{
"Action": [
"s3:PutBucketNotification",
"s3:PutBucketPolicy"
],
"Effect": "Allow",
"Resource": "<cloudtrail-bucket-arn>"
}
]
}Create the S3 bucket for VPC flows
Ensure that the policy cvVpcFlowPermissions mentioned above has been created for the user
Log into https://console.aws.amazon.com and navigate to the S3 service using the Services section.
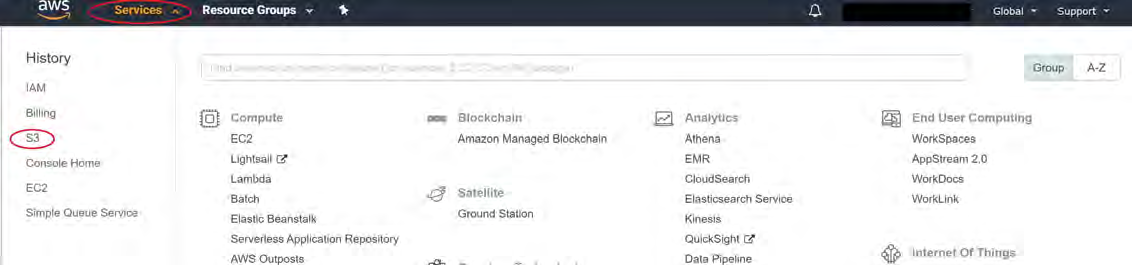
On the Amazon S3 page, click 'Create bucket.'
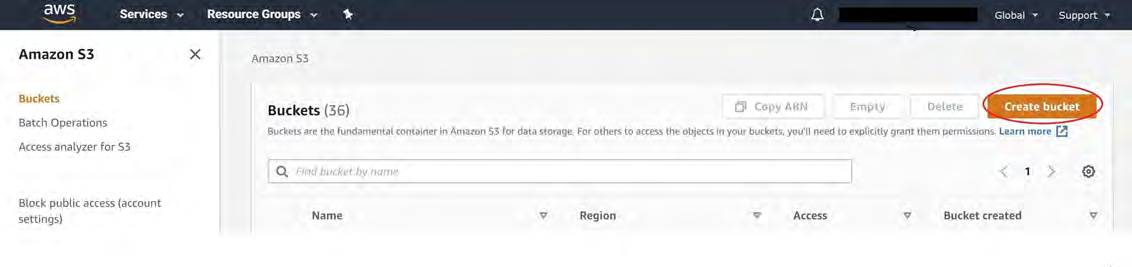
On the Create Bucket page, enter a name for the S3 bucket in the Bucket Name field and select a region.
The bucket name must be unique in AWS in all accounts. You can use your aws account number with the 'csp' prefix. For example:
csp-[account number of your aws account]-vpcflowsTo get the account number, click the drop down in the top right corner and select My Account.
Copyright © 2021 Cloudvisory Documentation, FireEye Inc.
28
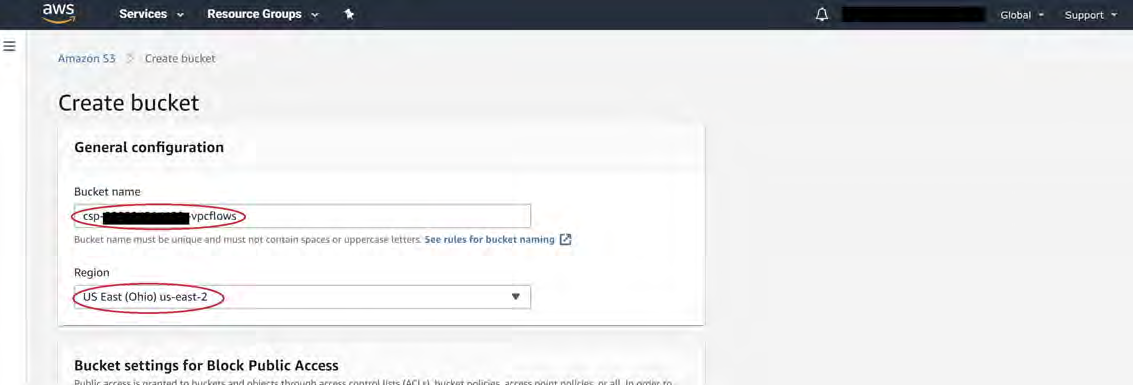
Create bucket
4. Ensure that the 'Block all public access' is selected.
5. Click Create Bucket to finish creating the bucket.
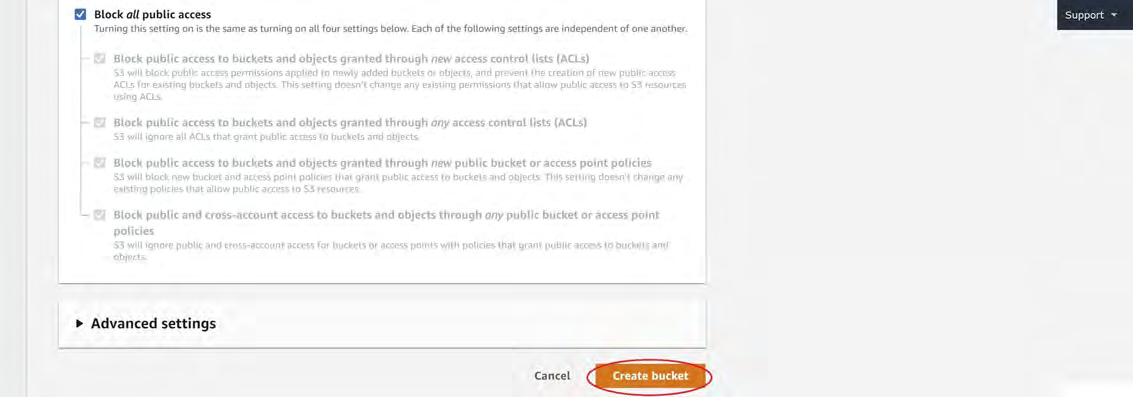
Create the CloudTrail trail
Ensure that the policy 'cvCloudtrailPermissions' mentioned above has been created for the user
Log into https://console.aws.amazon.com and navigate to the CloudTrail service using the Services section and select a desired region.
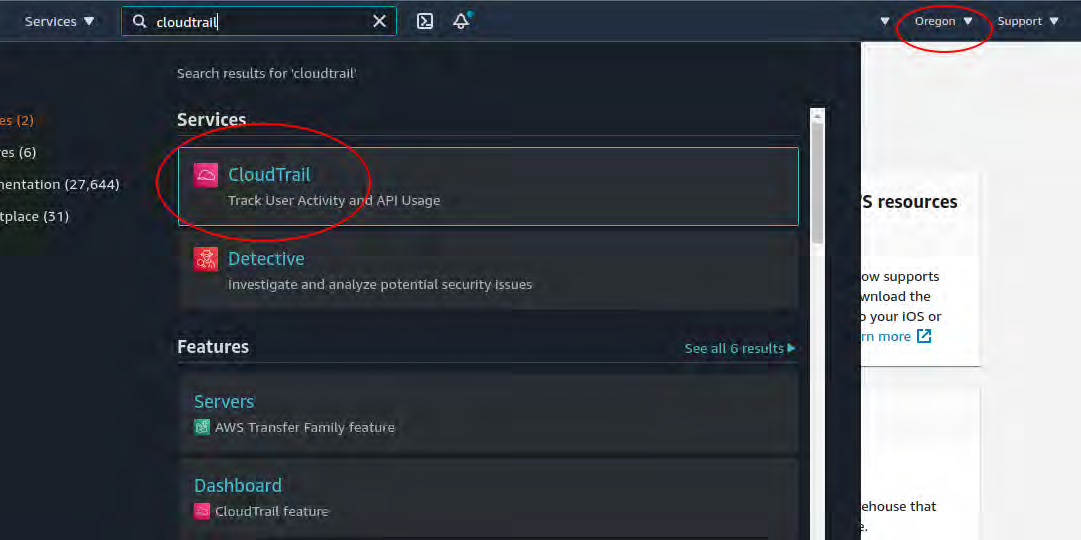
2. On the CloudTrail page, click Trails from the left-hand navigation and click 'Create trail.'
Copyright © 2021 Cloudvisory Documentation, Fireeye Inc.
29
3. On the 'Choose trail attributes' page:
Enter a name for the trail in the Trail Name field
Specify a unique bucket name. The bucket name must be unique in AWS in all accounts. You can use your aws account number with the 'csp' prefix. For example:
csp-[account number of your aws account]-trailTo get the account number, click the drop down in the top right corner and select My Account.Uncheck the 'Enabled' checkbox under 'Log file SSE-KMS encryption'
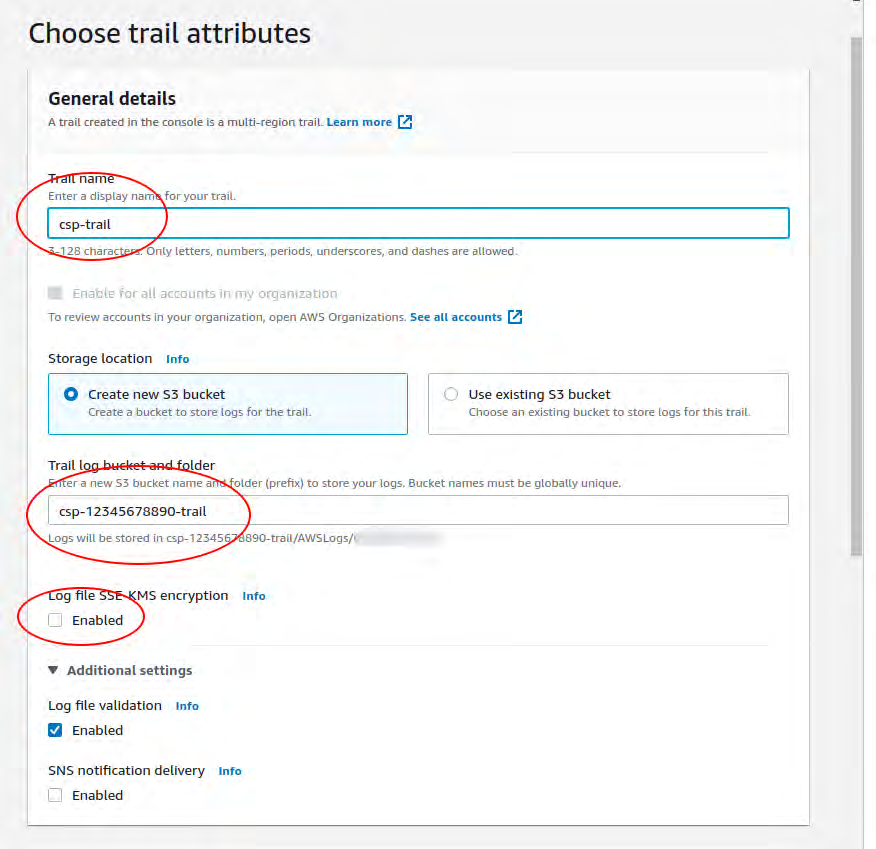
Scroll down to the end and click on Next > Next > 'Create trail' buttons, to save the changes and finish.
Permissions for discovering kubernetes resources in AWS EKS clusters
Copyright © 2021 Cloudvisory Documentation, Fireeye Inc.
30
Cloudvisory discovers AWS EKS Clusters and also all assets from the cluster. The following additional permissions need to be added for each EKS cluster. You can use the aws cli (1.6 or later) and kubectl.
Check whether your aws credential has access to the EKS cluster.
aws eks describe-cluster --name <cluster name>If you don't have access, update your kubeconfig file. Replace "cluster-name" and "cluster region name" with your cluster's name and region.
aws eks --region <cluster region name> update-kubeconfig --name <cluster name>
NOTE
Your aws credential must have permission to access EKS and your aws user must be included in the aws-auth config map. If not, please contact your AWS EKS cluster admin for help.
Add the ARN for
cspDiscoveryRolein the aws-auth config map:kubectl edit -n kube-system configmap/aws-authAdd the following lines under mapRoles and update the cspDiscoveryRole ARN:
cspDiscoveryUser- userarn: <ARN of cspDiscoveryUser> username: cspDiscoveryUser groups: - system:mastersSave the change.
Confirm the new permissions:
kubectl describe configmap -n kube-system aws-auth
Onboarding an AWS Account in Cloudvisory
Log into the Cloudvisory UI.
Click Admin Settings > Providers.
Click Add Account.
Account information
Enter Account Name.
Enter Account Description (optional).
Enter the Access Key.
Enter the Secret Key.
Enter AWS S3 bucket for flows (optional).
Enter AWS S3 bucket for CloudTrail (optional).
Choose AWS Cloud Type (Default, US Gov or China).
Click Next.
Configure Compliance checks
Select an option:
Auto-Configure Compliance Checks: If you select this option, Cloudvisory will create a default compliance group with this provider account and will enable default compliance checks.
Will Configure Manually : If you select this, you must configure the compliance group and add checks manually.
TIP
Use Auto-Configure Compliance Checks (the default selection) and see how Cloudvisory configures the compliance group and checks after adding the provider account.
Click Next.
Review and Click Submit.
Copyright © 2021 Cloudvisory Documentation, Fireeye Inc.
Azure
Step-by-step guide
You need the following information to onboard an Azure Provider Account in FireEye Cloudvisory Security Platform (Cloudvisory):
ClientId: The Client ID (appId) of the CloudvisoryService, an Azure Active Directory Application.
ClientKey: The Client Key (password) of the CloudvisoryService, an Azure Active Directory Application.
TenantId: The Tenant ID of the CloudvisoryService Azure Active Directory Application.
FlowStorageResourceGroup: The name of the ResourceGroup that is configured to gather all Azure NSG flows.
SubscriptionId: One or more subscription IDs. This is optional.
Task Overview
You can use either the Azure Cloud Shell or the Azure Portal to configure the account.
Configure the account using the Azure Cloud Shell or
Configure the account using the Azure Portal.
Configure additional permissions
Configure Azure flow logging
Create Network Watchers in the Azure Portal
Create an Azure storage account
Download flows by configuring a shared access signature in the storage account (optional)
Add the Azure account in Cloudvisory and configure compliance checks
1. Configure the Account Using Azure Cloud Shell
1.1 Launch the shell and check the list of subscriptions
Log into the Azure portal and click the Cloud Shell icon in the top-right corner.
If you are doing this for first time, it may ask you to select a resource group, region and storage account.
This document is for the Cloud Shell with bash script.Check Your Cloud Shell:
Copy the command below and execute it in the cloud shell. It should display the list of subscriptions in your tenant.
az account list --output tableOutput:
Name CloudName SubscriptionId State IsDefault
---------- ---------- ----------------------------------- ------- ----------
cv1111 AzureCloud db7fc2fc-0d04-4bxxxxxxxxxxxxxxxx Enabled False
cv2222 AzureCloud f03a7b8a-67exxxxxxxxxxxxxxxxxxxx Enabled True1.2 Create the Azure Active Directory application
Copy the command below, replace
clientidwith your ClientID string, and execute it in the cloud shell. Copy the appId in a text editor.
az ad app create --display-name CloudvisoryService --identifier-uris https://www.cvapp-<clientid>.cloudvisory.net/Output:
{
"acceptMappedClaims": null,
"addIns": [],
"appId": "4c1805c3-6250-4246-8de1-a51768452286",
"appPermissions": null,
"appRoles": [],
...
"objectId": "62582d73-192a-4d0e-bb72-8e0348c8e089",
....
}1.3 Configure the service principal for the CloudvisoryService Application
Copy the command below, replace
appIdwith the appID value collected in the previous step, and execute it in the cloud shell. CopyobjectIdin a text editor.
az ad sp create --id <appId>Copyright © 2021 Cloudvisory Documentation, Fireeye Inc.
Output:
{
...
"objectId": "da28ec8a-539a-4055-99d8-7600000da720",
"objectType": "ServicePrincipal",
...
}1.4 Create the password or ClientKey for the CloudvisoryService application
Copy the command below, replace
objectIdwith the value obtained in the previous step, and execute it in the cloud shell.Copy the values of
appId(for ClientId in Cloudvisory UI),password(for ClientKey in Cloudvisory UI), andtenant(for TenantId in Cloudvisory UI) in a text editor.
az ad app credential reset --id <appId> --appendOutput:
{
"appId": "xx1805c3-6250-4246-8de1-a51768452286",
"name": "xx1805c3-6250-4246-8de1-a51768452286",
"password": "xx5a79e6-2e44-4037-9d21-d9b8fd57e88a",
"tenant": "xxcb6fa2-fae1-4c7e-8ef4-0f1a232cac69"
}1.5 Assign a Role to the CloudvisoryService Application
Assign one of the following roles to the application:
Azure built-in Reader Role and Readonly Azure Custom Roles (Recommended for Compliance Check run only, no remediation support)
Azure built-in Contributor Role (Recommended for Compliance Check run and remediation support)
Least Privilege Azure Custom Roles (Recommended for Compliance Check run and remediation support with least privilege)
The commands below will assign a Contributor role. To assign a Reader or Least Privilege role, see the topic Azure Custom Roles.
There are two ways to assign role a role:
At the Management Group level (recommended): Allows Cloudvisory to access all the subscriptions of the group.
At the Subscriber level: You must assign the role in each subscription.
Assign the role to the Management group level (recommended).
If you do not have a management group, you can easily create one in the Azure portal.
Find the management group ID: Execute the following command in the cloud shell and copy the ID from the output.
az account management-group listOutput:
{ ... "id": "/providers/Microsoft.Management/managementGroups/CloudvisoryMgmtGroup", ... }Create the role assignment: Copy the command below. Replace
object id of the service principalwith the object ID that you copied when you created the service principal. Replace{id of the management group}with the management group ID from step 1.az role assignment create --role Contributor --assignee-object-id <object id of the service principal> --scope <id of the management group>Output:
{ ... }
b) Assign the role to the Subscription level. In this method, you need to assign the role in all subscriptions.
Find the Subscription IDs: Execute the following command to find the list of subscriptions in your tenant.
az account list --output tableOutput:
Name CloudName SubscriptionId State IsDefault ----- ---------- -------------------------------- -------- --------- cv1111 AzureCloud xxfc2fc-0d04-4bxxxxxxxxxxxxxxxx Enabled False cv2222 AzureCloud xx3a7b8a-67e7xxxxxxxxxxxxxxxx Enabled True
Copyright © 2021 Cloudvisory Documentation, Fireeye Inc.
4. Create the role assignment: Copy the command below. Replace object id of the service principal with the object id that you copied when you created the service principal. Replace id of the subscription with the subscription ID from step 1.
az role assignment create --role Contributor --assignee-object-id <object id of the service principal> --scope /subscriptions/<id of the subscription>Output:
{
...
}2. Configure the Account Using the Azure Portal
(Skip this section if you configured the account using the Azure Cloud Shell in section 1.)
The following steps will provide the ClientID, ClientKey, SecretKey and TenantID needed to set up the Azure account in Cloudvisory.
Get your Azure Subscription ID. The subscription ID is a GUID that uniquely identifies your subscription to use Azure services.
Log on to the Azure portal.
In the left navigation panel, click Subscriptions.
The list of your subscriptions is displayed along with the subscription ID.
CAUTION
Ensure that you have the required permissions to create an application in Azure Active Directory (AAD).
For instructions, see Check Azure Active Directory permissions in the Microsoft documentation.
Create an AAD application. In a text editor (such as Notepad), copy the name of the application and label it
Application Name.NOTE
For instructions, see Create an Azure Active Directory Application in the Microsoft documentation.
Get the Application ID and generate an authentication key for this application. In a text editor (such as Notepad), copy the name of the Application ID and label it
ClientId. Copy the authentication key string to the text editor and label the stringClientKeyNOTE
For instructions, see Get Application ID and Authentication Key in the Microsoft documentation.
Get the Tenant ID, which is the ID of the AAD directory in which you created the application. In a text editor (such as Notepad), copy the ID and label it
TenantId.NOTE
For instructions, see Get tenant ID in the Microsoft documentation.
Assign a role to the application.
In the left pane of the Azure portal menu, select Subscriptions.
Select your subscription.
Select the Access Control (IAM) tab.
Add your application.
Assign one of the following to the application:
Azure built-in Reader Role and Readonly Azure Custom Roles (Recommended for Compliance Check run only, no remediation support)
Azure built-in Contributor Role (Recommended for Compliance Check run and remediation support)
Least Privilege Azure Custom Roles (Recommended for Compliance Check run and remediation support with least privilege)
NOTE
For details, see Assign application to role in the Microsoft documentation.
3. Configure Additional Permissions
In addition to the above permissions, the Azure CIS Compliance checks also require that you enable Active Directory Read permissions through the Azure Console.
NOTE
Only a user with account owner privileges can grant these permissions.
Click the Azure Active Directory application that you configured above.
Click the API Permissions
Click "Add a permission"
Copyright © 2021 Cloudvisory Documentation, Fireye Inc.
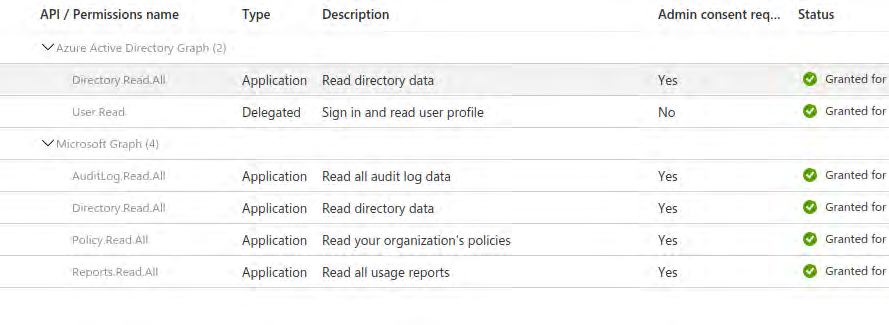
Select Azure Active Directory Graph
Click "Application permissions"
Expand "Directory" and select "Directory.Read.All"
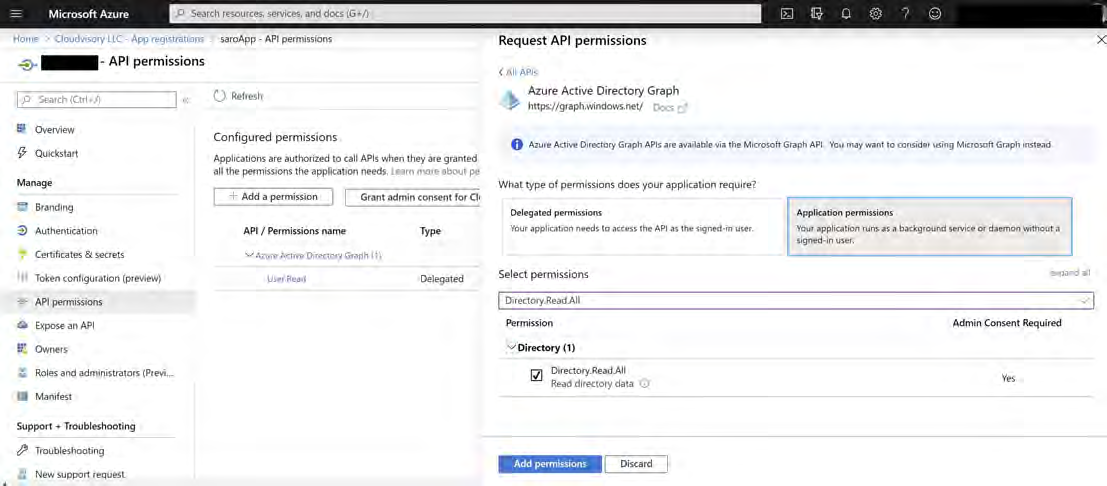
Expand "User" and select "User.Read"
Click on the "Add Permissions" button to save.
Click the API Permissions again
Click "Add a permission"
Select Microsoft Graph
Click "Application permissions"
Expand "Policy" and select "Policy.Read.All"
Click on the "Add Permissions" button to save.
Click the "Grant admin consent" button to apply these newly added permissions.
Additional permissions for user discovery (Optional):
Click the Azure Active Directory application that you configured above.
Click the API Permissions
Click "Add a permission"
Select Microsoft Graph
Click "Application permissions"
Expand "Reports" and select "Report.ReadAll"
Expand "Directory" and select "Directory.Read.All"
Expand "User" and Select "User.Read.All"
Expand "AuditLog" and Select "AuditLog.Read.All"
Click on the "Add Permissions" button to save.
Click the "Grant admin consent" button to apply these newly added permissions.
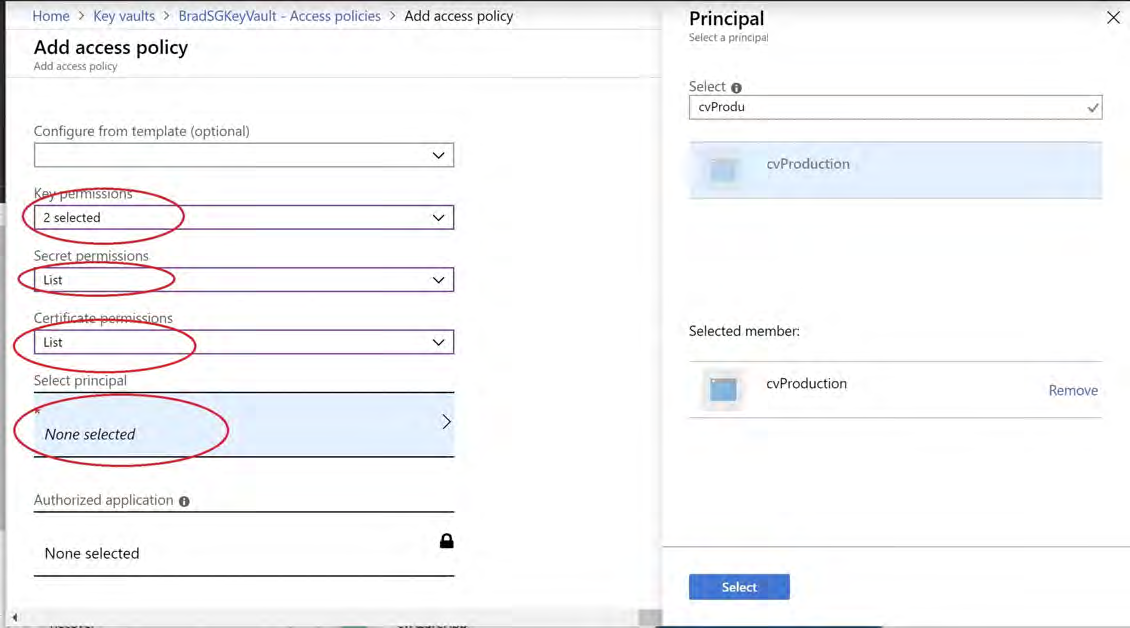
In order for the Azure CIS Compliance checks to verify the Key Vault secret and key attributes, for each Key Vault in your Azure subscriptions, you must also enable the AAD application to access keys and secrets within the vault.
In the Azure Console, navigate to Key Vaults, then follow these steps for each vault:
Click "Access Policies"
Click "Add access policy."
Select 'List', 'Get', 'Update' and 'Delete' for Key Permissions
Copyright © 2021 Cloudvisory Documentation, Fireeye Inc.
Select ‘List’, ‘Get’, ‘Set’ and ‘Delete’ for Secret Permissions
Select ‘List’, ‘Get’, ‘Update’ and ‘Delete’ for Certificate Permissions
Select your application in "Select Principal"
Click ‘Add’
NOTE
Click here for more information on this process.
4. Configure Azure Flow Logging
4.1 Register the Microsoft Insights provider
CAUTION
The following steps are required for every subscription.
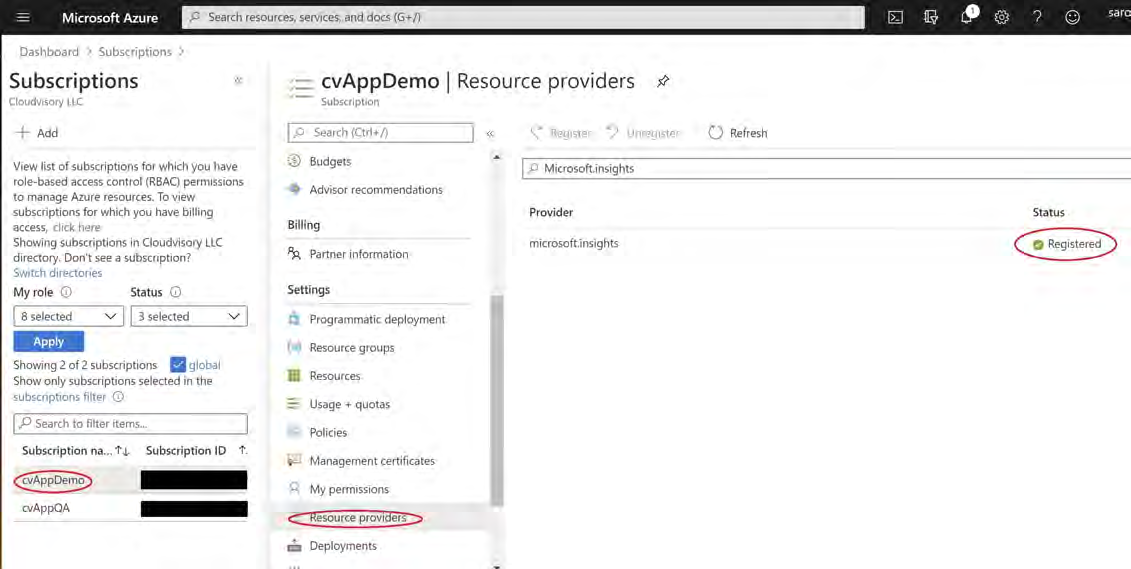
For flow logging to work successfully, the Microsoft Insights provider must be registered. To register the provider, take the following steps:
Go to Subscriptions.
Select the subscription for which you want to enable flow logs.
On the Subscription panel, select Resource Providers.
Verify that the microsoft.insights provider is registered in the list of providers. If it is not, then select Register.
Copyright © 2021 Cloudvisory Documentation, Fireeye Inc.
4.2 Create Network Watchers in the Azure Portal
NOTE: The following steps are required for each region of each subscription that needs flows captured.
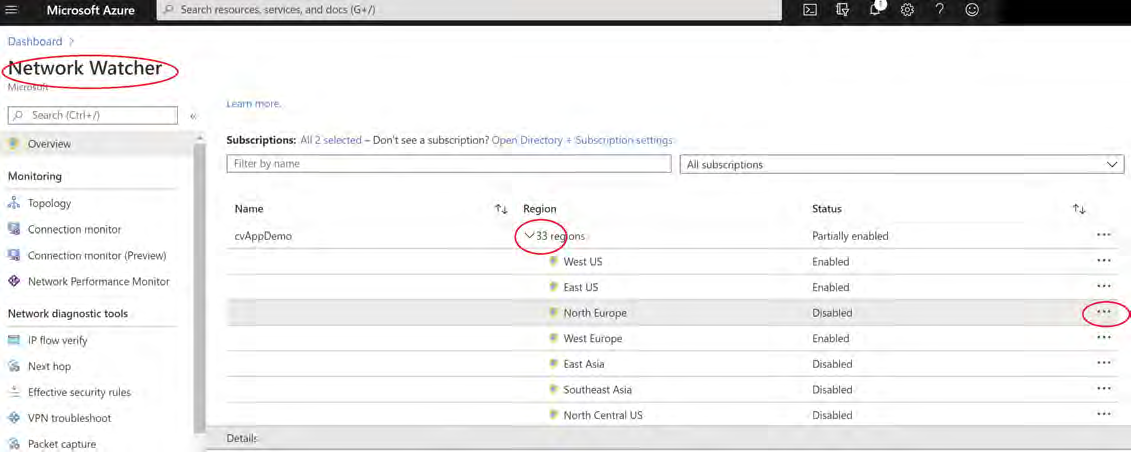
Search for Network Watcher and open it.
Select all the subscriptions you want to enable Network Watcher for.
This action creates a Network Watcher in every region that is available.
When you enable Network Watcher using the Portal, the name of the Network Watcher instance is automatically set to NetworkWatcher_region_name, where region_name corresponds to the Azure Region where the instance was enabled.
For example, a Network Watcher enabled in the West Central US region will be named NetworkWatcher_westcentralus.
Additionally, the Network Watcher instance is automatically added to a Resource Group called NetworkWatcherRG. This Resource Group will be created if it does not already exist.
Even if you are using PowerShell, REST API or ARM Client methods, please do not change the standard network watcher instance name and the resource group name. The Cloudvisory application uses these names for flow logging.
4.3 Create an Azure Storage Account
CAUTION
The following steps are required for every subscription.
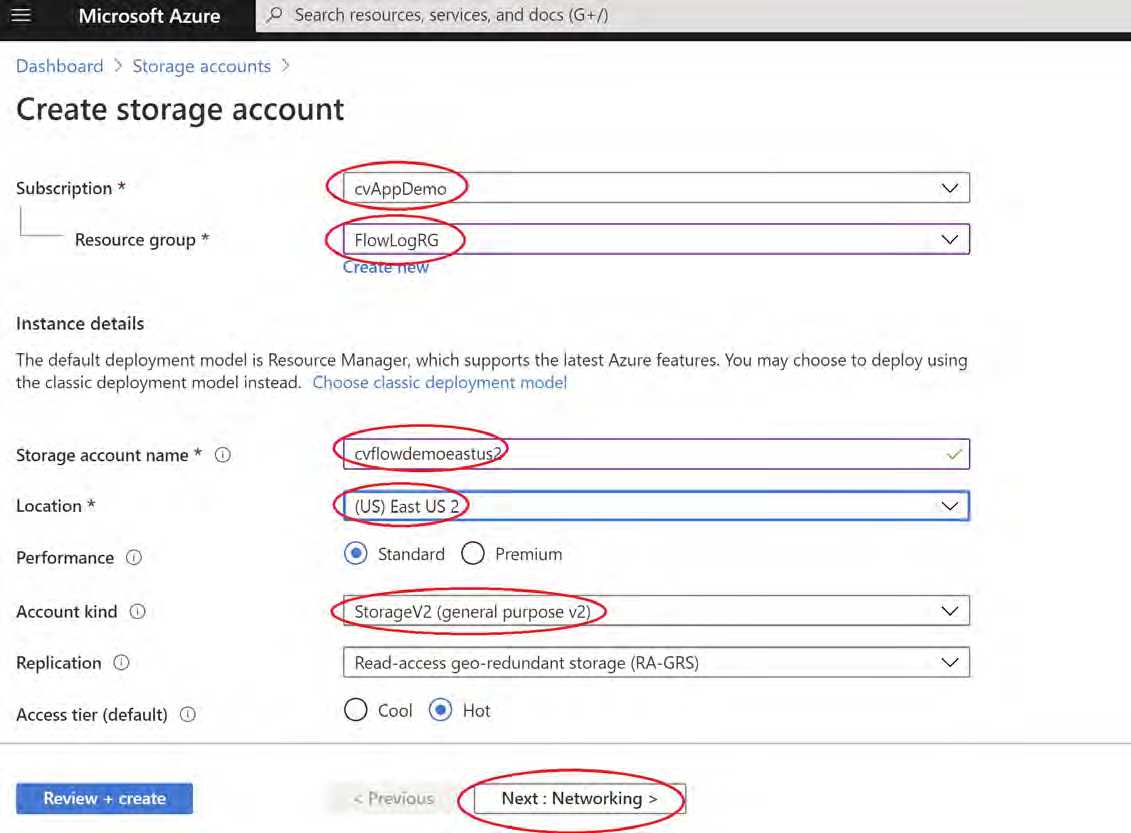
In the Azure Portal, create a resource group, for example, FlowLogRG.
IMPORTANT Make sure the resource group name is the same in every subscription.
Copyright © 2021 Cloudvisory Documentation, Fireeye Inc.
This resource group should be dedicated for storage accounts used to collect flows. No other storage account or resource should be assigned to this resource group. 2. Create a storage account in this resource group for each region where you have VMs that you want to capture flows for. Select StorageV2 for Account Kind. Each storage account name is unique. It is recommended that you select a naming pattern like cvflow-{subscription name}-{region name}, for example, cvflow-demo-eastus2. Follow the steps below:
Search for Storage Accounts on the search bar and click Add.
Select a subscription.
Select the ResourceGroup.
Enter the name of the storage account.
Select the Location.
Select StorageV2.
Click Networking.
Make sure "Public endpoint (all network)" is selected.
Click Advanced.
Copyright © 2021 Cloudvisory Documentation, Fireeye Inc.
38
Dashboard > Storage accounts
Create storage account
Basics Networking Advanced Tags Review + create
Network connectivity
You can connect to your storage account either publicly, via public IP addresses or service endpoints, or privately, using a private endpoint.
Connectivity method *
Public endpoint (all networks)
Public endpoint (selected networks)
Private endpoint
All networks will be able to access this storage account. Learn more about connectivity methods
[IMAGE PLACEHOLDER: Screenshot of Azure "Create storage account" Networking tab showing Connectivity method options with "Public endpoint (all networks)" selected and navigation buttons "Review + create", "< Previous", "Next : Advanced >".]
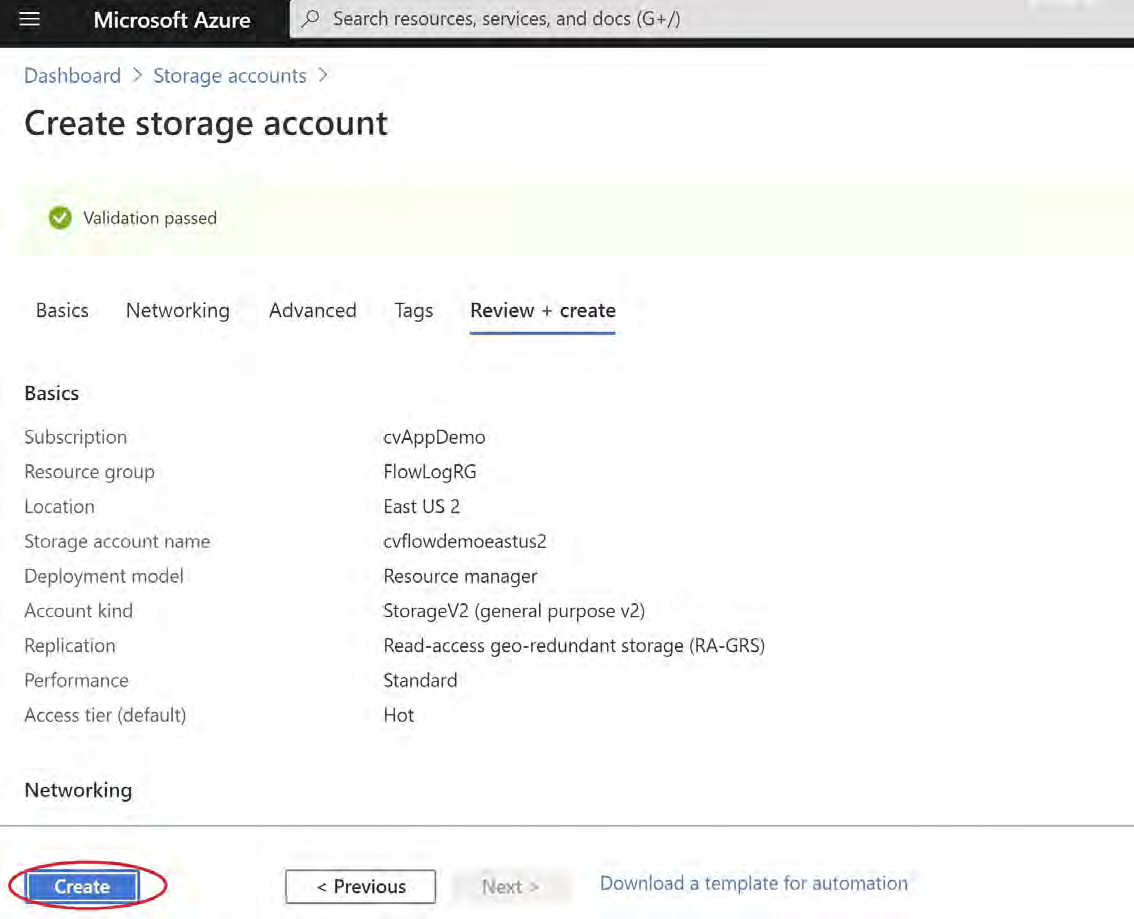
10. Keep the default setting and click Review + Create.
Create storage account
Basics Networking Advanced Tags Review + create
Security
Secure transfer required (i)
Disabled
Enabled
Azure Files
Large file shares
Disabled
Enabled
The current combination of storage account kind, performance, replication and location does not support large file shares.
Data protection
Blob soft delete (i)
Disabled
Enabled
File share soft delete
Disabled
Enabled
Versioning (i)
Disabled
Enabled
The current combination of subscription, storage account kind, performance, replication and location does not support versioning.
[IMAGE PLACEHOLDER: Screenshot of Azure "Create storage account" Advanced tab showing Security and Data protection settings with radio controls and informational messages; bottom navigation buttons "Review + create", "< Previous", "Next : Tags >" with the "Review + create" button circled in the screenshot.]
11. Review the information and click Create.
Copyright © 2021 Cloudvisory Documentation, Fireeye Inc.
5. Download flows by configuring a shared access signature in the storage account (optional)
This step is optional, but it provides the ability to download flows from the storage account without providing the storage account keys. Follow these steps for each flow storage account:
Log in to the Azure console.
Go the storage account that was configured to store flow logs.
Note the storage account Location. This will be required in the Cloudvisory UI.
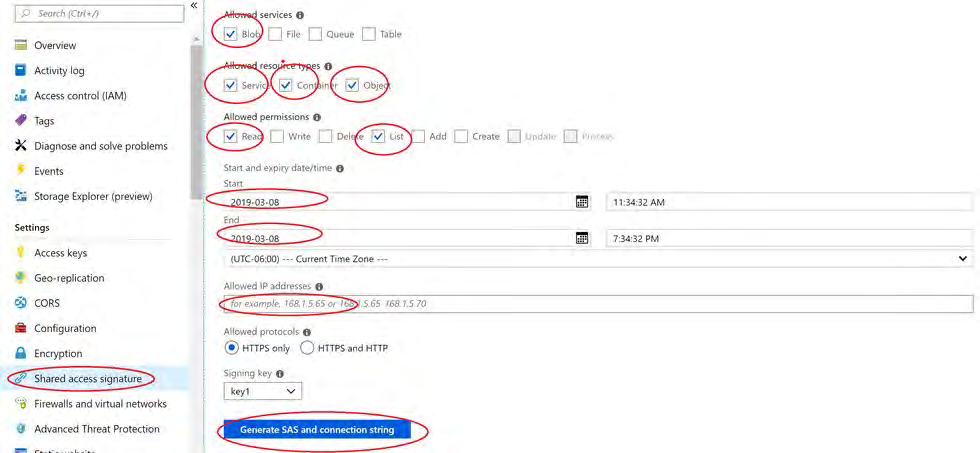
On the Storage Account menu, select “Shared access signature”.
Select the following checkboxes:
Allowed services: Blob
Allowed resource types: Service, Container, and Object
Allowed permissions: Read and List
Enter a start and end time.
Enter the IP address of the Cloudvisory server.
Click "Generate SAS and connection string."
Copyright © 2021 Cloudvisory Documentation, FireEye Inc.
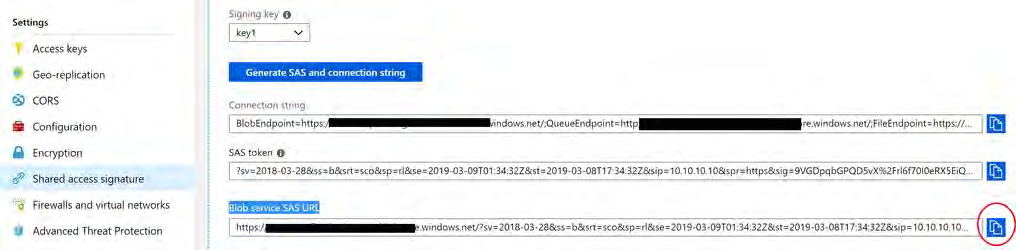
9. Copy the content of "Blob Service SAS URL." This will be required in the Cloudvisory UI.
NOTE
You do not need to perform the steps for enabling flow logs on a network security group and for downloading them, described in the sections “Enable flow logs” and “Download flow logs” in https://docs.microsoft.com/en-us/azure/network-watcher/network-watcher-nsg-flow-logging-portal. They are performed automatically by Cloudvisory for all the security groups used by the virtual machines that Cloudvisory discovers.
6. Add the Azure Account in Cloudvisory
Account Information
Log in to the Cloudvisory UI.
Click Admin Settings → Providers.
Click Azure in the left panel.
Click Add Account.
Enter Account Name
Enter ClientId
Enter ClientKey
Enter TenantId
Enter FlowStorageResourceGroup (Optional).
Click NEXT.
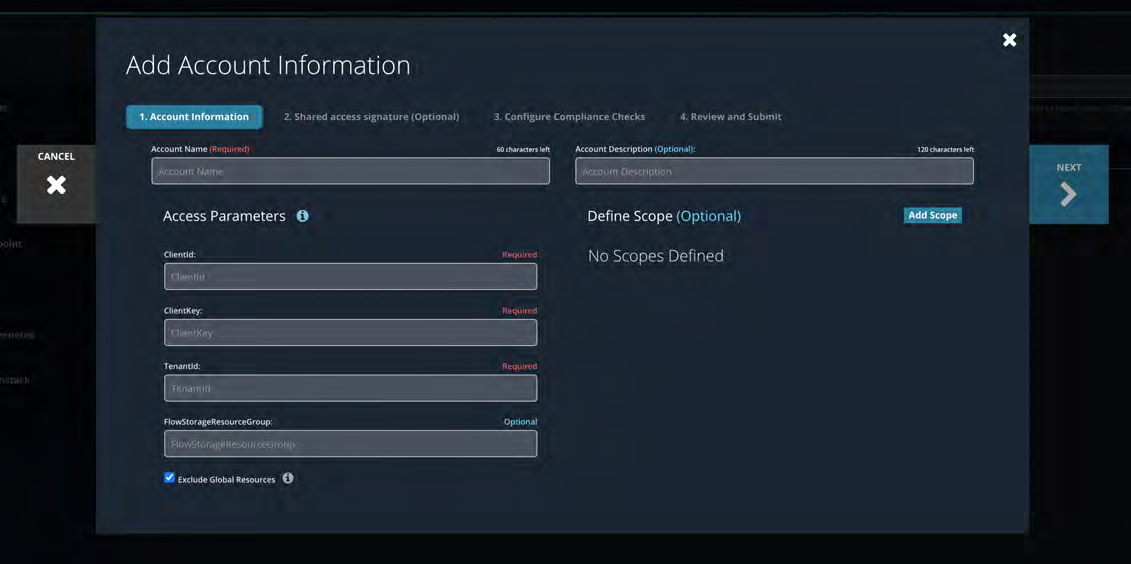
Define Scope: The scope section is optional. If no scope is specified, all subscriptions and locations will be discovered automatically by Cloudvisory. If you want to restrict the set of resources to be discovered, click Add Scope in the Define Scope section and specify one or more Subscription/Locations.
Configure Compliance checks
Select an option for compliance checks.
Auto-Configure Compliance Checks: Cloudvisory will create a default compliance group with this provider account and will enable default compliance checks.
Will Configure Manually: You must configure a Compliance group and add checks manually. See Compliance Group
TIP
Accept Auto-Configure Compliance Checks as a default selection and see how Cloudvisory configures the compliance group and checks after you add the provider account.
2. Click Next.
3. If you use a shared access signature to restrict client access to the storage account, go to the next section. If not, review and click Submit
Shared access signature (Optional)
If you use a shared access signature to restrict client access to the storage account, follow these steps.
Azure Locations(Regions) Azure has predefined locations. When setting up accounts for the following providers, use the following values when defining a location:
ASIA | AMERICAS | EUROPE | OCEANIA |
|---|---|---|---|
eastasia | eastus | ukwest | australiasoutheast |
southeastasia | eastus2 | uksouth | australiaeast |
koreacentral | westus | northeurope | - |
koreasouth | westus2 | westeurope | - |
southindia | centralus | - | - |
centralindia | northcentralus | - | - |
westindia | westcentralus | - | - |
japanwest | southcentralus | - | - |
japaneast | canadacentral | - | - |
- | canadaeast | - | - |
- | brazilsouth | - | - |
Copyright © 2021 Cloudvisory Documentation, Fireeye Inc.
Enter
LocationEnter
URLClick Next.
Review and click Submit.
Azure Custom Roles
Cloudvisory can use Azure's built-in Reader Role, Contributor Role or a Custom Role (Cloudvisory Admin).
For Read-Only Access :
Cloudvisory requires only the following set of actions in addition to the Azure built-in Reader Role. This role has permissions to view and configure network flows and run compliance checks.
{
"Name":"Cloudvisory Reader",
"Description":"Custom reader role Cloudvisory Security Platform (CSP)",
"IsCustom":true,
"Actions":[
"Microsoft.Storage/storageAccounts/listKeys/action",
"Microsoft.Network/networkWatchers/queryFlowLogStatus/action",
"Microsoft.Network/networkWatchers/configureFlowLog/action"
]
}Save the JSON content above in a file named cvreader.json and upload it to the cloud shell.
Change the ID of AssignableScopes to your Management group or to your subscription.
Execute the following command:
az role definition create --role-definition @cvreader.jsonFor Least Privilege Access :
Cloudvisory requires the following set of permissions or actions to manage Azure workloads and network flows, as well as to run and remediate compliance checks.
{
"Name":"Cloudvisory Admin",
"Description":"Custom role Cloudvisory Security Platform (CSP)",
"IsCustom":true,
"Actions":[
"Microsoft.Authorization/*/read",
"Microsoft.Compute/availabilitySets/*/read",
"Microsoft.Compute/disks/read",
"Microsoft.Compute/locations/*/read",
"Microsoft.Compute/virtualMachines/*/read",
"Microsoft.Network/locations/*/read",
"Microsoft.Network/networkInterfaces/*",
"Microsoft.Network/networkSecurityGroups/*",
"Microsoft.Network/networkSecurityGroups/join/action",
"Microsoft.Network/publicIPAddresses/*",
"Microsoft.Network/publicIPAddresses/join/action",
"Microsoft.Network/virtualNetworks/*",
"Microsoft.Network/virtualNetworks/subnets/join/action",
"Microsoft.Resources/subscriptions/resourceGroups/read",
"Microsoft.Resources/subscriptions/resourceGroups/write",
"Microsoft.Security/*/read",
"Microsoft.Security/*/write",
"Microsoft.Storage/*/read",
"Microsoft.Storage/storageAccounts/listServiceSas/action",
"Microsoft.Storage/storageAccounts/listAccountSas/action",
"Microsoft.Storage/storageAccounts/listKeys/action",
"Microsoft.Network/networkWatchers/*",
"Microsoft.Network/networkWatchers/packetCaptures/*",
"Microsoft.Sql/locations/*/read",
"Microsoft.Sql/servers/*/read",
"Microsoft.Sql/servers/read",
"Microsoft.Sql/servers/*/write",
"Microsoft.Sql/servers/write",
"Microsoft.Sql/servers/firewallRules/*/read",
"Microsoft.Sql/servers/securityAlertPolicies/*/read",
"Microsoft.Sql/servers/databases/securityAlertPolicies/write",
"Microsoft.Web/listSitesAssignedToHostName/read",
"Microsoft.Web/certificates/*/read",
"Microsoft.Web/serverFarms/read",
"Microsoft.Web/sites/*/read",
"Microsoft.Web/sites/config/list/action",
"Microsoft.Web/hostingEnvironments/read",
"Microsoft.CostManagement/Query/read"
],
"NotActions":[
],
"AssignableScopes":[
"/subscriptions/111111-1111-1111-1111-111111111111"
]
}Save the JSON content above in a file named cvadmin.json and upload it to the cloud shell.
Change the ID of AssignableScopes to your Management group or to your subscription.
Execute the following command:
az role definition create --role-definition @cvadmin.jsonCopyright © 2021 Cloudvisory Documentation, Fireeye Inc.
GCP
Step-by-step guide
You need the following information to onboard a GCP Provider Account in FireEye’s Cloudvisory Security Platform (CSP) - aka Cloudvisory (CV):
Service Account Key File: The Service Account JSON file to access cloud assets in GCP Projects.
Firewall Logs Subscription Name (optional): The name of the Pub/Sub Subscription for Firewall Rule Logs. This is not required for minimal functionality, but is required to view network flows for Workloads (e.g. VMs) in GCP.
Audit Logs Subscription Name (optional): The name of the Pub/Sub Subscription for Audit Logs. This is not required for minimal functionality, but is required to configure alerts related to security events in GCP.
NOTE
Enabled compute api for all the projects to be discovered. If not, cloudvisory will ignore the assets in the project.
Task Overview
Create a Service Account
Create a Service Account JSON file
Give the account access to all GCP projects or to a subset of projects
Create Firewall Logs Subscription
Create a Pub/Sub Topic
Create subscription for the cspFirewallRuleFlowLogSink
Create Audit Logs Subscription
Create a Pub/Sub topic for publishing audit logs
Create a Pub/Sub Subscription to consume Audit Logs from the PubSub topic
Forward GCP audit logs to the cspAuditLog topic
Create a Log sink for cspAuditLog topic
Onboard the GCP Provider Account and configure compliance checks
1. Create a Service Account
Creating a service-account is similar to adding a member to your project, but the service-account belongs to your applications rather than an individual end user.
1.1 Create the Service Account JSON file
Go to the Google Cloud Platform (GCP) Console and sign in as a super administrator.
Select a project on top project dropdown menu.
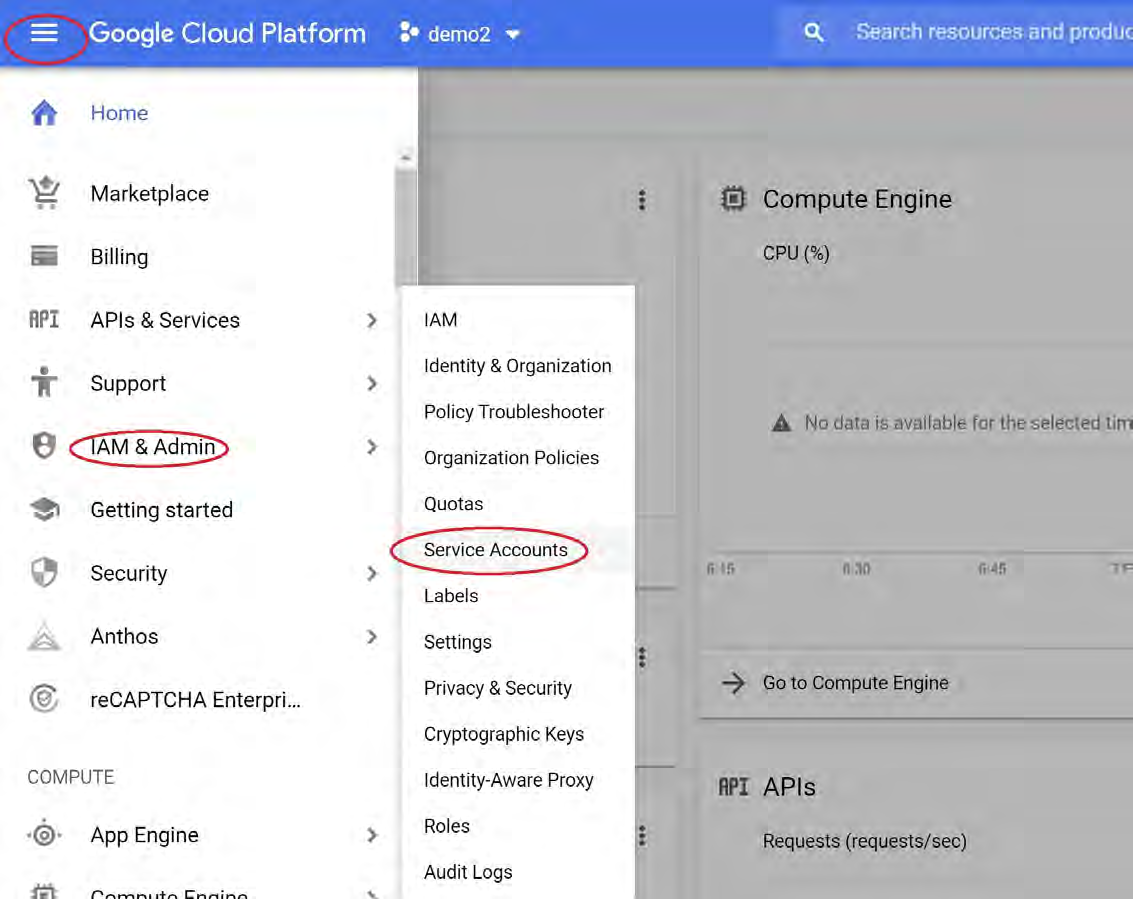
In the top-left corner of the GCP Cloud Console, click: Menu > IAM & Admin > Service Accounts
4. Click the Create Service Account link.
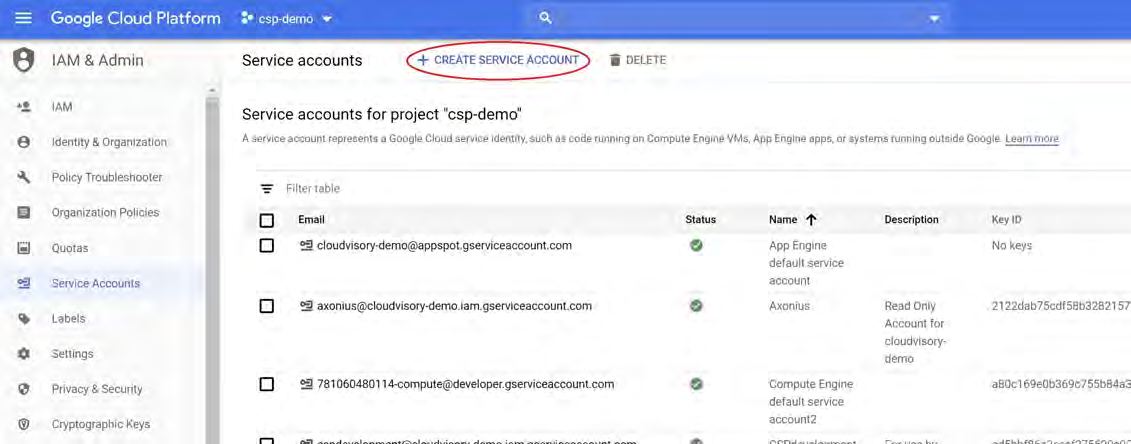
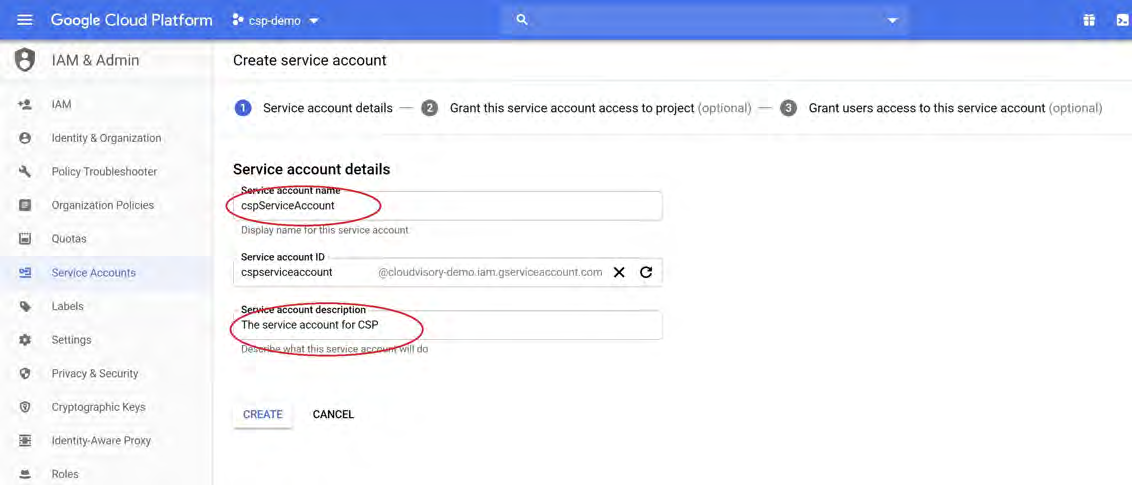
5. Enter Service Account details:
Enter cspServiceAccount in service-account Name Field.
Enter 'Service Account for FireEye Cloudvisory' in 'Service account description' field.
Click CREATE.
Copyright © 2021 Cloudvisory Documentation, Fireeye Inc.
45
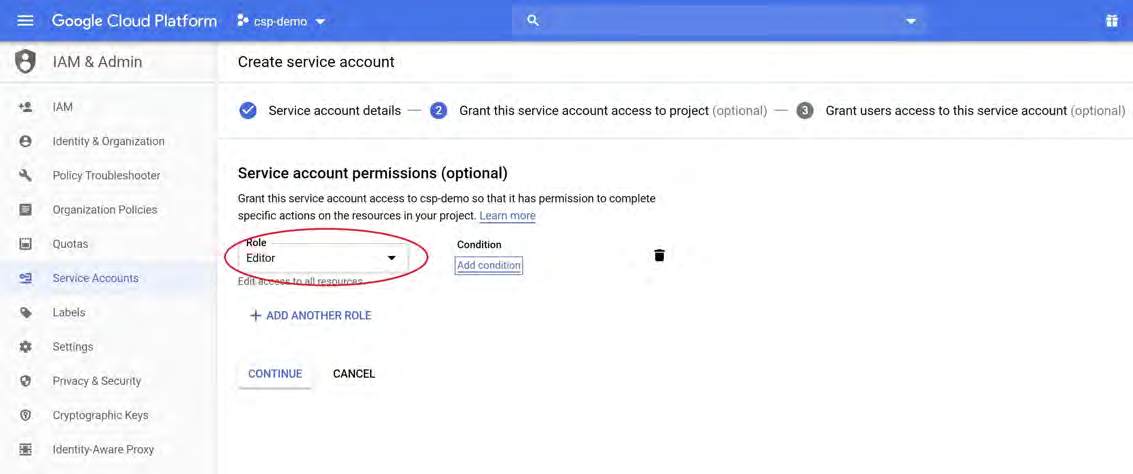
6. Select a Role and click CONTINUE:
Select 'Editor' to provide read and write permissions to the Cloudvisory application.
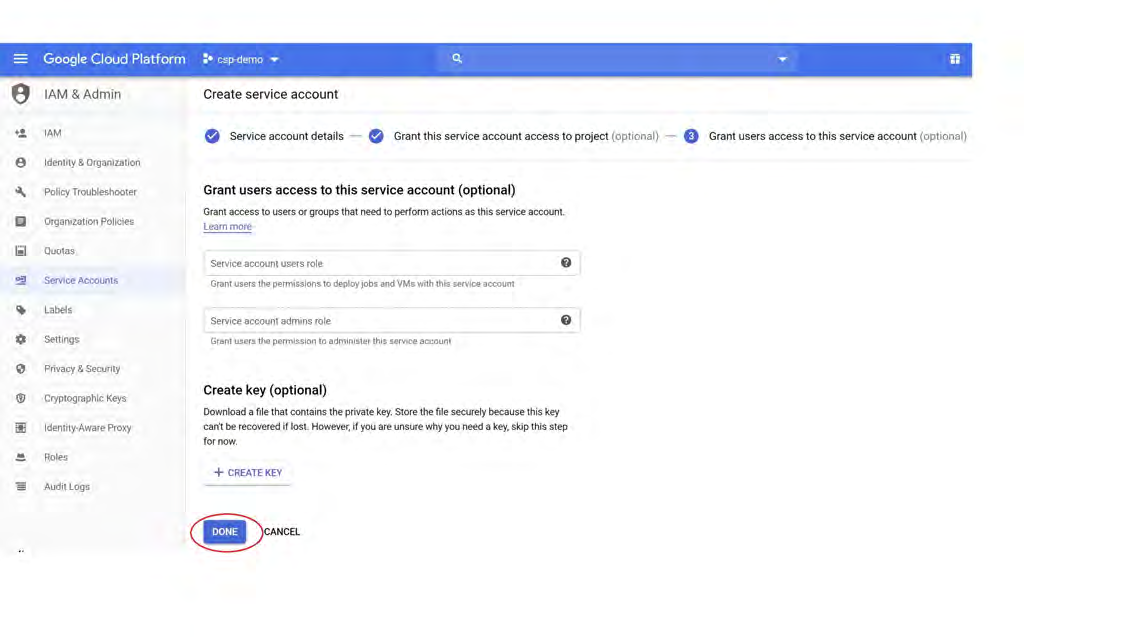
7. Click ‘ONE to create the Service Account.
Copyright © 2021 Cloudvisory Documentation, Fireeye Inc.
46
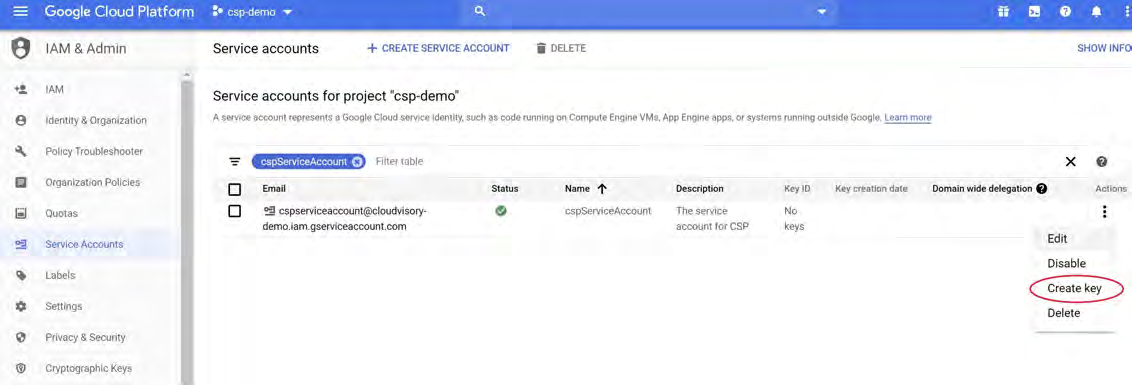
8. Search for the cpsserviceaccount. Then click Actions and click ‘Create Key.
9. Select JSON and click CREATE.
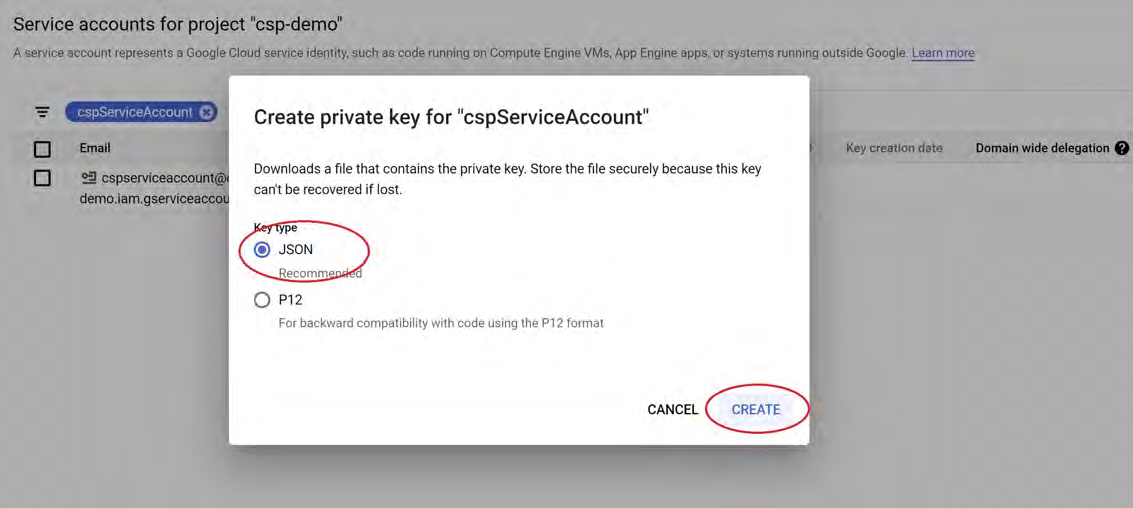
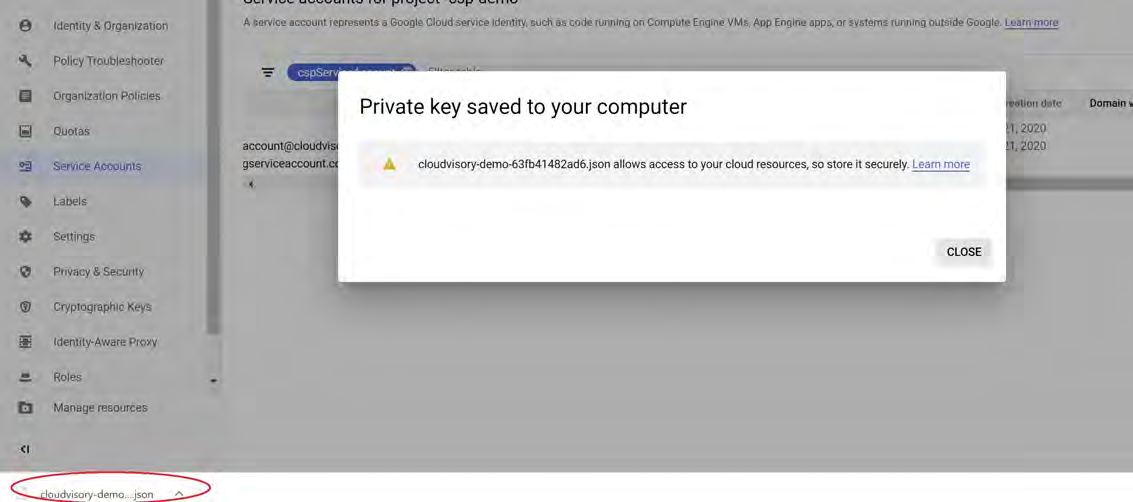
This will create the service-account file and save it to your local computer.
This file will be required to select in the Service Account Key File field in Cloudvisory UI.
Copyright © 2021 Cloudvisory Documentation, Fireeye Inc.
47
1.2 Provide view access to the organization (required)
This service-account file now has access to one GCP Project. Cloudvisory requires organization level (read-only) access.
Follow the steps to provide organization level (read-only) access:
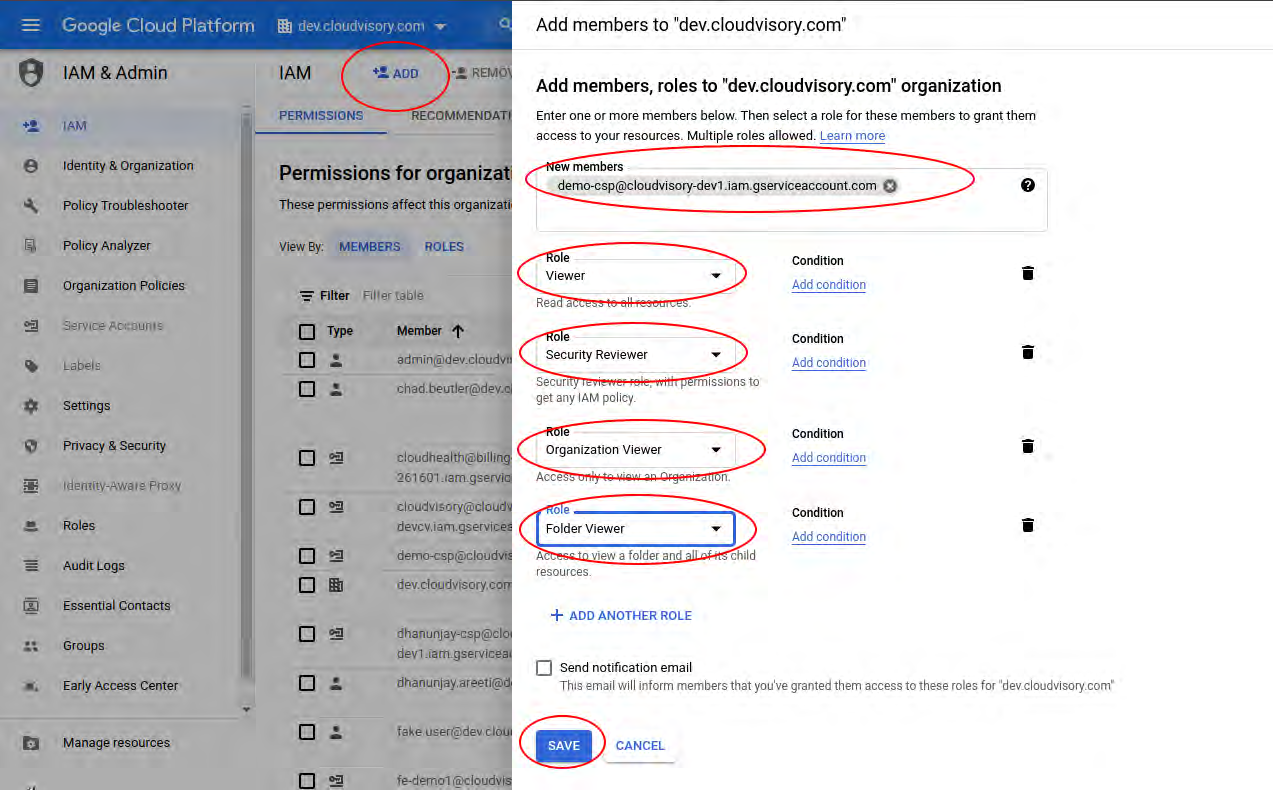
In the Select from pop-up, select the Organization from the drop-down and under the All tab select the organization from the tree menu
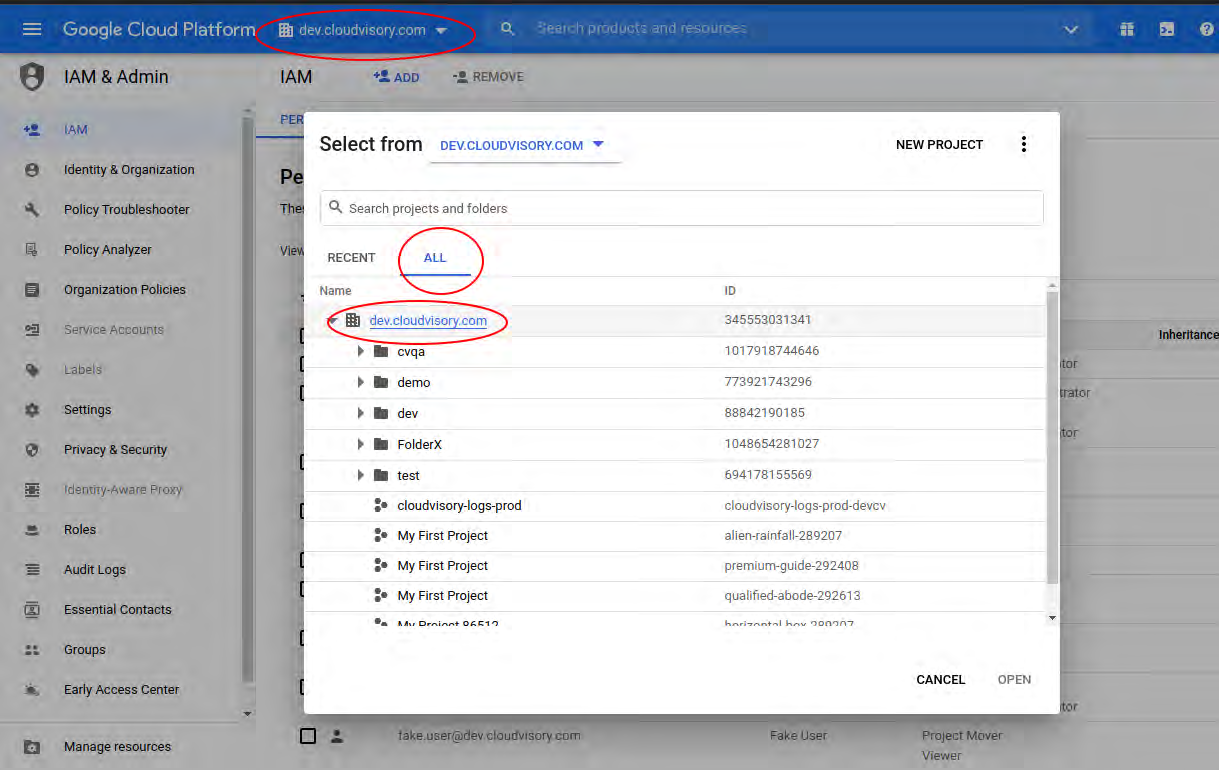
In the top-left corner of the GCP Cloud Console, click: Menu > IAM & Admin > IAM
Click ADD to add the service-account as member of the Organization.
Search for and select the service-account - by typing the first few letters of the name and then selecting from the drop-down.
Select a Role and click CONTINUE:
Select 'Viewer' - required for providing (read-only) permissions, of all projects to the service-account.
Click '+ ADD ANOTHER ROLE' and select 'Security Reviewer' - required for the service-account, to audit all security policies in the organization.
Click '+ ADD ANOTHER ROLE' and select 'Organization Viewer' - required for the service-account, to view the metadata in the entire organization - like folders, projects, etc.
Click '+ ADD ANOTHER ROLE' and select 'Folder Viewer' - required for the service-account, to read folder metadata in the organization.
(optional) Click '+ ADD ANOTHER ROLE' and select 'Editor' - To provide 'Editor' access to all projects in the organization.
Click 'SAVE' to save the changes.
Copyright © 2021 Cloudvisory Documentation, Fireeye Inc.
48
Repeat these steps for all the organizations
1.3 Provide Editor access to one or more GCP projects required for compliance and enforcement remediation (optional)
NOTE
If 'Editor' role has been assigned at the organization level in 1.2, this step can be skipped
This Service Account file now has read-only access to the organization. You can provide 'Editor' access to one or more GCP Projects in two other ways:
Provide access to all GCP Projects in one or more GCP Folders
Provide explicit access to a subset of GCP Projects You then assign a role and permissions to the account.
Follow the steps to provide folder or project level 'Editor' access:
In the top-left corner of the GCP Cloud Console, click: Menu > IAM & Admin > IAM
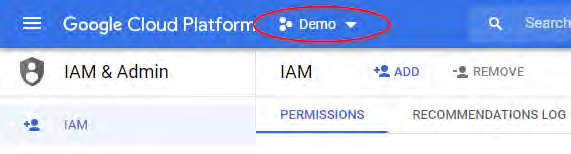
Select an option from the top drop-down menu.
Access to all projects in a GCP folder: Select the folder.
Access to a subset of GCP Projects: Select a project.
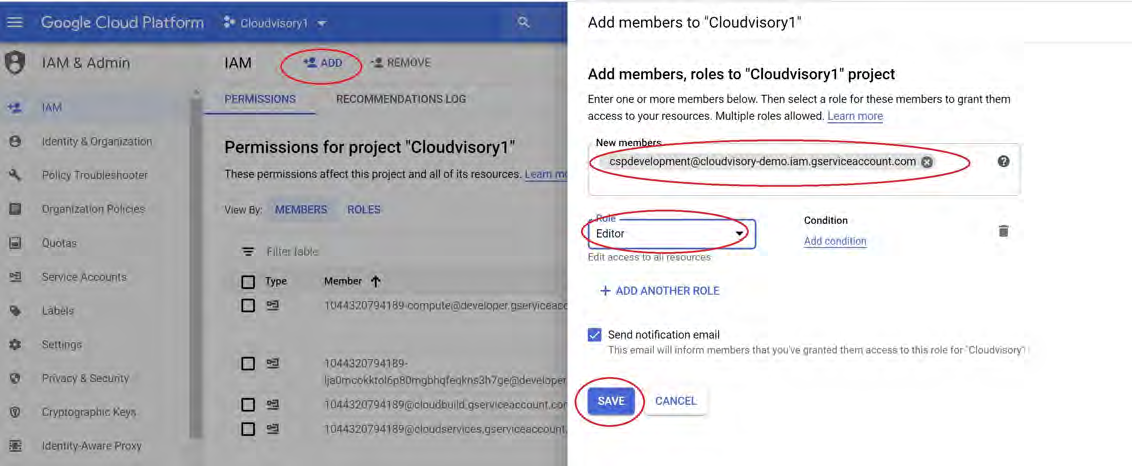
Click ADD to add the Service Account as member of the Folder or Project.
Search for and select the service-account - by typing the first few letters of the name and then selecting from the drop-down.
Select a Role and click CONTINUE:
Select ‘Editor’ to provide write permissions on the Folder / Project, to the service-account.
Click 'SAVE' to save the changes.
© 2021 Cloudvisory Documentation, Fireeye Inc.
Repeat these steps for all the folders and projects to be given Editor access
2. Create Firewall Logs subscription
GCP supports two types of network flow data: VPC Flow Logs and Firewall Rule Logs. Cloudvisory uses the Firewall Rule Logs for its network flow collection, reading logs/events from a topic in GCP Pub/Sub service. You need to create a Pub/Sub Topic to collect flows. Create only one Pub/Sub Topic to collect network flow events for each GCP Account, even if you have multiple GCP Projects in the same GCP Account. For multiple GCP Projects, Cloudvisory recommends that you create one Pub/Sub Topic with multiple Pub/Sub Subscriptions, one for each GCP Project.
2.1 Create the Pub/Sub topic (skip this step if you already have the Topic)
Select the project where you created the service-account.
In the top-left corner of the GCP Cloud Console, click: Menu > Big Data > Topics
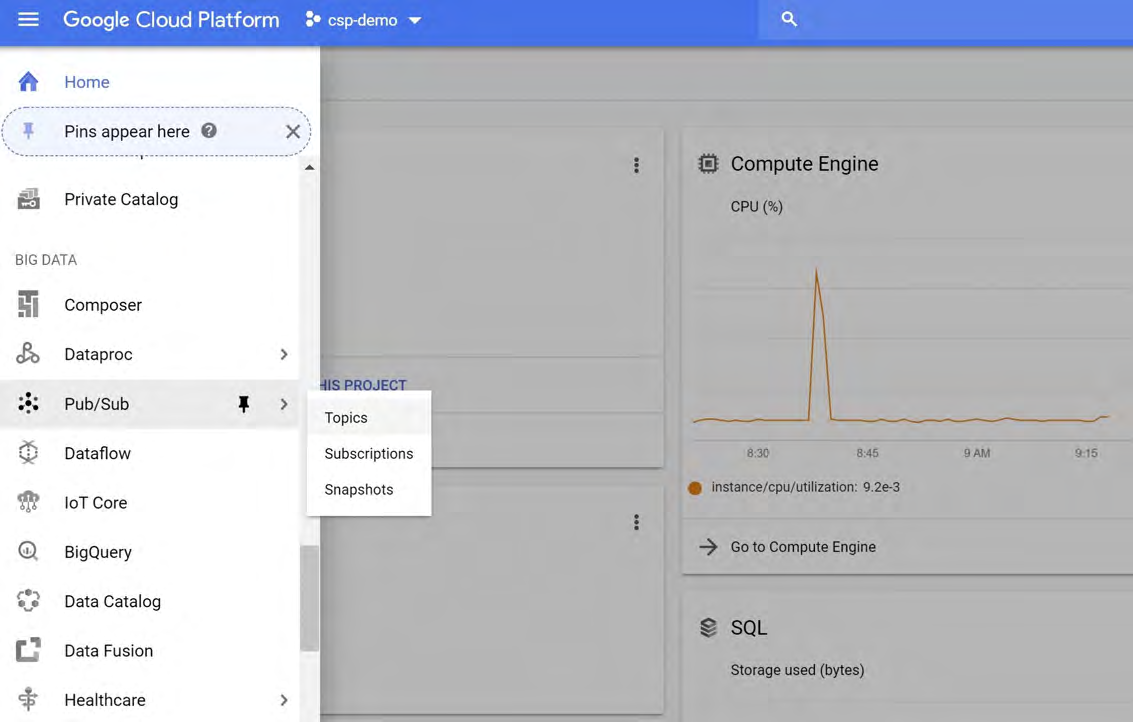
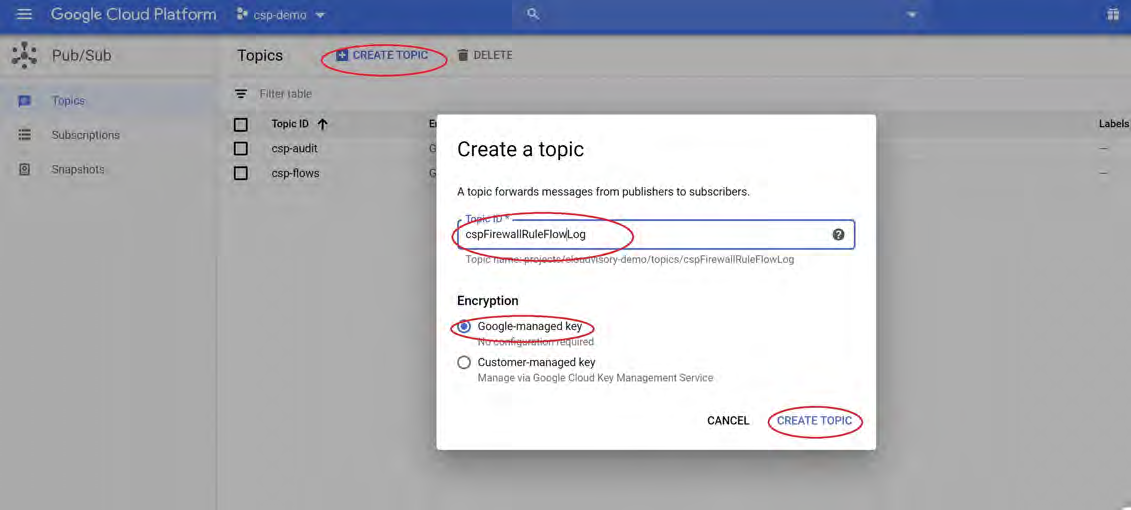
3. Click CREATE TOPIC on right panel and enter the following information:
Enter ‘cspFirewallRuleFlowLog’ as Topic ID.
Select Google-managed key.
Click CREATE TOPIC.
Copyright © 2021 Cloudvisory Documentation, Fireeye Inc.
50
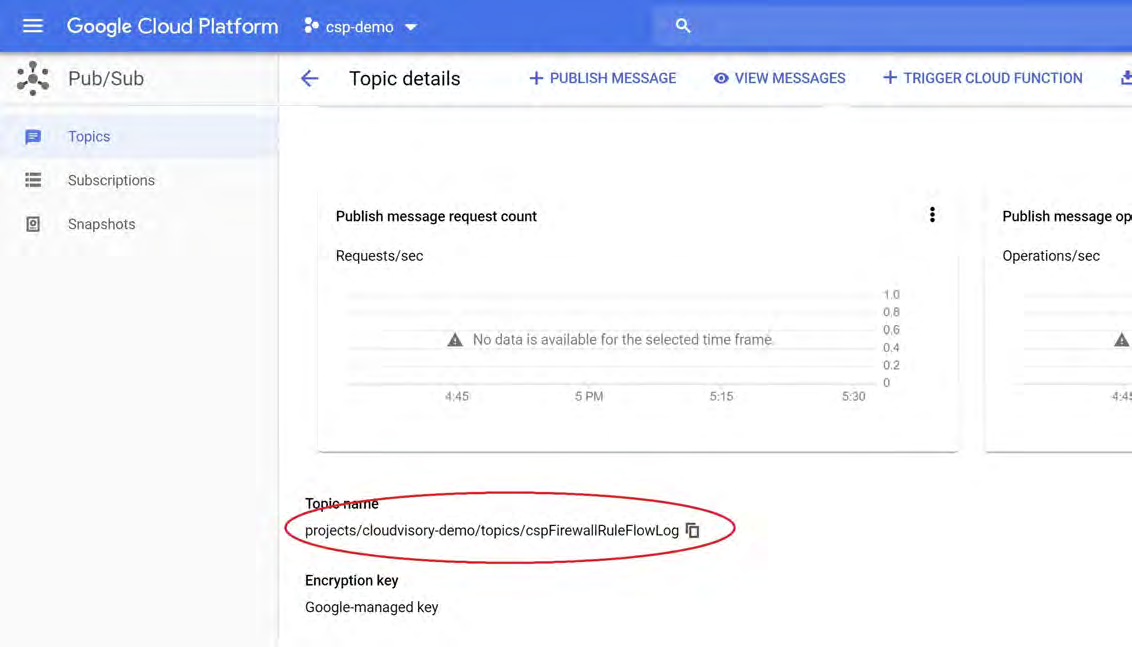
4. Note the Topic ID and Topic Name.
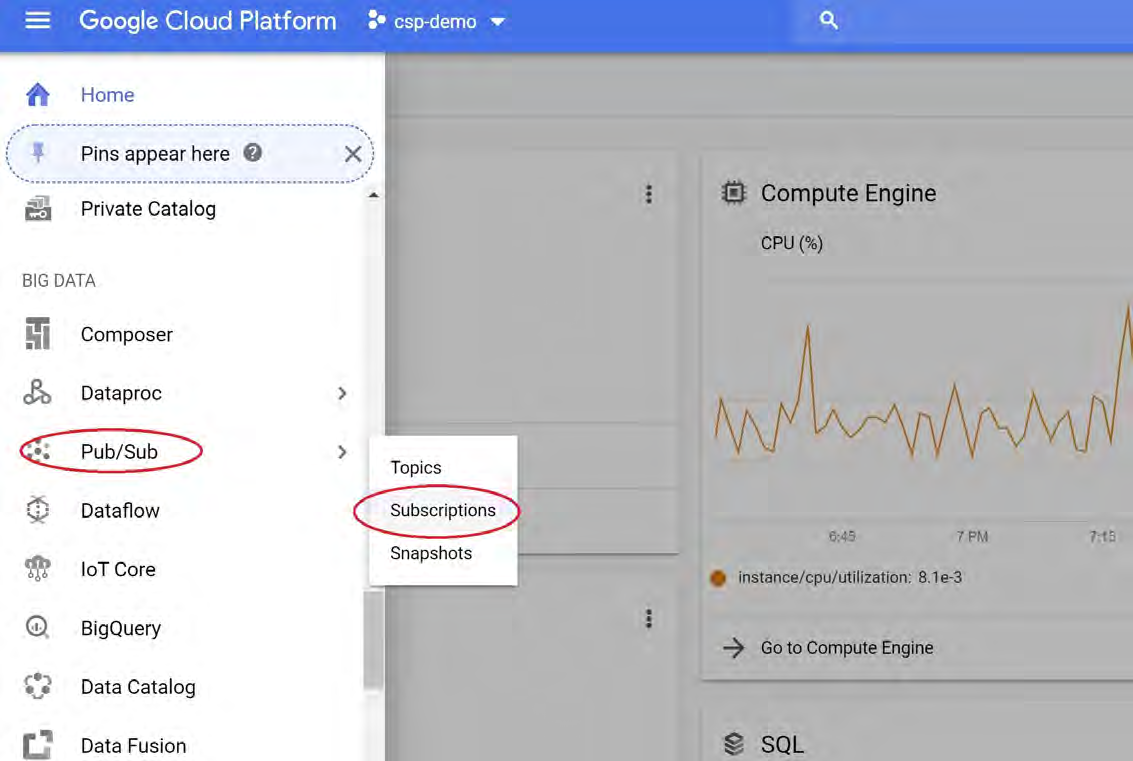
2.2 Create subscription for the cspFirewallRuleFlowLogSink
Select the GCP Project where you created the service-account.
In the top-left corner of the GCP Cloud Console, click: Menu > Pub/Sub > Subscription
Copyright © 2021 Cloudvisory Documentation, FireEye Inc.
51
3. Click CREATE SUBSCRIPTION.
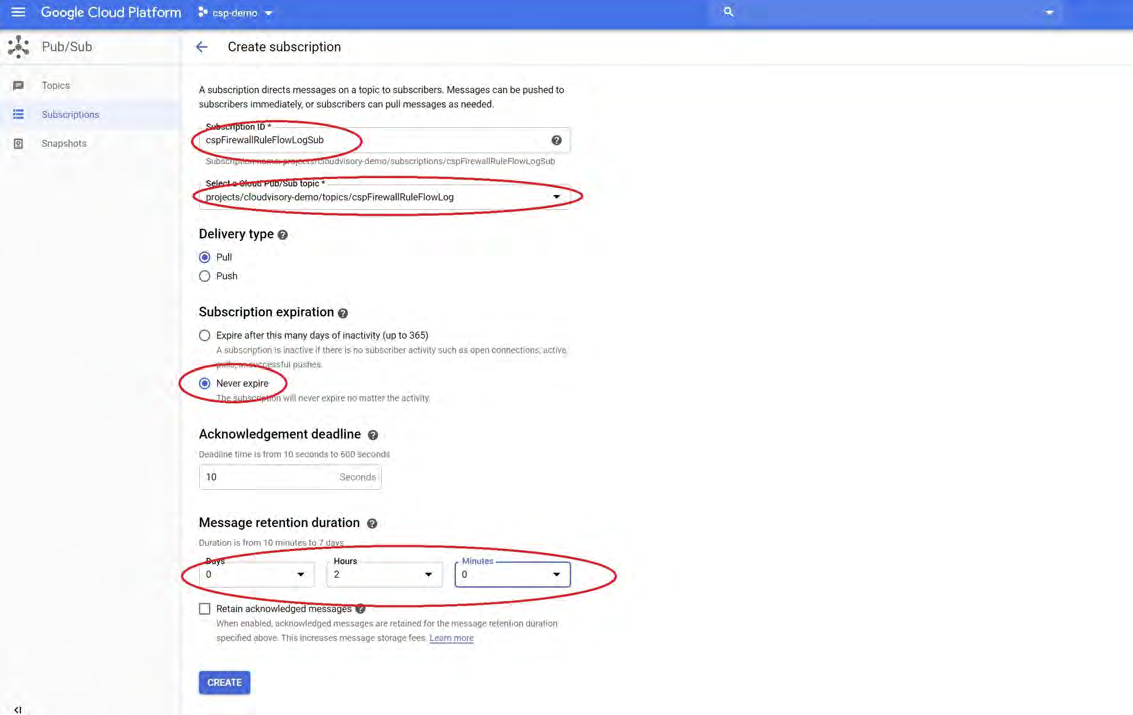
4. Enter details for the Pub/Sub Subscription:
Enter name, for example: cspFirewallRuleFlowLogSub.
Select the cspFirewallRuleFlowLog topic from the dropdown.
Select “Pull” as Delivery Type.
Select “Never Expire” for Subscription Expiration.
Select “2 Hours” for Message retention duration.
Click CREATE.
Copyright © 2021 Cloudvisory Documentation, FireEye Inc.
52
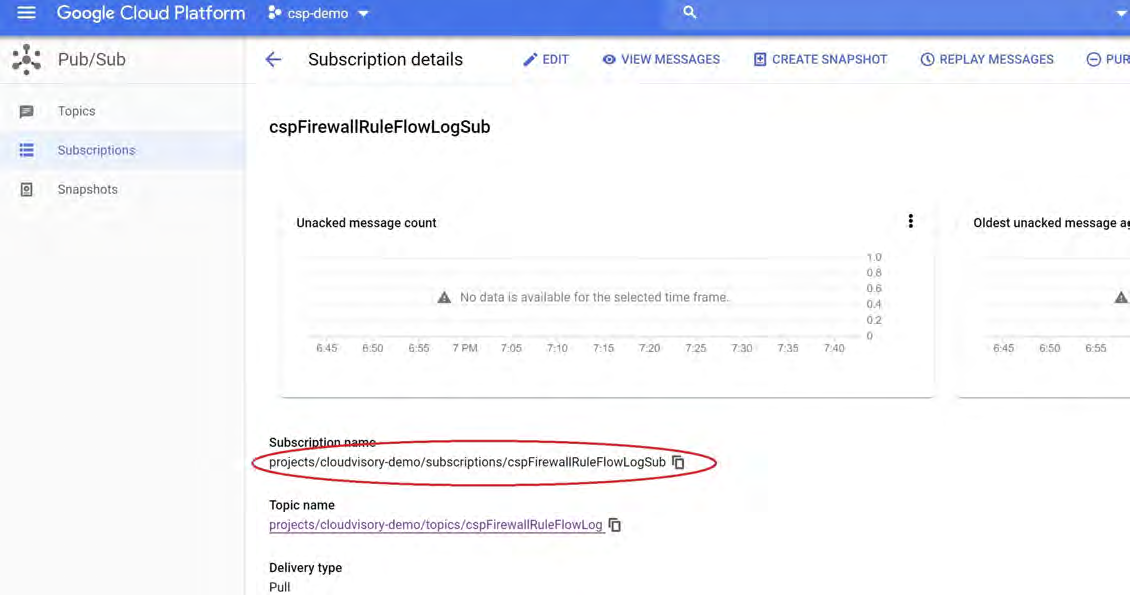
5. Copy the Subscription name.
This value can be entered in Firewall Logs Subscription Name field in the Cloudvisory UI.
2.3 Forward Firewall Logs to the 'cspFirewallRuleFlowLog' topic
To forward GCP Firewall Rule Logs to a topic, one or more GCP Log Sinks must be created. A Log Sink can be created for each individual GCP Project being managed by Cloudvisory. However, this can be labor intensive if there are a large number of Projects or if new Projects are added. Therefore, Cloudvisory strongly recommends creating a Log Sink for the entire GCP Organization, or – if required for a particular customer use-case – for a subset of GCP Folders.
The Log Sink can be created using gcloud CLI commands or using Google Cloud Console. Both are described below:
Create a Log sink for 'cspFirewallRuleFlowLog' topic using gcloud command
Click Activate Cloud Shell in the top right corner. A Log Sink can be created for the GCP Organization, Folder or Project. Depending on your service-account configuration and its membership, copy one of the following commands, update it with appropriate values, and then execute it in the shell. Make a copy of the command output.
Create a Log Sink for a GCP Organization:
Copyright © 2021 Cloudvisory Documentation, Fireeye Inc.
gcloud logging sinks create {cspFirewallRuleFlowLogSink} pubsub.googleapis.com/projects/{topic-project-id}/topics/{cspFirewallRuleFlowLog} --log-filter='logName:("compute.googleapis.com%2Ffirewall")' --include-children --organization={organization-id}{topic-project-id}: The project ID of the project hosting the {cspFirewallRuleFlowLog} log topic.
{cspFirewallRuleFlowLog}: Name of the flow log topic.
{organization-id}: The Organization ID.
The command creates a service-account ID. Copy the identity and add it as member in the {cspFirewallRuleFlowLog} topic with ‘Pub/Sub Publisher’ role.
Create a Log Sink for a GCP Folder:
gcloud logging sinks create {cspFirewallRuleFlowLogSink} pubsub.googleapis.com/projects/{topic-project-id}/topics/{cspFirewallRuleFlowLog} --log-filter='logName:("compute.googleapis.com%2Ffirewall")' --include-children --folder={folder-id}{cspFirewallRuleFlowLogSink}: Name of the log sink.
{cspFirewallRuleFlowLog}: Name of the flow log topic.
{topic-project-id}: The ID of the Project hosting the {cspFirewallRuleFlowLog} Pub/Sub Topic.
{folder-id}: The ID of the GCP Folder for which logs will be collected. To collect logs for multiple GCP Folders, run the command separately for each folder.
The command creates a service-account ID. Copy the identity and add it as member in the {cspFirewallRuleFlowLog} topic with ‘Pub/Sub Publisher’ role.
Create a Log Sink for a GCP Project:
gcloud logging sinks create {cspFirewallRuleFlowLogSink} pubsub.googleapis.com/projects/{topic-project-id}/topics/{cspFirewallRuleFlowLog} --log-filter='logName:("compute.googleapis.com%2Ffirewall")' --project={project-id}{cspFirewallRuleFlowLogSink}: Name of the log sink.
{cspFirewallRuleFlowLog}: Name of the flow log topic.
{topic-project-id}: The ID of the Project hosting the {cspFirewallRuleFlowLog} Topic.
{project-id}: The ID of the GCP Project for which logs will be collected. To collect logs for multiple GCP Projects, run the command separately for each project.
The command creates a service-account ID. Copy the identity and add it as member in the {cspFirewallRuleFlowLog} topic with ‘Pub/Sub Publisher’ role.
Create a Log Sink for the ‘cspFirewallRuleFlowLog’ topic using Google Cloud Console (For Project only)
Select the project where you created the service-account.
In the top-left corner of the Google Cloud Console, click: Menu > Logging > Log Viewer
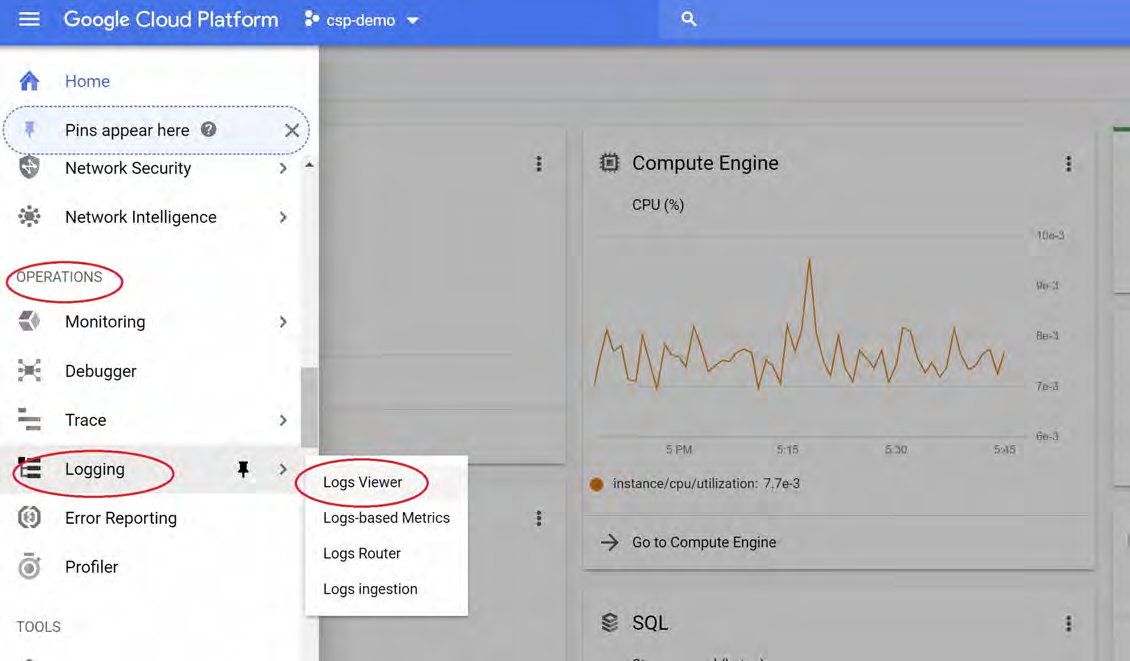
3. In the top empty field used for “Field by label or text seach”, click on the down arrow at the far right end of the field and select the option “Convert to advanced filter.”
Copyright © 2021 Cloudvisory Documentation, Fireeye Inc.

Replace “resource.type …” with this filter spec:
logName:(projects/{projectID}/logs/compute.googleapis.com%2Ffirewall)Replace {projectID} with the ID of the project being configured.
4. Click Submit Filter.

All Firewall Rules log entries are displayed. You should see multiple lines with network flow information, similar to: 2020-02-24 14:59:16.134 CST{"connection": {"protocol":6,"dest_port":22,"src_port":48865,"dest_ip":"10.168.0.2","src_ip":"164.132.110.223"}, ...
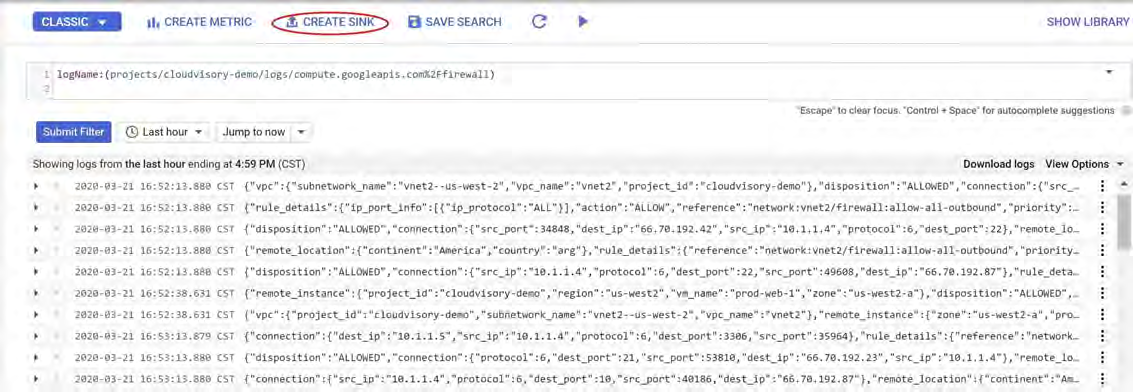
5. Click Create Sink on the top of the page to create a sink to forward logs to the Pub/Sub topic.
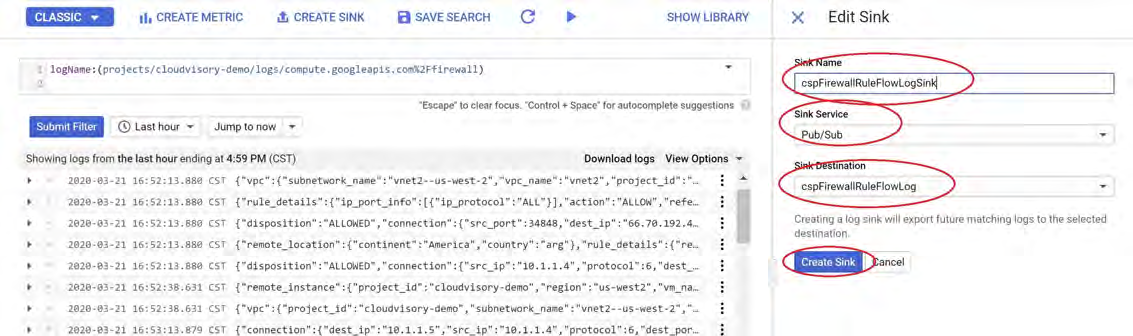
6. Enter details in the Edit Sink panel:
Enter the Sink Name, for example:
cspFirewallRuleFlowLogSink.Select “Pub/Sub” in the Sink Service field.
Select ‘cspFirewallRuleFlowLog’ from the dropdown in the Sink Destination field.
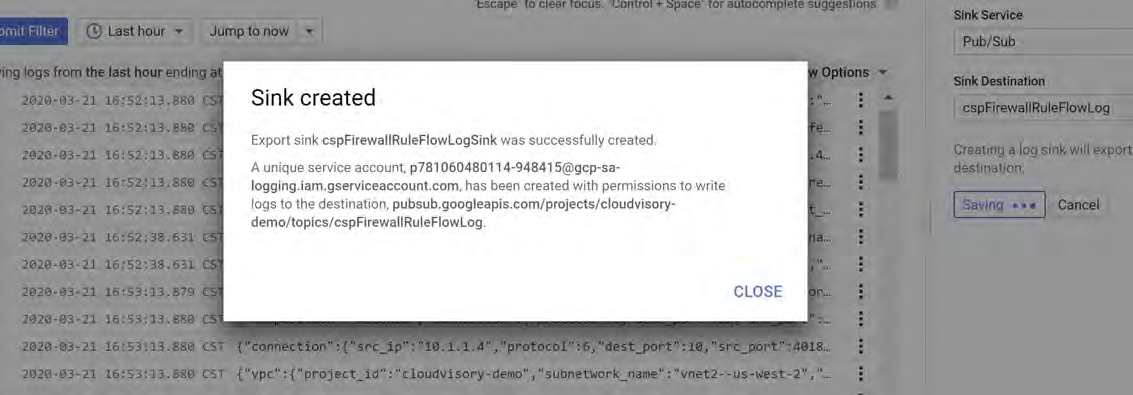
7. Click Create Sink.
8. Click Close in the confirmation screen.
Copyright © 2021 Cloudvisory Documentation, Fireeye Inc.
9. Click Logs Router on the Logging panel and verify the newly created sink.
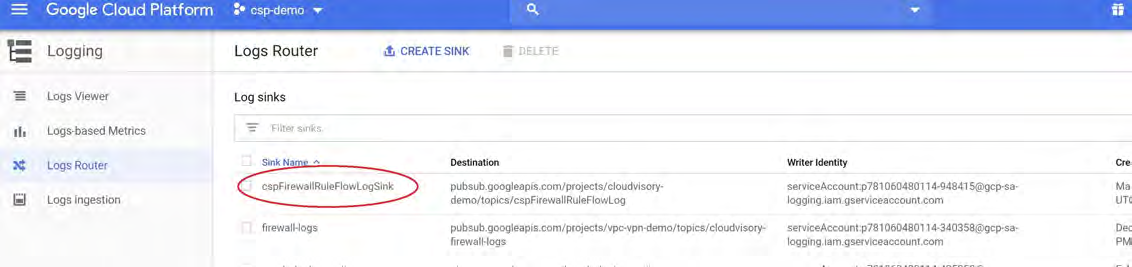
To configure logging service in more projects, follow the steps above. You will need the Project ID and Topic ID of the cspFirewallRuleFlowLog topic. In the Edit Sink panel (Step 6), enter the following:
Enter the Sink Name, for example: cspFirewallRuleFlowLogSink
Select "Pub/Sub" in "Sink Service" field.
Select 'Use a Cloud Pub/Sub topic in another project' from the dropdown in the Sink Destination field.
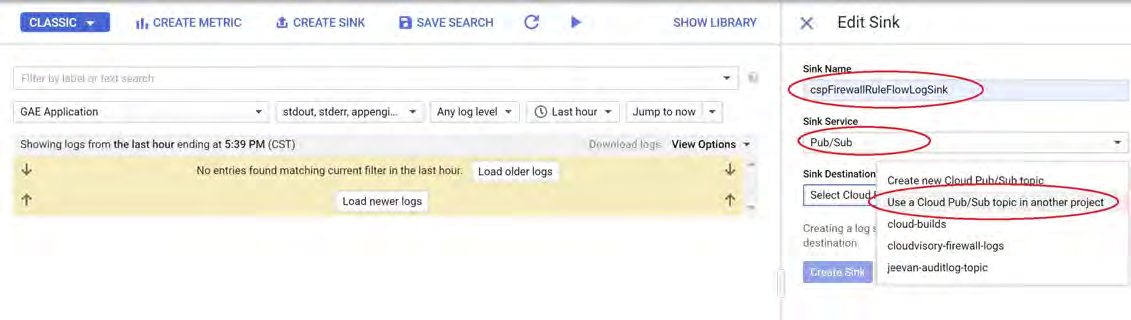
Update the Sink Destination field with the Project ID and Topic ID of the cspFirewallRuleFlowLog topic.
Click Create Sink and verify the new sink, as in Steps 7-9 above.
3. Create Audit Logs Subscription
3.1 Create a Pub/Sub topic for publishing audit logs:
Select the project where you created the service-account.
In the top-left corner of the GCP Cloud Console, click: Menu > Big Data > Topics
Copyright © 2021 Cloudvisory Documentation, Fireeye Inc.
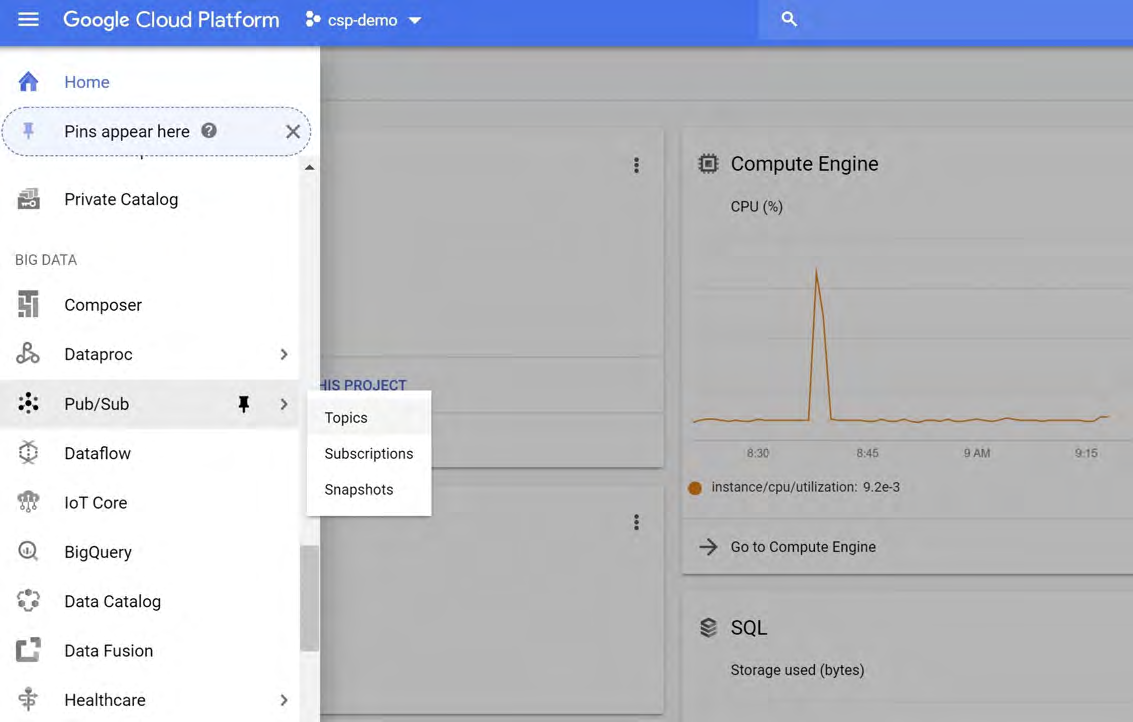
3. Click CREATE TOPIC near top of screen and enter the following information:
Enter ‘cspAuditLog’ as Topic ID.
Select Google-managed key.
Click CREATE TOPIC.
[IMAGE PLACEHOLDER: Create a topic modal dialog showing Topic ID field populated with “cspAuditLog”, Encryption options with Google-managed key selected, and CANCEL and CREATE TOPIC buttons visible.]
4. Note the Topic ID and Topic Name.
Copyright © 2021 Cloudvisory Documentation, Fireeye Inc.
57
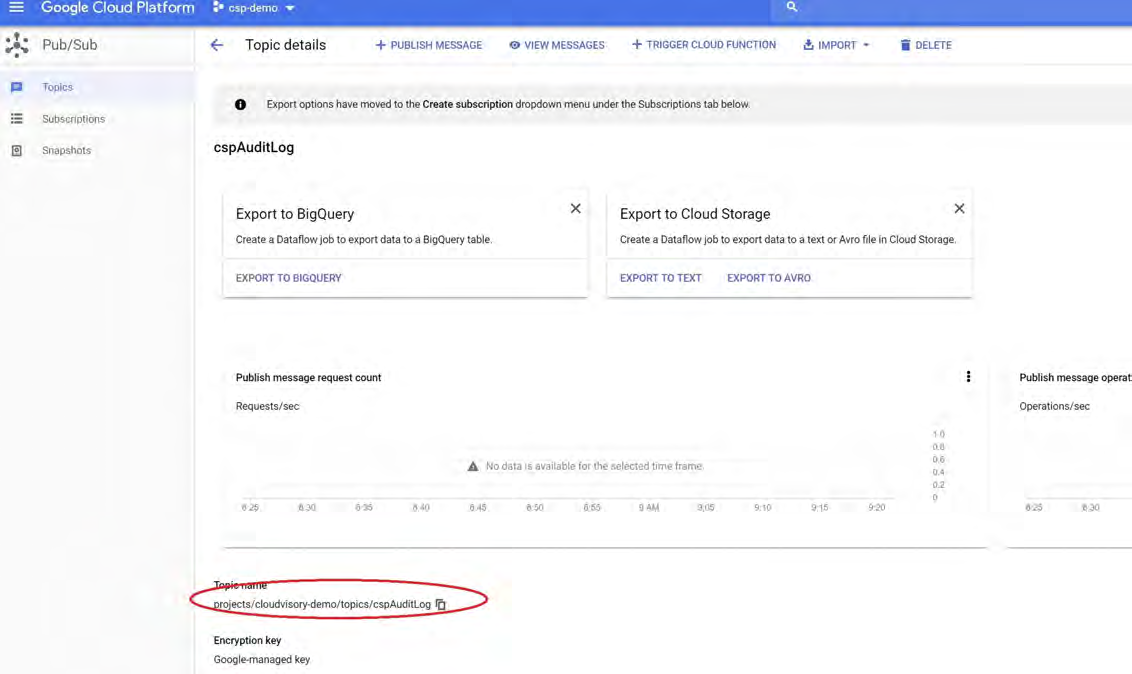
3.2 Create a Pub/Sub subscription to consume audit Logs from the Pub/Sub topic
Select the GCP Project where you created the service-account.
In the top-left corner of the GCP Cloud Console, click: Menu > Pub/Sub > Subscription
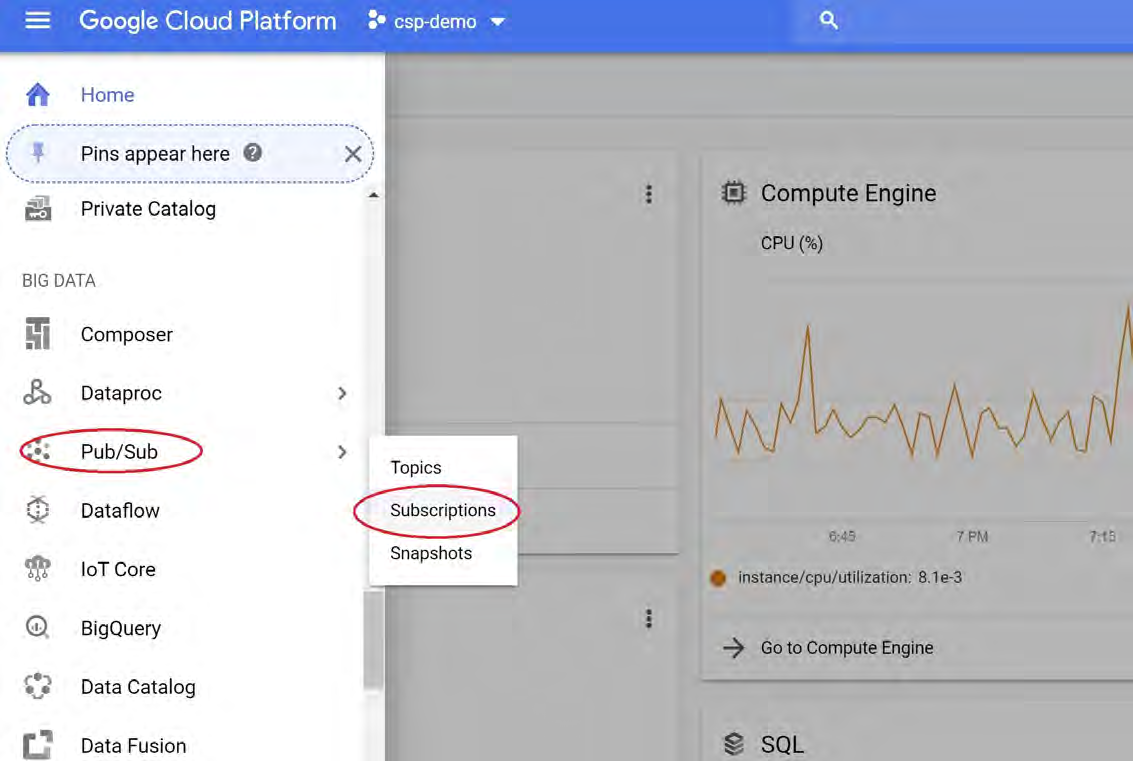
3. Click CREATE SUBSCRIPTION and enter the following details for the Pub/Sub Subscription:
Enter the name, for example: cspAuditLogSub.
Select ‘cspAuditLog’ topic from the dropdown.
Select "Pull" as Delivery Type.
Select "Never Expire" for Subscription Expiration.
Copyright © 2021 Cloudvisory Documentation, Fireeye Inc.
58
Select “2 Hours” for Message retention duration.
Click CREATE.
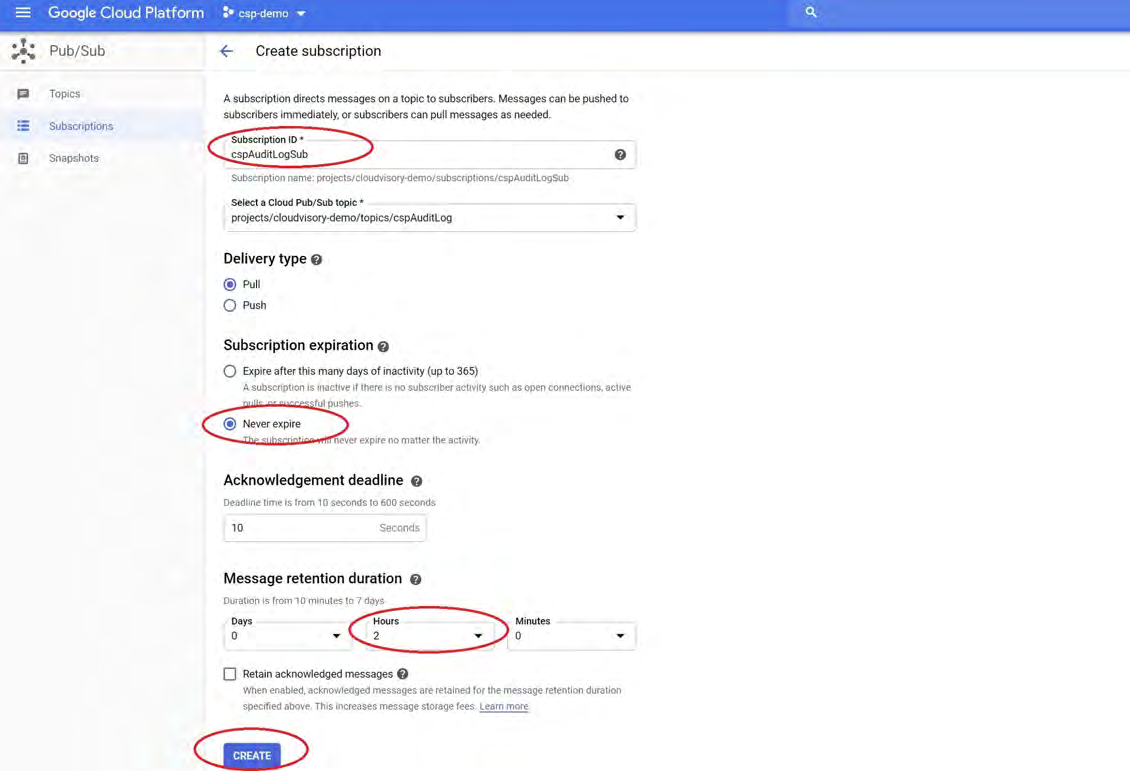
4. Copy the Subscription name. This value can be entered in the Audit Logs Subscription Name field in the Cloudvisory UI.
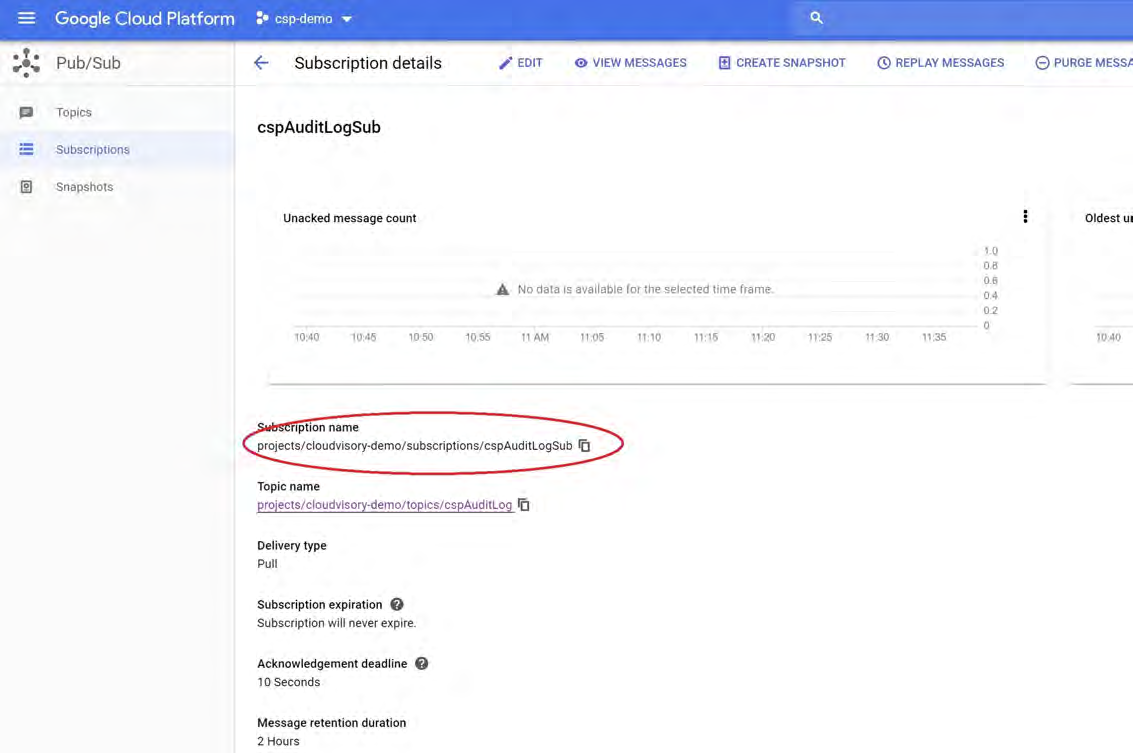
3.3 Forward GCP audit logs to the ‘cspAuditLog’ topic
Copyright © 2021 Cloudvisory Documentation, Fireeye Inc.
59
To forward Audit Logs to a PubSub Topic, one or more GCP Log Sinks must be created. A Log Sink can be created for each individual GCP Project being managed by Cloudvisory. However, this can be labor intensive if there are a large number of Projects or if new Projects are added. Therefore, Cloudvisory strongly recommends creating a Log Sink for the entire GCP Organization, or – if required for a particular customer use-case – for a subset of GCP Folders
The Log Sink can be created using gcloud CLI commands or using Google Cloud Console. Both are described below:
Creating a Log sink for the ‘cspAuditLog’ topic using gcloud command
Click Activate Cloud Shell in the top right corner. A Log Sink can be created for GCP Organization, Folder or Project. Depending on your service-account configuration and its membership, copy one of the following commands, update it with appropriate values, and then execute it in the shell. Make a copy of the command output.
Create a Log Sink for a GCP Organization:
gcloud logging sinks create {cspAuditLogSink} pubsub.googleapis.com/projects/{topic-project-id}/topics/{cspAuditLog} --log-filter='logName:("cloudaudit.googleapis.com%2Factivity" OR "cloudaudit.googleapis.com%2Fdata_access" OR "cloudaudit.googleapis.com%2Fsystem_event")' --include-children --organization={organization-id}{cspAuditLogSink}: Name of the log sink.
{cspAuditLog}: Name of the audit log.
{topic-project-id}: The ID of the Project hosting the {cspAuditLog} Pub/Sub Topic.
{organization-id}: The ID of the GCP Organization.
The command creates a service-account ID. Copy the identity and add it as member in the {cspAuditLog} topic with ‘Pub/Sub Publisher’ role.
Create a log sink for a GCP Folder:
gcloud logging sinks create {cspAuditLogSink} pubsub.googleapis.com/projects/{topic-project-id}/topics/{cspAuditLog} --log-filter='logName:("cloudaudit.googleapis.com%2Factivity" OR "cloudaudit.googleapis.com%2Fdata_access" OR "cloudaudit.googleapis.com%2Fsystem_event")' --include-children --folder={folder-id}{cspAuditLogSink}: Name of the log sink.
{cspAuditLog}: Name of the audit log.
{topic-project-id}: The ID of the Project hosting the {cspAuditLog} Pub/Sub Topic
{folder-id}: The ID of the GCP Folder for which logs will be collected. To create log sinks for multiple GCP Folders, run the command separately for each folder.
The command creates a service-account ID. Copy the identity and add it as member in the {cspAuditLog} topic with ‘Pub/Sub Publisher’ role.
Create a log sink for audit log for a GCP Project:
gcloud logging sinks create {cspAuditLogSink} pubsub.googleapis.com/projects/{topic-project-id}/topics/{cspAuditLog} --log-filter='logName:("cloudaudit.googleapis.com%2Factivity" OR "cloudaudit.googleapis.com%2Fdata_access" OR "cloudaudit.googleapis.com%2Fsystem_event")' --project={project-id}{cspAuditLogSink}: Name of the log sink.
{cspAuditLog}: Name of the audit log.
{topic-project-id}: The ID of the Project hosting the {cspAuditLog} Pub/Sub Topic
{project-id}: The ID of the GCP Project for which logs will be collected. To create log sinks for multiple GCP Projects, run the command separately for each project.
The command creates a service-account ID. Copy the identity and add it as member in the {cspAuditLog} topic with ‘Pub/Sub Publisher’ role.
Creating a Log sink for ‘cspAuditLog’ Topic using GCP Cloud Console (for Projects only)
Select the project where you created the service-account.
In the top-left corner of the GCP Cloud Console, click: Menu > Logging > Log Viewer
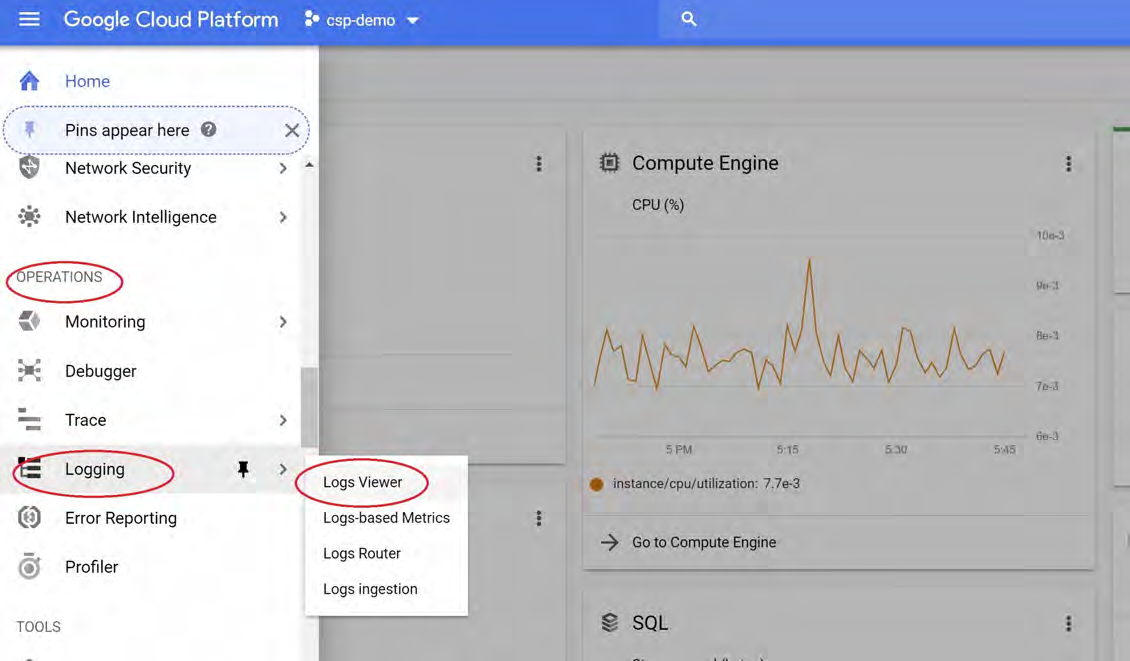
3. In the top empty field used for "Field by label or text seach", click on the "down" arrow at the far right end of the field and select "Convert to advanced filter."

Replace the “resource.type ...” filter with this filter spec: logName=("projects/{projectID}/logs/cloudaudit.googleapis.com%2Factivity" OR "projects/{projectID}/logs/cloudaudit.googleapis.com%2Fdata_access" OR "projects/{projectID}/logs/cloudaudit.googleapis.com%2Fsystem_event")
Replace {projectID} with the ID of the project being configured.
4. Click Submit Filter.
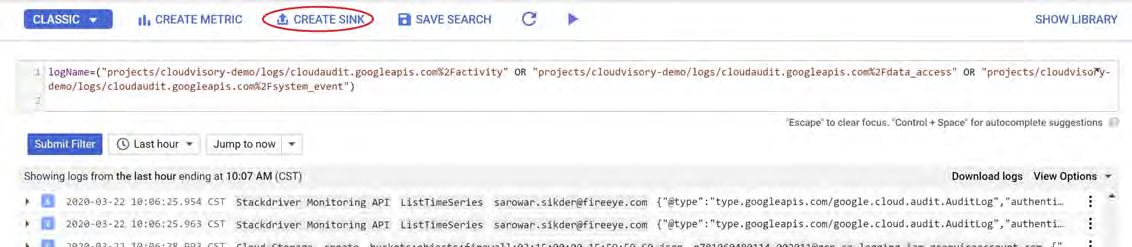
5. Click Create Sink at the top of the page to create a sink to forward logs to the Pub/Sub topic.
[IMAGE PLACEHOLDER: Edit Sink panel screenshot showing fields for Sink Name, Sink Service, and Sink Destination; example selections include "Pub/Sub" and a dropdown with "cspAuditLog".]
6. Enter details in the Edit Sink panel:
Enter Sink Name, for example: cspAuditLogSink.
Select "Pub/Sub" in "Sink Service" field.
Select 'cspAuditLog' from dropdown in Sink Destination field.
7.Click Create.Sink.
Copyright © 2021 Cloudvisory Documentation, Fireeye Inc.
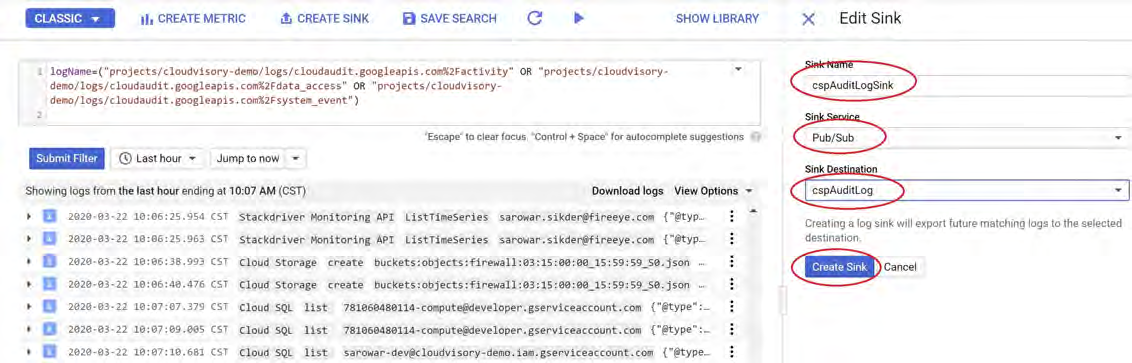
8. Click Close in the confirmation screen.
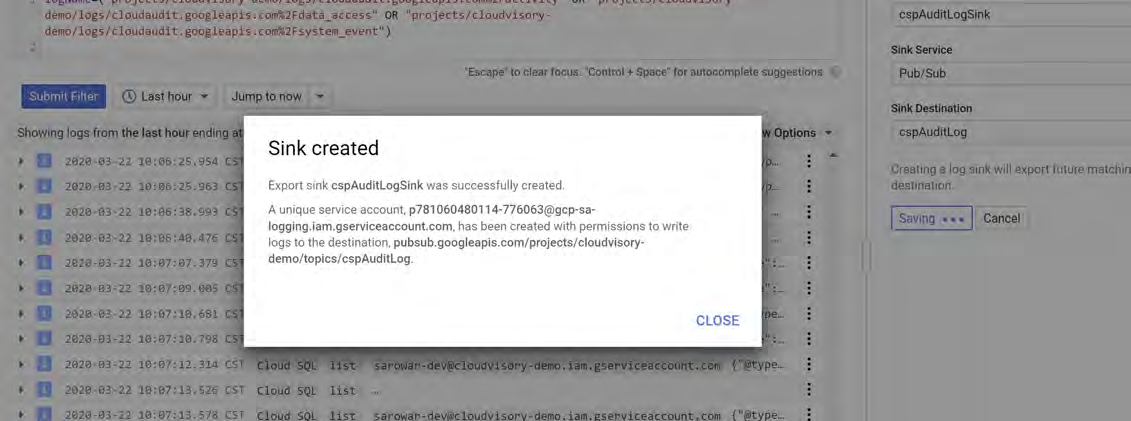
9. Click Logs Router on the Logging panel and verify the newly created sink.
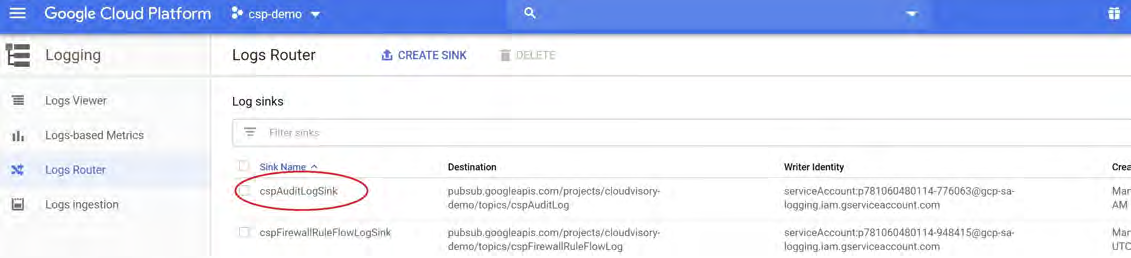
To configure logging service in more projects, follow the steps above. You will need the Project ID and Topic ID of the 'cspAuditLog' topic.
In the Edit Sink panel (Step 6), enter the following:
Enter Sink Name, for example: cspAuditLogSink.
Select 'Pub/Sub' in 'Sink Service' field.
Select 'Use a Cloud Pub/Sub topic in another project' from the dropdown in Sink Destination field.
Copyright © 2021 Cloudvisory Documentation, Fireeye Inc.
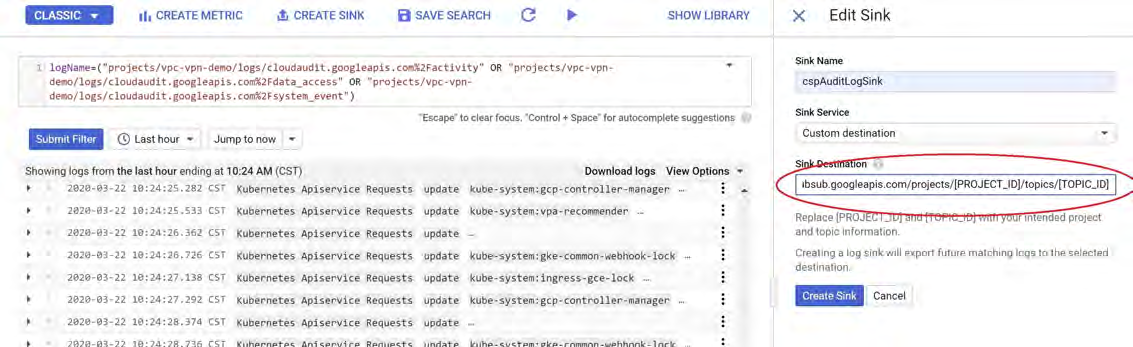 /topics/[TOPIC_ID]).]
Click Create Sink and verify the new sink, as in Steps 7-9 above.
4. Onboarding GCP Provider Accounts in Cloudvisory
Enter account information
Log into the Cloudvisory UI.
Click: Admin Settings > Providers.
Click GCP on the left panel.
Click Add Account.
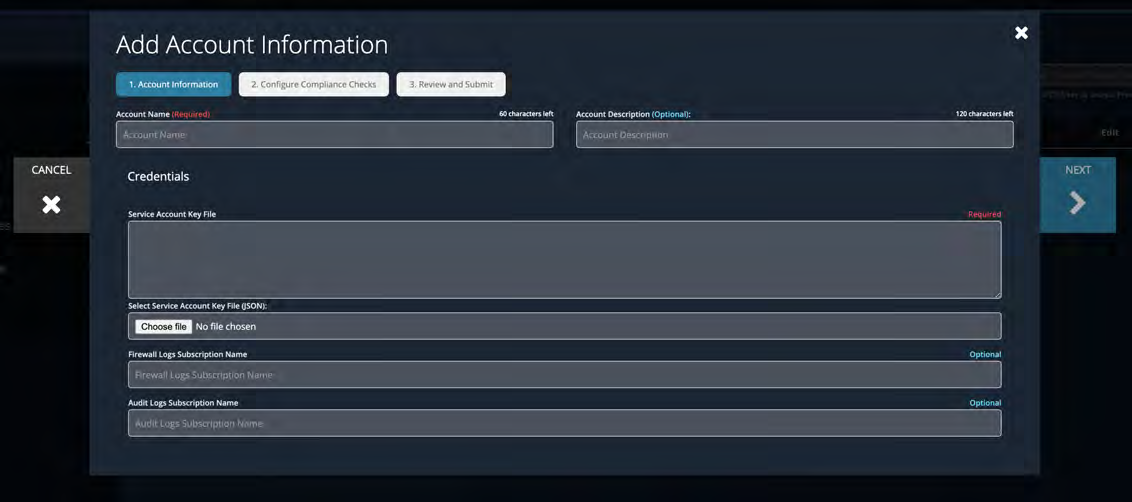
Enter the Account Name.
Enter Account Description (optional)
Select the Service Account File.
TIP
Use the "Choose file" button to upload the Service Account Key File (JSON).
Copyright © 2021 Cloudvisory Documentation, Fireeye Inc.
8. Enter the Firewall Logs Subscription Name (optional).
9. Enter the Audit Logs Subscription Name (optional).
10. Click NEXT.
Configure Compliance checks
Select an option for compliance checks.
Auto-Configure Compliance Checks: Cloudvsory will create a default compliance group with this provider account and will enable default compliance checks.
Will Configure Manually: You must configure a compliance group and add checks manually. See Compliance Group
TIP
Accept Auto-Configure Compliance Checks as a default selection and see how Cloudvsory configures the compliance group and checks after you add the provider account.
Click Next.
Review and click SUBMIT.
Kubernetes
Step-by-step guide
You need the following information to onboard a Kubernetes Provider Account in Cloudvisory:
Username: Kubernetes API username.
Password: Password associated with the above username.
HostURL: URL address of the Kubernetes API.
CAData: Kubernetes CA certificate (optional).
Master node Username: SSH user for master node.
Master node password or Keydata: The passphrase (password) for the username or the private key file or PEM file.
Master node IP(s) or the hostname(s).
Worker node Username: SSH user for worker nodes.
Worker node password or Keydata: The passphrase (password) for the username or the private key file or PEM file.
Worker node IP(s) or the hostname(s).
Adding an Kubernetes Account
Log into the Cloudvisory UI.
Click Admin Settings > Providers.
Select Kubernetes from the left panel.
Click Add Account.
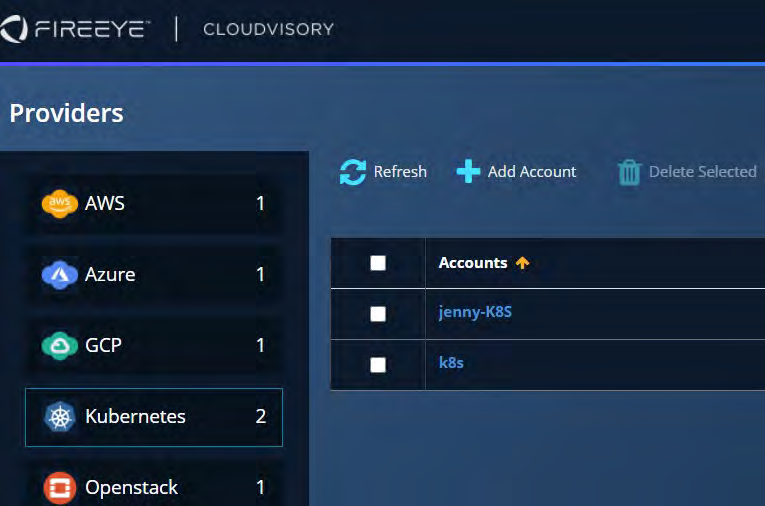
Enter the account name.
Enter the username of the Kubernetes machine.
Select the True option in Insecure.
Add CAData (optional).
Enter a description (optional).
© 2021 Cloudvisory Documentation, FireEye Inc.
65
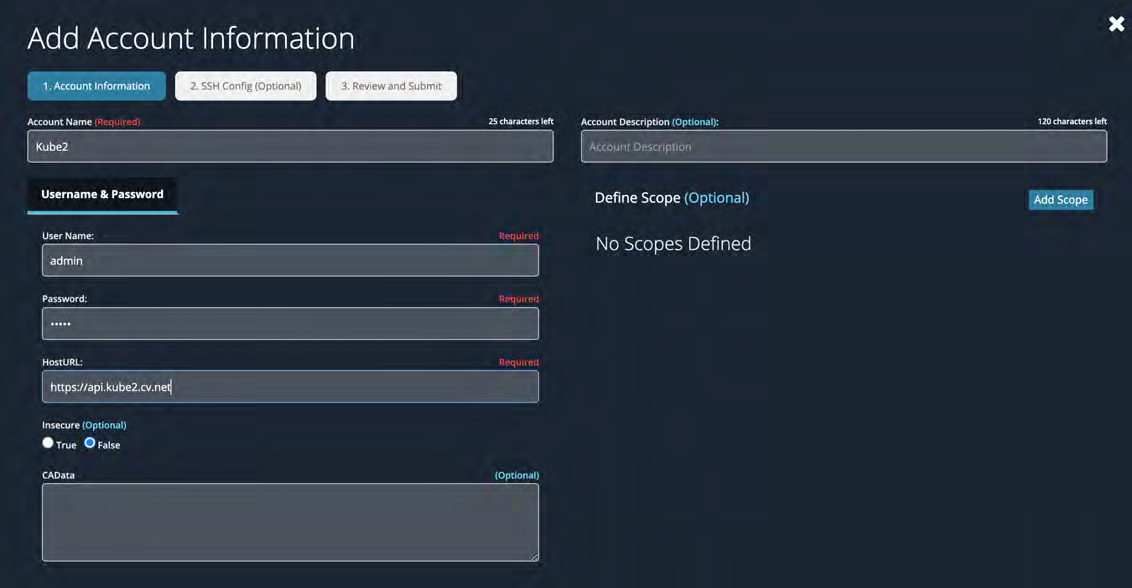
Click Next.
Select Compliance Checks if you want to enable compliance checks for Kubernetes nodes.
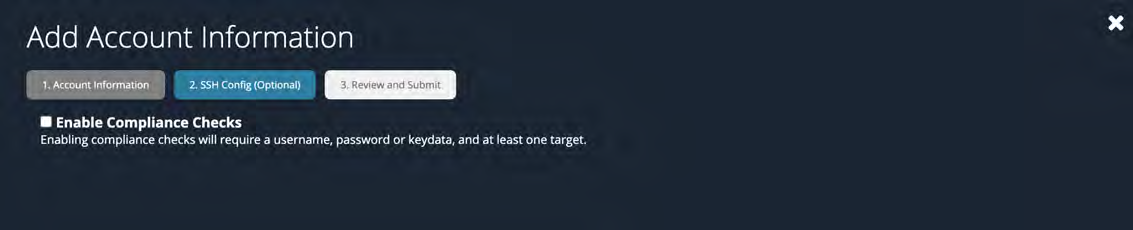
Select the Master Node tab.
Enter the port number or use the default, port 22.
Enter the SSH username of the master node.
Choose Password if you have the passphrase to connect to the master node, or choose Keydata and upload the private key or the PEM file associated with this master node.
Enter the IP address of the master node. Use commas to separate multiple IP addresses.
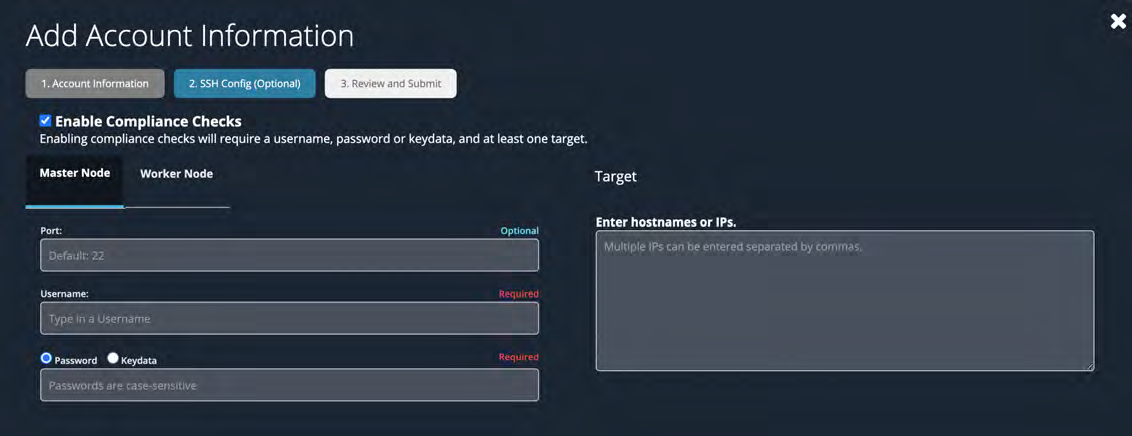
Select the Worker node tab.
Enter the port number or use the default, port 22.
Enter the SSH username of the worker node.
Choose Password if you have the passphrase to connect to the worker node, or choose Keydata and upload the private key or the PEM file associated with this worker node.
Enter the IP address of the worker node. Use commas to separate multiple IP addresses.
Copyright © 2021 Cloudvisory Documentation, Fireeye Inc.
66
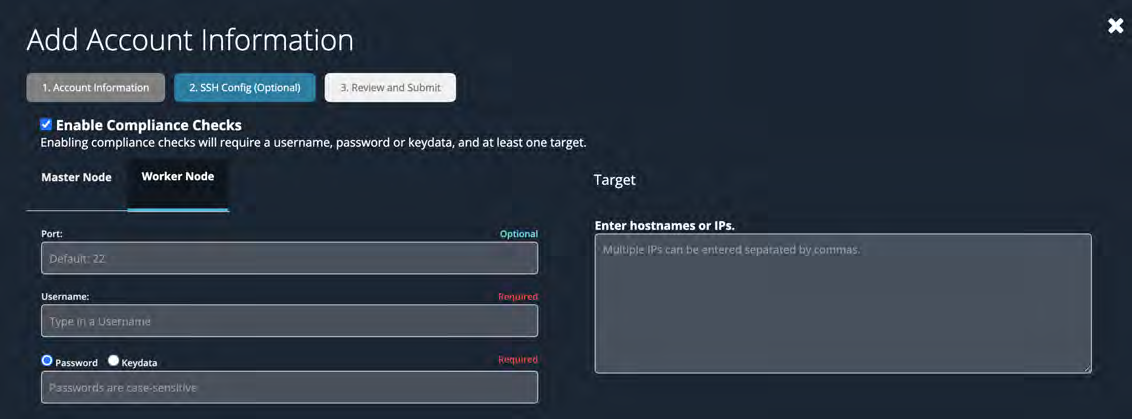
22. Click Next to review the data.
23. Click Submit to add the new Kubernetes account.
Copyright © 2021 Cloudvisory Documentation, Fireeye Inc.
67
OpenStack
Gathering Account Information
Keystone Auth V2 vs V3
Always use the Keystone V3 API. The Keystone V2 API has been deprecated by the OpenStack community and is not recommended for creating an OpenStack provider in Cloudvisory.
If the Keystone V2 API must be used, be aware that the Cloudvisory user must have a role pre-provisioned in each project it needs to manage.
Least Privilege Setup
The Cloudvisory Security Platform requires the ability to perform certain OpenStack API operations in order to discover, monitor, provision and enforce network security policies.
The Cloudvisory user requires the admin role on the project used to authenticate Cloudvisory into Openstack.
If you desire to deploy a least privilege model for the user credentials, you should define a new keystone role (for example, cvadmin) and modify/update the policy.json files to allow the actions defined below in the section "Openstack Permissions Needed by Cloudvisory".
Openstack Discovery Mode
The use of an admin role or a least privilege role is controlled by the OpenstackDiscoveryMode configuration parameter in the appcontrol.conf file. Select one of three discovery modes:
a) admin: The Cloudvisory user has the admin role in the Cloudvisory project specified during account creation. In this mode, all projects that satisfy the scope defined for the account are discovered and managed by Cloudvisory.
b) CvRole: The Cloudvisory user does not require the admin role. The only projects discovered are those for which the Cloudvisory user has the role specified by the OpenstackCvRole config option described below (constrained by scope).
c) AssignCvRole: The Cloudvisory user does not require the admin role. The Cloudvisory user is added to all projects covered by the account scope specification with the role defined in OpenstackCvRole.
In Keystone API version 3, the role used for CvRole and AssignCvRole modes can be the same cvadmin role used during the Openstack account creation in the Cloudvisory console, or it can be another role with fewer privileges. A standard member role can be used and recommended by Cloudvisory.
In Keystone API version 2.0:
Only the CvRole mode is supported.
The admin and AssignCvRole modes are not supported.
The OpenstackCvRole parameter is ignored.
Any role can be pre-provisioned in the projects to be discovered/managed using the CvRole mode, as long as it has the permissions needed by Cloudvisory. The standard member role is recommended.
Openstack Permissions Needed by Cloudvisory
The following permissions are needed by the role assigned to the Cloudvisory user in the project used to authenticate Cloudvisory into Openstack.
The OpenstackCvRole used to discover or to assign to discovered projects as described above does not need these permissions.
1) Keystone v3
List Domains (/v3/domains)
List Projects (/v3/projects)
List Services (/v3/services)
List Endpoints (/v3/endpoints)
List Roles
List Role Assignments
Get User
List Users
2) Keystone v2.0
List tenants (v2.0/tenants)
3) Nova
List Servers across all domains/projects (/servers)
List Servers Detailed across all domains/projects (/servers/detail)
List Hypervisors (/os-hypervisors)
List Hypervisors detailed (/os-hypervisors/detail)
List Hypervisor Servers (/os-hypervisors/{hypervisor_hostname_pattern}/servers)
Add Security Group to Server in any domain/project (/servers/{server_id}/action)
Remove Security Group from Server in any domain/project (/servers/{server_id}/action)
List Servers Metadata (/servers/{server_id}/metadata)
Update Servers Metadata (/servers/{server_id}/metadata) - only required if compliance attribute check remediation is needed.
4) Neutron
List Networks across all domains/projects(/v2.0/networks)
List Subnets across all domains/projects(/v2.0/subnets)
Copyright © 2021 Cloudvisory Documentation, Fireeye Inc.
List Floating IPs across all domains/projects(/v2.0/floatingips)
List Ports across all domains/projects(/v2.0/ports)
List Security Groups across all domains/projects (/v2.0/security-groups)
List Security Group Rules across all domains/projects (/v2.0/security-group-rules)
Create Security Group in any domain/project (/v2.0/security-groups)
Delete Security Group in any domain/project (/v2.0/security-groups)
Create Security Group Rule in any domain/project (/v2.0/security-group-rules)
Delete Security Group Rule in any domain/project (/v2.0/security-group-rules)
Be aware that hard-coded permission checks still exist in OpenStack and can make it difficult to define truly fine-grained permission models: https://docs.openstack.org/nova/latest/reference/policy-enforcement.html.
Note that OpenStack services policy.json files and the policy enforcement capabilities can vary based on the version of OpenStack and how they may have already customized for your deployment. Because each environment and deployment can be different, testing of permissions is required. It is important that the Cloudvisory user can perform all of the above actions across domains and projects. Below are some example policy entries that have been used in Cloudvisory testing. These snippets of the policy files show the pertinent entries for a cvadmin role.
Keystone policy.json example entries
{
<< SNIPPET >>>
"cvadmin": "role:cvadmin",
"identity:list_services": "rule:admin_required or role:cvadmin",
"identity:list_endpoints": "rule:admin_required or role:cvadmin",
"identity:list_domains": "rule:admin_required or role:cvadmin",
"identity:get_project": "rule:admin_required or project_id:%(target.project.id)s or rule:cvadmin",
"identity:list_projects": "rule:admin_required or role:cvadmin",
"identity:list_user_projects": "rule:admin or owner or rule:cvadmin",
"identity:list_roles": "rule:admin_required or role:cvadmin",
"identity:list_role_assignments": "rule:admin_required or role:cvadmin",
"identity:get_user": "rule:admin_or_owner or rule:cvadmin",
"identity:list_users": "rule:admin_required or role:cvadmin",
"identity:create_grant": "rule:admin_required or role:cvadmin"
<< SNIPPET >>>
}Nova policy.json example entries
{
<< SNIPPET >>>
"cvadmin": "role:cvadmin",
"context_is_admin": "role:admin",
"admin_or_owner": "is_admin:True or project_id:%(project_id)s",
"admin_api": "is_admin:True",
"default": "rule:admin_or_owner",
"os_compute_api:servers:detail:get_all_tenants": "is_admin:True or rule:cvadmin",
"os_compute_api:os-hypervisors": "rule:admin_api or rule:cvadmin",
"os_compute_api:os-extended-server-attributes": "rule:admin_api or rule:cvadmin",
"os_compute_api:os-hide-server-addresses": "rule:admin_api or rule:cvadmin"
<< SNIPPET >>>
}If compliance attribute check remediation is needed, the above should be replaced with:
{
<< SNIPPET >>>
"context_is_admin": "role:cvadmin or role:admin",
<< SNIPPET >>>
}(In theory, os_compute_api:server-metadata should suffice as part of the first snippet, but sometimes nova does not fully honor this policy during server metadata updates.)
Neutron policy.json example entries
For Neutron, make cvadmin part of the admin context to avoid issues doing port listings across projects.
{
<< SNIPPET >>>
"context_is_admin": "role:cvadmin or role:admin",
<< SNIPPET >>>
}SSH
Step-by-step guide
You need the following information to onboard an SSH Provider Account in Cloudvisory:
Username: Remote server ssh username.
Password/Keydata: Passphrase (password) for the username or the private key file or PEM file.
Hostname(s) or IP(s) address: Hostname or IP address of the remote server.
Adding an SSH account
Log into the Cloudvisory UI.
Click Admin Settings > Providers.
Select SSH from the left panel.
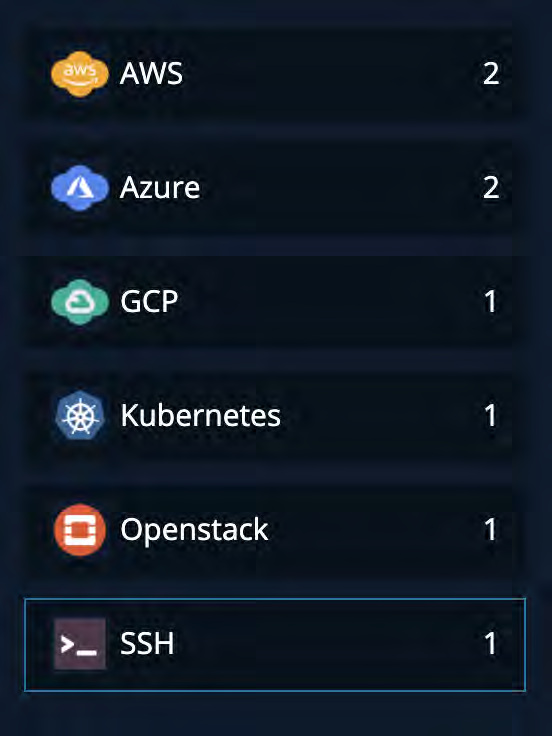
4. Click Add Account.

Enter the account name.
Enter an account description (optional).
Enter the port or use the default, port 22.
Enter the remote server ssh username.
Select Password if you have the passphrase to connect to remote server via SSH, or select Keydata and upload the private key or the PEM file associated with this account.
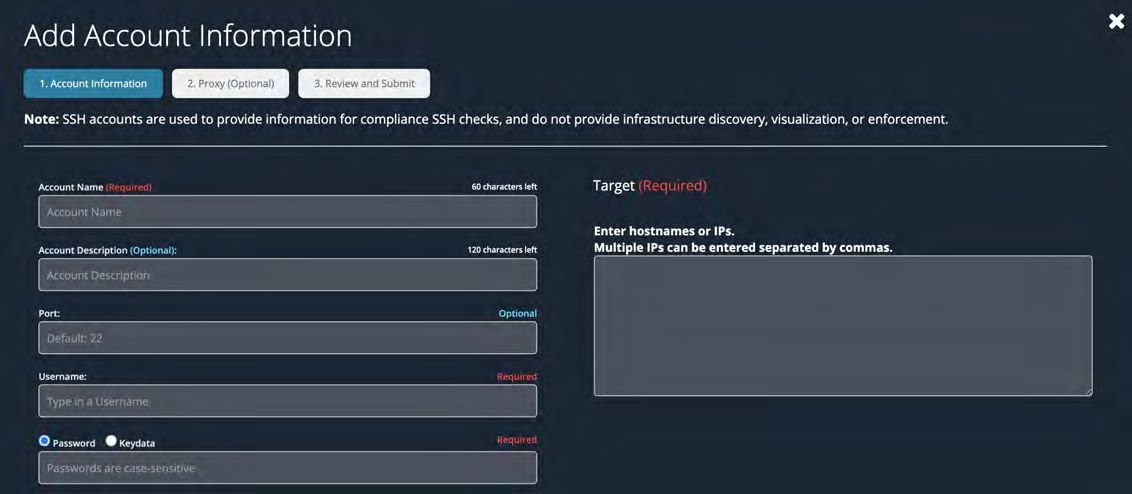
Copyright © 2021 Cloudvisory Documentation, Fireeye Inc.
Enter the IP address of the remote server. Use commas to separate multiple IP addresses.
Click Next to review the data.
Click Submit to add the new SSH account.
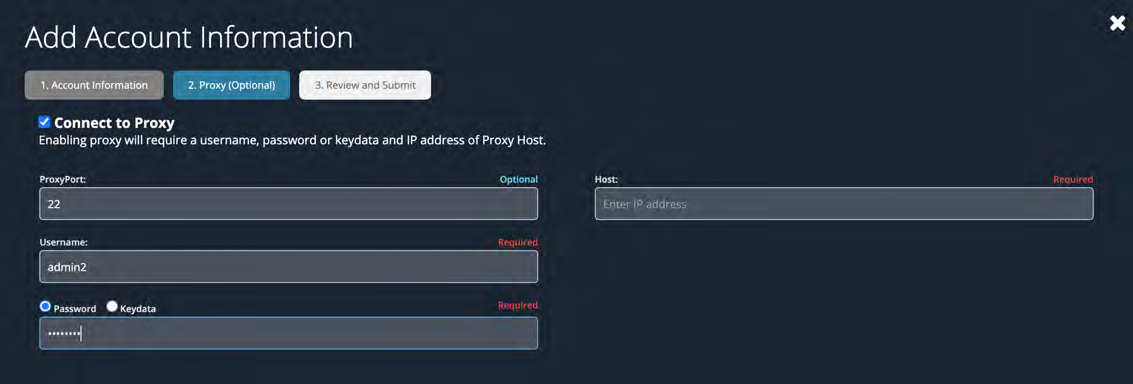
Click Next to review and submit the SSH account.
Copyright © 2021 Cloudvisory Documentation, Fireeye Inc.
Visualization
The Visualization screen displays all assets in the environment and the network flows to and from each asset. You can drill down to details of each asset and view its state, such as managed, unmanaged or quarantined.
Flows are monitored and reported by agents, the Azure API, and the AWS API. You can filter flows by type: compliant or non-compliant, successful or unduccesssful, allowed or blocked. You can view a summary of a flow's activity or drill down to details of an individual flow.
To narrow down the visualization further, you can create scopes limited to particular groups of assets.
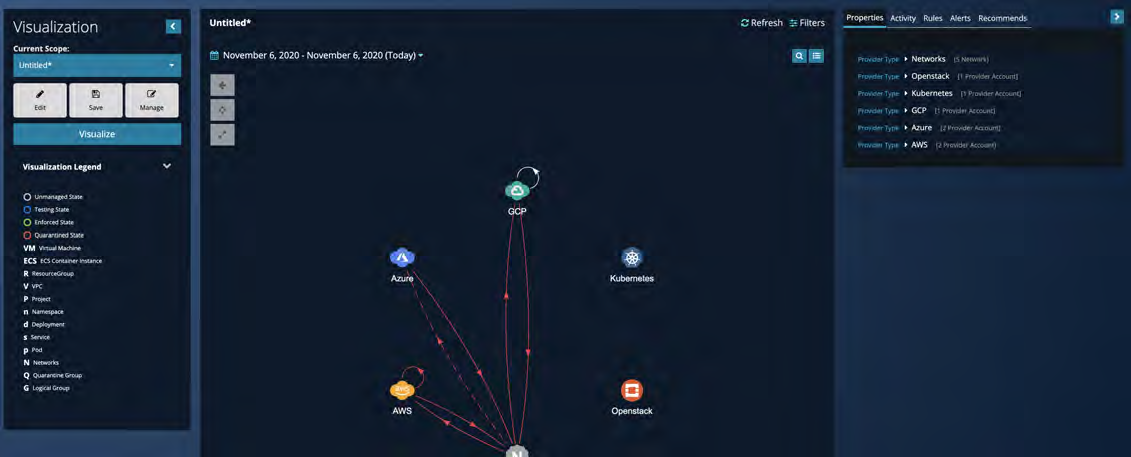
Assets are represented by shapes and icons. They represent all the different entities in a network, such as Cloud Providers, Networks, Projects, VPCs, and Workloads. Flows are represented by lines. Arrows on a flow represent the aggregation of flows for all servers in the project. Parent object names are shown as arcs.
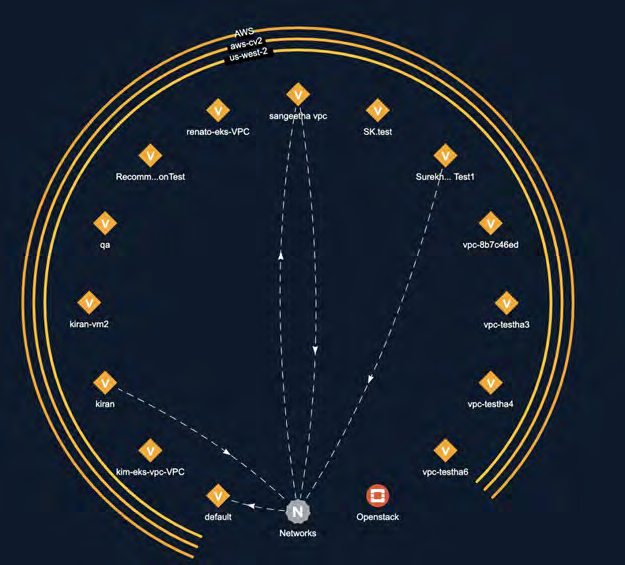
You can also quarantine assets that are out of compliance on the Visualization screen. You can quarantine assets manually, or enable rules for quarantining assets and flows automatically.
Viewing Assets
Double-click on an asset to expand it and reveal its children. The outer circle shows the context of the assets, so that you never lose track of which parent they belong to. The rings around some assets indicate their state: unmanaged, testing, enforced or quarantined. Workloads can be found in one of these states in the system at any point in time.
Filtering Assets
Access the filters by clicking Filters at the top of the visualization panel.
Copyright © 2021 Cloudvisory Documentation, Fireeye Inc.
72
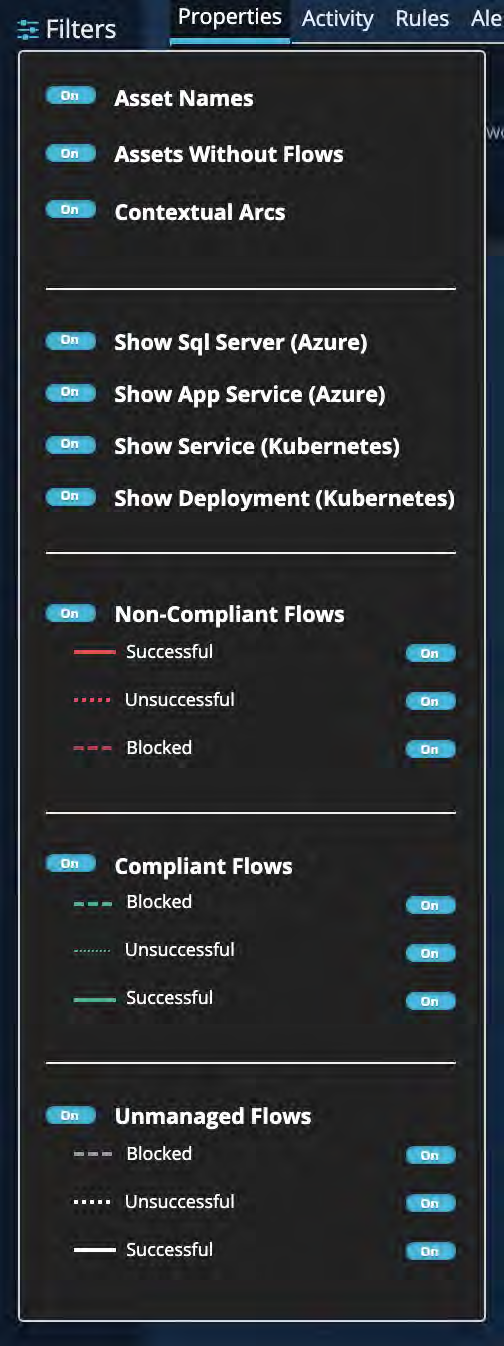
Asset Names
Hide/Show Asset names.
Asset Without Flows
Hide/Show Assets that don’t have flows.
Compliant
Flow that is covered by a policy.
Non-Compliant
Flow that is not covered by a policy.
Unmanaged
Flow between two unmanaged Assets (no policy is defined on either asset)
Successful
Established connection.
The flow can be unmanaged, compliant or non-compliant.Unsuccessful
Connection that could not be established.
The flow can be unmanaged, compliant or non-compliant.Blocked
Attempted connection blocked by an enforcement point.
The flow can be unmanaged and non-compliant.
Back — Return to the previous visualization screen.
Copyright © 2021 Cloudvisory Documentation, Fireeye Inc.
73

Drill-Down — View assets inside your selection and hide the unselected assets.

Expand – View assets inside your selection along with the current displayed assets.

Using Scopes to Focus a View
A scope is a group of any assets within the infrastructure or the logical groups views. Use scopes to display only the assets you want to see, or as a faster way to quickly visualize exactly what is needed. You can create one or more scopes, save a scope, and load or reload a scope instantly. Use the left panel of the Visualization page to create, load, and manage scopes.
Scopes are visible only to the user who created them.
Creating a Scope
In the left panel of the Visualization page, click Edit.
Enter a name for the new scope.
Copyright © 2021 Cloudvisory Documentation, Fireeye Inc.
[IMAGE PLACEHOLDER: "Edit Scope" dialog showing a dark-themed interface with an asset selection table on the left and a "Selected Assets" panel on the right.]
3. Select the checkbox of each asset the scope should include. Use the Search tool or filters to narrow down the list. Selected assets are listed on the right.
4. To apply the scope immediately without saving, click Apply. You can save the scope at any time after you apply it.
5. To save the scope and apply it immediately, click Save & Apply.
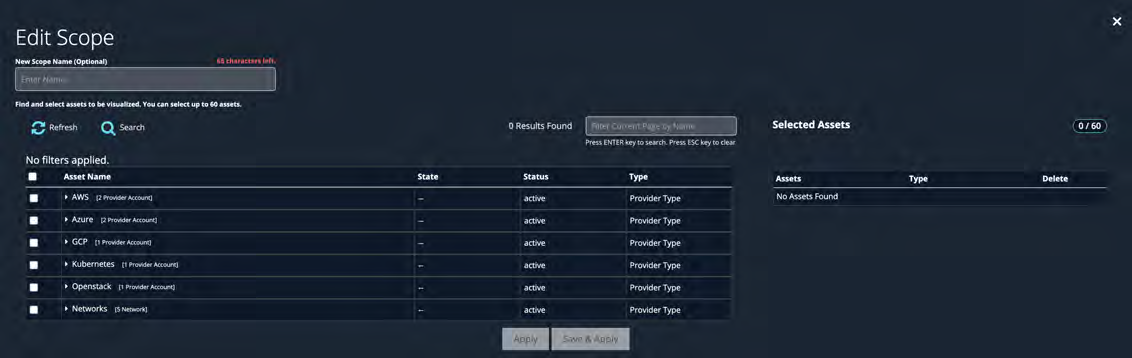
Modifying a Copy of a Scope
You can edit a scope and save it with a new name.
Select the scope from the Current Scope menu and click Edit.
Make your changes.
3. Click Save As and enter the new name.
Loading a Saved Scope
Do one of the following:
Click the Current Scope field and select a scope from the list.
Enter the scope's name in the Current Scope field.
Managing and Deleting Scopes
Copyright © 2021 Cloudvisory Documentation, Fireeye Inc.
Click Manage to display the list of scopes that have been saved.
Select a scope and click Delete Selected to delete it.
Viewing Flows
You can filter flows by type using the filters in the Visualization screen.
Types of Flows
Compliant
Flow that is covered by a policy.
Copyright © 2021 Cloudvisory Documentation, Fireeye Inc.
76
Non-Compliant
Flow that is not covered by a policy.
Unmanaged
Flow between two unmanaged assets (no policy is defined on either asset).
Successful
Established connection.
The flow can be unmanaged, compliant or non-compliant.
Unsuccessful
Connection that could not be established.
The flow can be unmanaged, compliant or non-compliant.
Allowed
Connection allowed by an enforcement point. It can be successful or unsuccessful.
The flow can be unmanaged, compliant or non-compliant.
Blocked
Attempted connection blocked by an enforcement point.
The flow can be unmanaged, and non-compliant.
How Flows Are Monitored
Flow reports are broken down by several categories.
Flows Reported by Agents
Flow counts
The flow counts reported in the Cloudvisory UI indicate the number of flows captured by the Linux conntrack table or Windows Filtering Platform, depending on the agent type. For TCP flows, this corresponds to the number of TCP connections, in both Windows and Linux. In Linux, a UDP flow is associated with a sequence of packets exchanged between two IP addresses using the same source and destination ports. Because there is no explicit start and end of a connection, a UDP flow starts with the first packet exchanged between two endpoints and ends after no more packets for that flow are observed during an interval determined by the conntrack timeout value, which is usually between 1 and 3 minutes. In Windows, the agent reports a UDP flow for each UDP packet.
Byte counts
Flows reported by agents generate two events, one at the start of the flow and one at the end of the flow. Byte counts are reported only at the end of the flow. Flows that have started but not yet terminated will not have byte counts included in the summaries displayed in the UI. This may cause some flows to have "NA" displayed in the byte count column of the UI flow pages.
Flow type
Flows can be reported as blocked, successful and unsuccessful. Blocked flows are flows blocked by security rules in provider security groups or host firewalls. Successful flows are flows for which there was successful communication between endpoints. Unsuccessful flows are communications that did not complete, but were not necessarily blocked. For example, there may be no process listening on the remote side, or the network may have connectivity issues. In some configurations, the agent cannot determine whether a flow was blocked by network security rules or not. This can happen, for example, for egress flows when the agent is running on an AWS instance and security policies are enforced in AWS security groups. In this case, if the current set of policy rules would not allow that flow, Cloudvisory will display that unsuccessful flow in the UI as blocked. Unsuccessful flows are typically failed TCP connections. For UDP flows where there is traffic in only one direction, the flow cannot be reliably determined as successful or unsuccessful. In this case the flow is reported as unsuccessful.
Flows Reported by AWS API
Flow counts
The flow counts displayed in Cloudvisory UI for flows collected using the AWS flow API represent the number of AWS flow samples reported by AWS. Each AWS flow sample includes the number of bytes exchanged during an AWS sample interval for a particular flow signature (5-tuple including protocol, source and destination IP addresses and source and destination ports). Each sample can span multiple connections (for short-lived connections) or it can include only a portion of a long-lived connection. AWS does not report the number of connections but the amount of data transferred during a sample interval.
Byte counts
Every sample reported by AWS includes the number of bytes transferred in both directions.
Flow type.
AWS reports whether flow samples were allowed or blocked by security group rules. But AWS does not distinguish whether an allowed flow completed successfully or failed for some other reason, such as no listening process or no network connectivity. In the current release, those flows are reported as successful flows in the Cloudvisory UI.
Flows Reported by Azure API
Flow counts
Azure reports a flow for every TCP connection. It is not clear from Azure documentation if UDP flows are associated with UDP packets or any sequence of packets.
Byte counts
Azure does not report byte counts with flows. Cloudvisory displays “NA” in the byte counts columns for Azure flows.
Flow type
Azure flows are reported as allowed or blocked by Network Security Groups. As in AWS, there is no distinction between successful and unsuccessful allowed flows.
Typically, Cloudvisory will process flows within a few minutes of their receipt. However, the delivery of flows via both AWS VPC Flow Logs and Azure Network Watcher has been known to be delayed any where from 20 minutes to a few hours. Also, after you modify the flow collection mechanism for your Cloudvisory provider account, there can also be a multi-hour delay before the new flows begin appearing the first time. This depends on the Cloud Provider.
Known issues
Currently, Cloud Reporting cannot indicate whether a connection succeeded. Instead, the provider can only indicate that the outgoing connection was "Allowed" or "Blocked". Consequently, Cloudvisory will display the outgoing connection as "Successful" any time the Provider reports "Allowed". For additional details, please install an agent on the Hosts in question.
Copyright © 2021 Cloudvisory Documentation, Fireeye Inc.
Example
While the flows between sangi_mar12 and Networks are shown as blocked, if we go into the flow details, we get the following information:
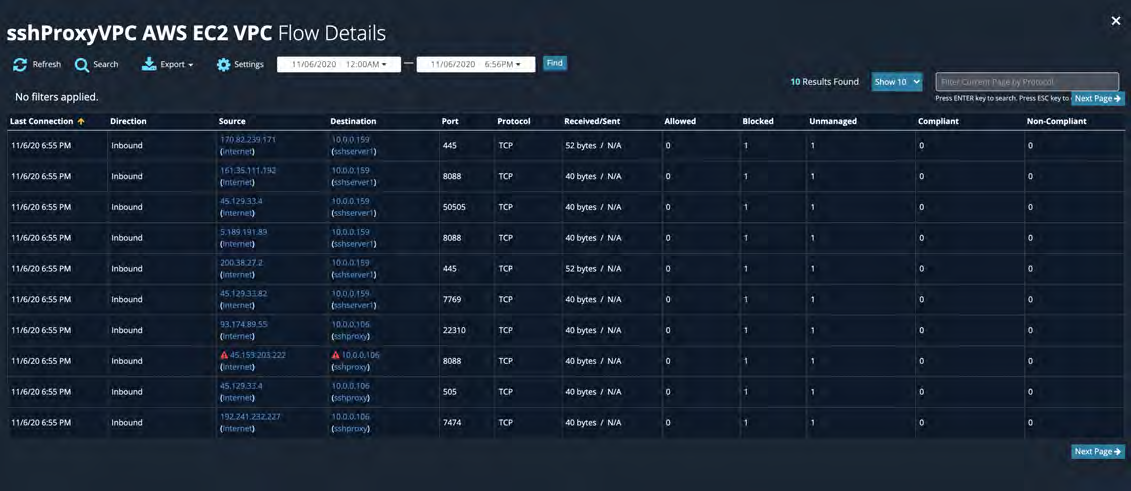
Even though the connections are displayed as blocked in the visualization, the outbound connections are shown as successful in the details.
Note: Cloudvisory looks at the receiver first on workload to workload flows.
Flow Properties
Click a flow to display the properties of its associated flows. (The arrow becomes highlighted and endpoints are selected.)
Connection Details
Flow Summary for an Individual asset
The flow summary contains information for all the flows related to a specific asset.
Copyright © 2021 Cloudvisory Documentation, Fireeye Inc.
78
To open the flow summary, click on a workload. On the Properties tab, click the “View Flows summary” button.
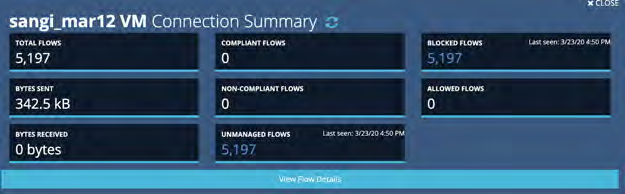
Individual asset Flow Details
To view a detailed list of the individual flows for an asset, click on "View Flow Details" in the asset's Connection Summary.
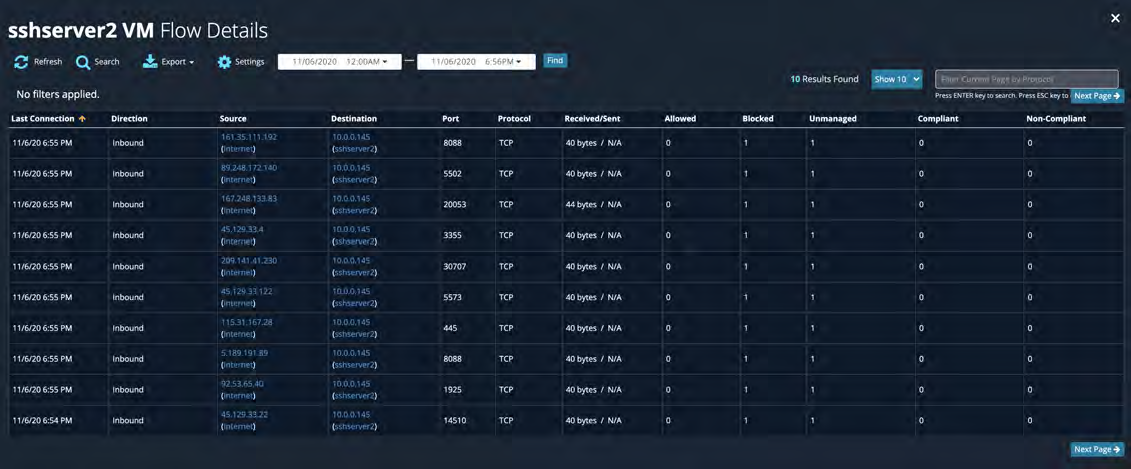
The flow details lists inbound and outbound connections by individual ports and protocols.
Quarantine
You can quarantine only managed assets. Unmanaged assets cannot be quarantined.
Quarantining an Asset
In the Visualization screen, select the asset that you wish to quarantine.
In the Properties panel, in the State field, click [Change].
Select Quarantined.
When prompted, click Yes.
Copyright © 2021 Cloudvisory Documentation, Fireeye Inc.
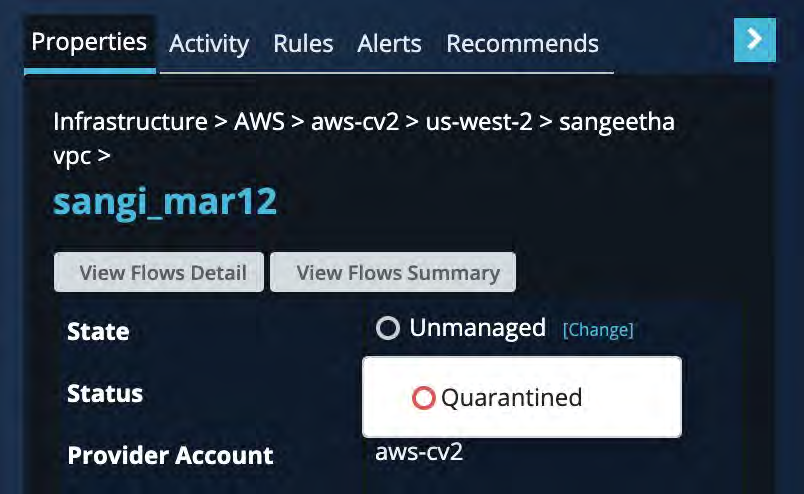
Viewing Quarantine Items
You can view a quarantined item in the system from the Visualization screen or from the quarantined item's properties.
Create Quarantine Rules
When an asset is quarantined, all of its existing rules are replaced by the Quarantine Rules.
Go to Governance > Tag Policies > QuarantineGroup
Create an inbound rules by clicking the Add Inbound Rules. Also Create outbound rules by clicking Add OutBound Rules
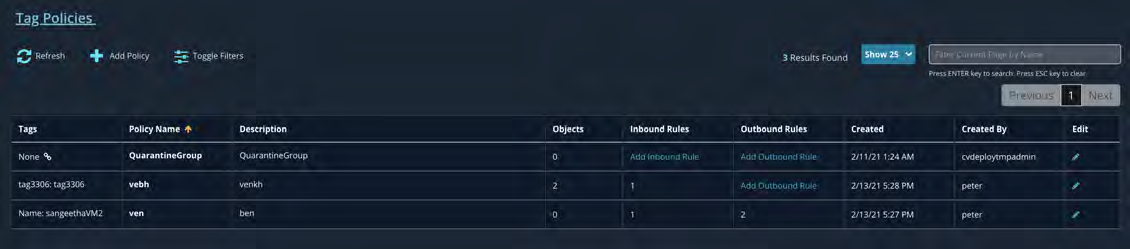
Delete a Quarantine Rule
Go to Governance > Tag Policies > QuarantineGroup
Check all rules that you want to delete.
Click Delete Selection.

Copyright © 2021 Cloudvisory Documentation, Fireeye Inc.
Dashboard Overview
The dashboard displays a high-level overview of the environment.
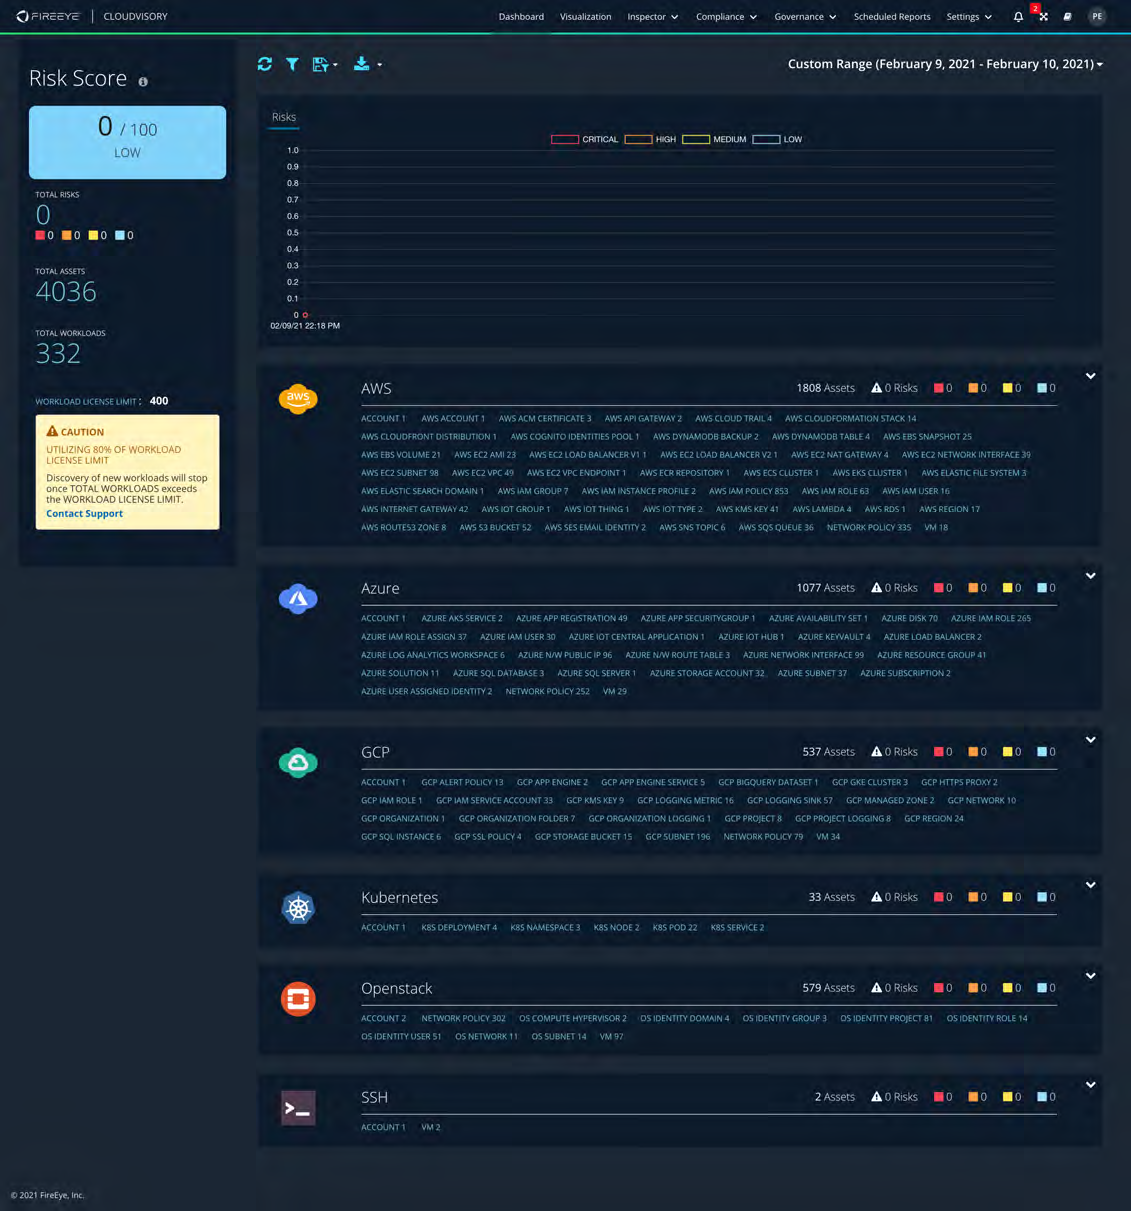
Risk Score
This component displays the overall risk score, total risks and their severity, total recommendations and their impacts, total assets, and total workloads.
Copyright © 2021 Cloudvisory Documentation, Fireeye Inc.
How risk score is calculated?
The risk score is calculated based on the following variables:
Failed Checks
lowRiskFail: number of failed checks of Low Severity on one or more assets
mediumRiskFail: number of failed checks of Medium Severity one or more assets
highRiskFail: number of failed checks of High Severity on one or more assets
criticalRiskFail: number of failed checks of Critical Severity on one or more assets.
Passed Checks
lowRiskPass: number of passed checks of Low Severity on one or more assets
mediumRiskPass: number of passed checks of Medium Severity on one or more assets
highRiskPass: number of passed checks of High Severity on one or more assets
criticalRiskPass: number of passed checks of Critical Severity on one or more assets
Severity Weight : Weights are configurable for checks based on their severity level(low, medium, high and critical).
lowWt = 3
mediumWt = 6
highWt = 11
criticalWt = 16
denom = 16
The mathematical equation for calculating risk score using the above variables are as following:
totalRiskScore = (lowRiskscore + mediumRiskScore + highRiskScore + criticalRiskScore) / (denom * (lowRiskFail + mediumRiskFail + highRiskFail + criticalRiskFail)) * 100
where:
lowRiskscore = (( lowWt * lowRiskFail * (1 - (0.2 * (1 - (lowRiskFail / (lowRiskFail + lowRiskPass)))))))
mediumRiskscore = (( mediumWt * mediumRiskFail * (1 - (0.2 * (1 - (mediumRiskFail / (mediumRiskFail + mediumRiskPass)))))))
highRiskscore = (( highWt * highRiskFail * (1 - (0.2 * (1 - (highRiskFail / (highRiskFail + highRiskPass)))))))
criticalRiskscore= (( criticalWt * criticalRiskFail * (1 - (0.2 * (1 - (criticalRiskFail / (criticalRiskFail + criticalRiskPass)))))))
Example:
Lets assume a total of 10 checks ran regardless of the number of assets. The results are:
Failed Checks based on severity:
lowRiskFail = 2,
mediumRiskFail = 2,
highRiskFail = 1,
criticalRiskFail = 1
Passed Checks based on severity:
lowRiskPass = 2,
mediumRiskPass = 2,
highRiskPass = 0,
criticalRiskPass = 0
Apply the value to the risk score equation:
lowRiskscore = (( 3 2 (1 - (0.2 (1 - (2 / (2 + 2))))) ) = 5.4 Rounded to 6
mediumRiskScore = (( 6 2 (1 - (0.2 (1 - (2 / (2 + 2))))) ) = 10.8 Rounded to 11
highRiskScore = (( 11 1 (1 - (0.2 (1 - (1 / (1 + 0))))) ) = 9.9 Rounded to 10
criticalRiskScore = (( 16 1 (1 - (0.2 (1 - (1 / (1 + 0))))) ) = 16
TotalRiskScore = (6+11+10+16)/(166)100 = 44.8 Rounded to 45
INFO
You can also download the risk score calculator for referece here
Copyright © 2021 Cloudvisory Documentation, Fireeye Inc.
82
NOTE
When all assets are either placed in exception or have errors (or some combination of the two) passed checks and failed checks are 0. And sum of all failed checks is set to 1 to prevent division by 0.
So in the above example the totalRiskScore = (0 + 0 + 0 + 0)/(16 x 1) x 100 = 0
Risk Graph
The Risk Graph showcases the severity of risk over a given period of time.
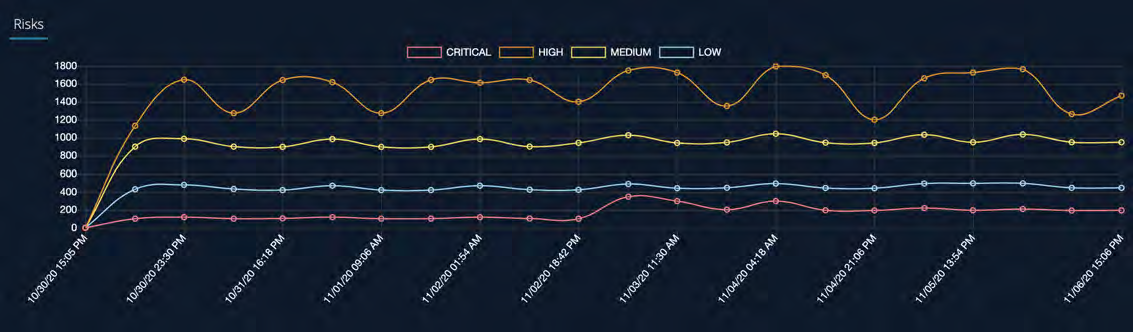
Providers
This section provides a top-level view of each provider. This includes a number of assets, risks, and recommendations.
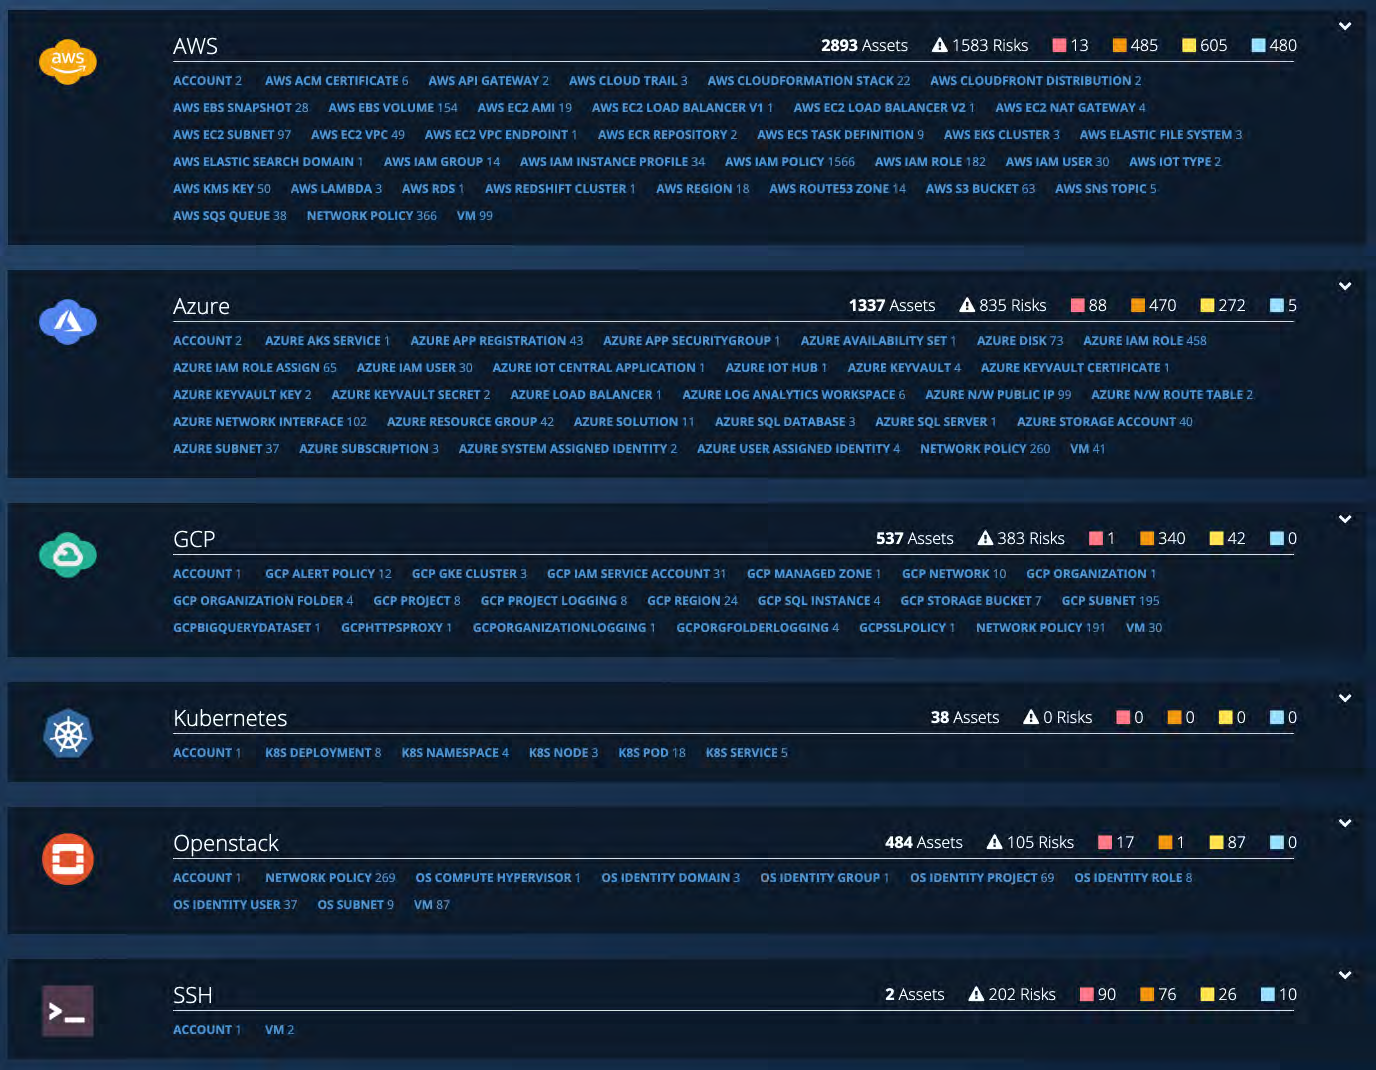
Copyright © 2021 Cloudvisory Documentation, Fireeye Inc.
83
Click the down arrow in the top right corner of each provider panel to show details about the provider. This will take you to the check inspector and show a detailed view of the provider's risk. Click Dashboard to return to this page.
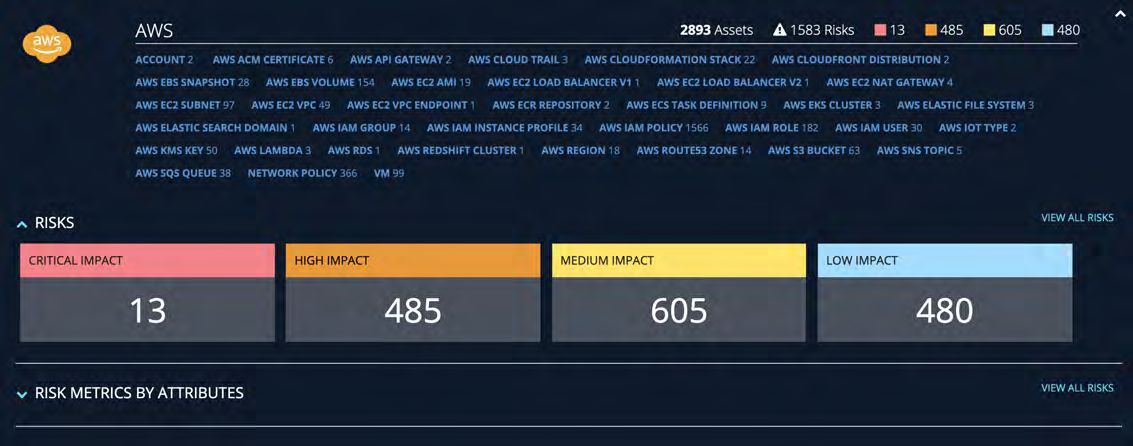
Click the down arrow next to Risk Metrics by Attributes to view risks categorized by attributes. Click on each attribute to see a detailed view of the risks. To return to this page, click Dashboard.
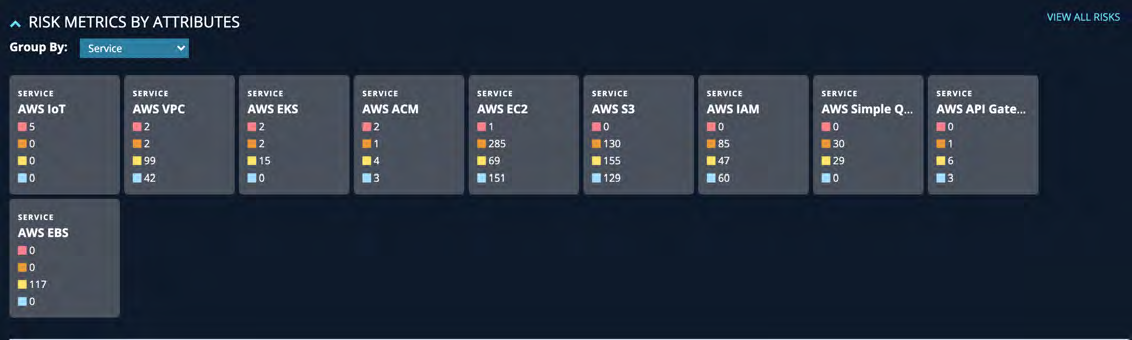
Dashboard Refresh, Search & Filters
Use this function to refresh and filter data on the dashboard. You can search for specific providers and provider accounts. All information on the dashboard will be refreshed based on your selections.
Calendar Settings
You can change the calendar settings from the dashboard. The default displays the previous week. If you change the default, the information shown will be refreshed based on your selection.
Copyright © 2021 Cloudvisory Documentation, Fireeye Inc.
Alert Inspector
Cloudvisory generates alerts for compliance failure, system failure, enforcement violations, flow violations, and more.
To view all alerts, go to Inspector > Alerts.
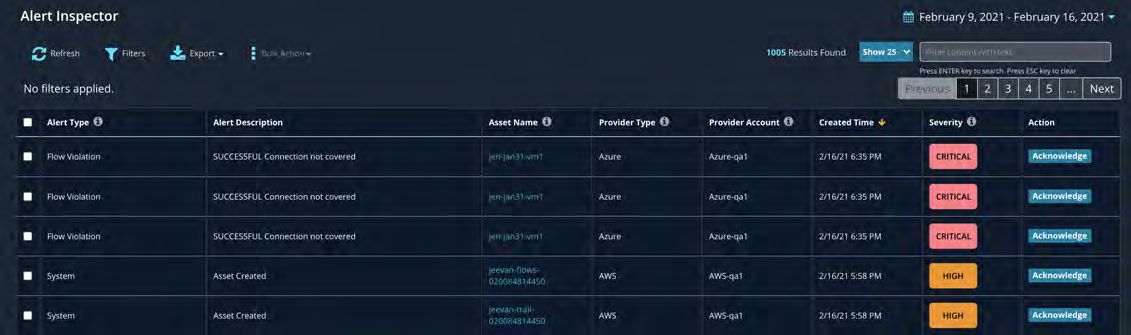
Alert Search Filters
Alerts can be searched for based on severity, action, type, and other attributes.
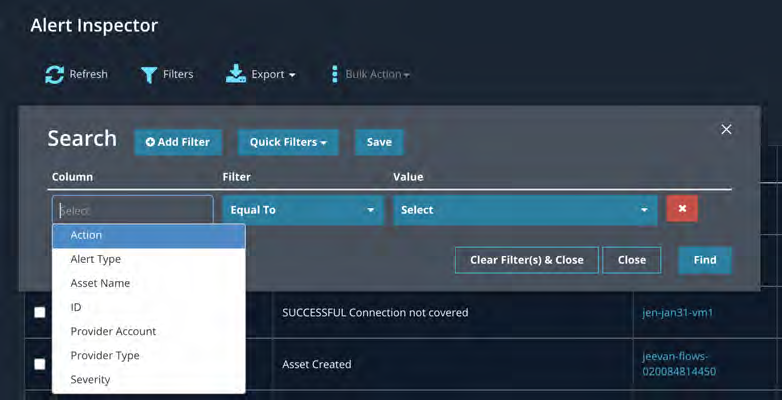
Alert Details
Click on the Asset Name column to see the details for an alert.
Enforcement violation alerts include details about each added and deleted rule in a security group. Cloudvisory generates separate enforcement violation alerts if a security group is deleted or detached from a workload.
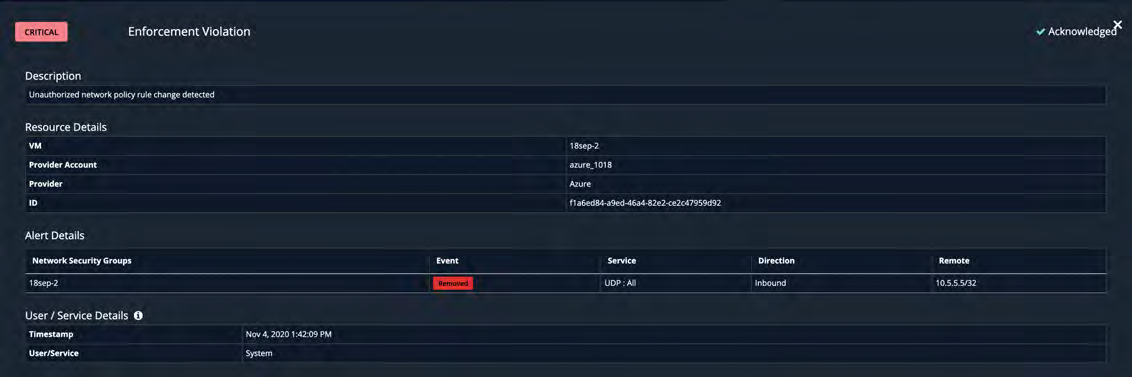
Flow Violation Alert
Flow violation alerts display the source, destination, port, and protocol of the flow. For repeated unacknowledged violations, Cloudvisory updates the last modified time and the number of occurrences of the flow.
Copyright © 2021 Cloudvisory Documentation, FireEye Inc.
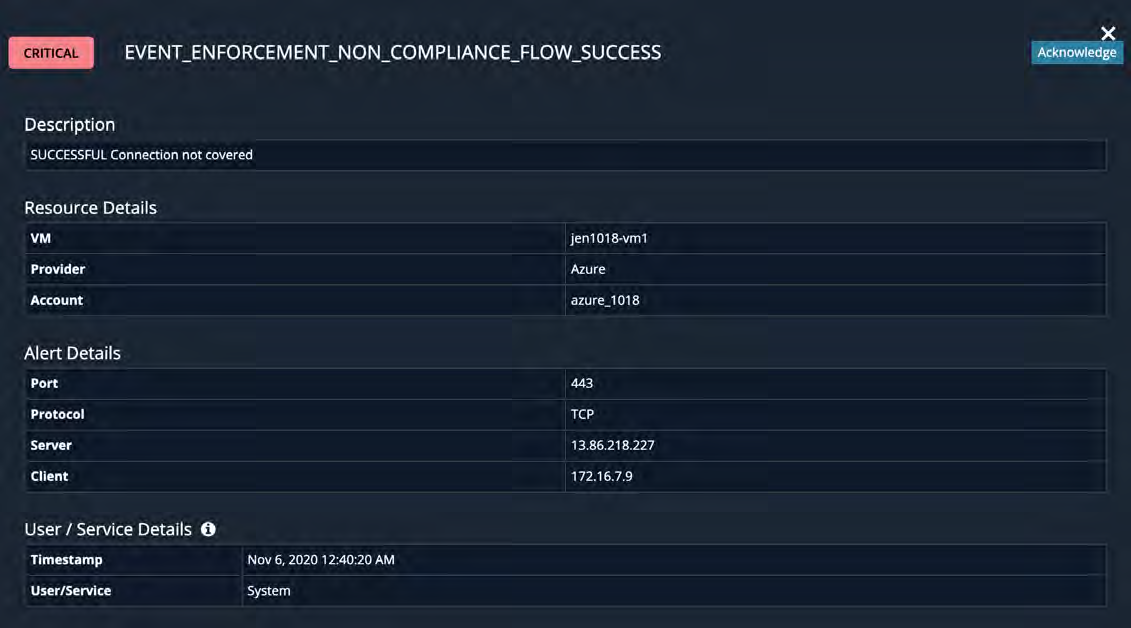
Compliance Violation Alert
Compliance violation alerts show details of the compliance check. You can do remediation, send email notifications, add exceptions, and more.
INFO
See Check Inspector for more details
Copyright © 2021 Cloudvisory Documentation, Fireeye Inc.
86
Asset Inventory
The Asset Inventory inspector displays the inventory of your assets across all provider account.
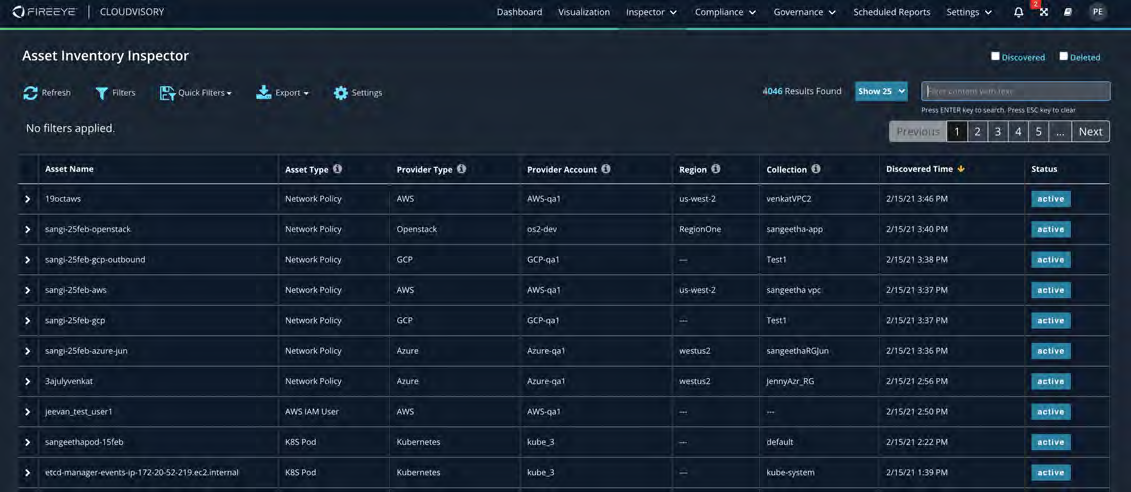
Asset Detail
Select an asset in the Asset Name column to view information about that asset. You can expand the asset to see details of the asset. The expanded view provides Compliance, Configuration and Activity of the selected asset.
Compliance
The compliance tab provides information related to asset's compliance checks results, risk score of the asset and also provides information about the failed checks and details of failed checks with remediation steps (if auto remediate is not applicable).
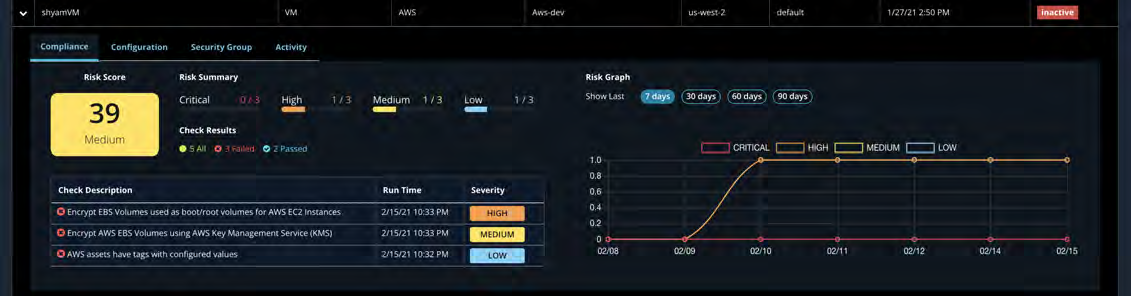
Configuration tab
The aconfiguration provides information related the asset's deployment and its attributes. Also the configuration lists the tag properties of the asset.
Activity
Activity tab will list all the activities/events which has occured on the assets. The list provides last 25 recorded activities. To see all the activities click - events in last 7 days next to the activity details title.
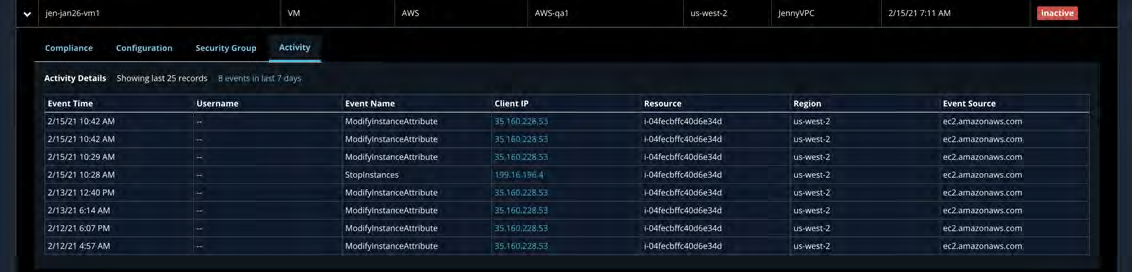
Additional tabs based on provider type
Copyright © 2021 Cloudvisory Documentation, Fireeye Inc.
87
GCP: Firewall Rule tab
This tab shows up if the provider type is GCP. This tab details the GCP assets firewall rules.
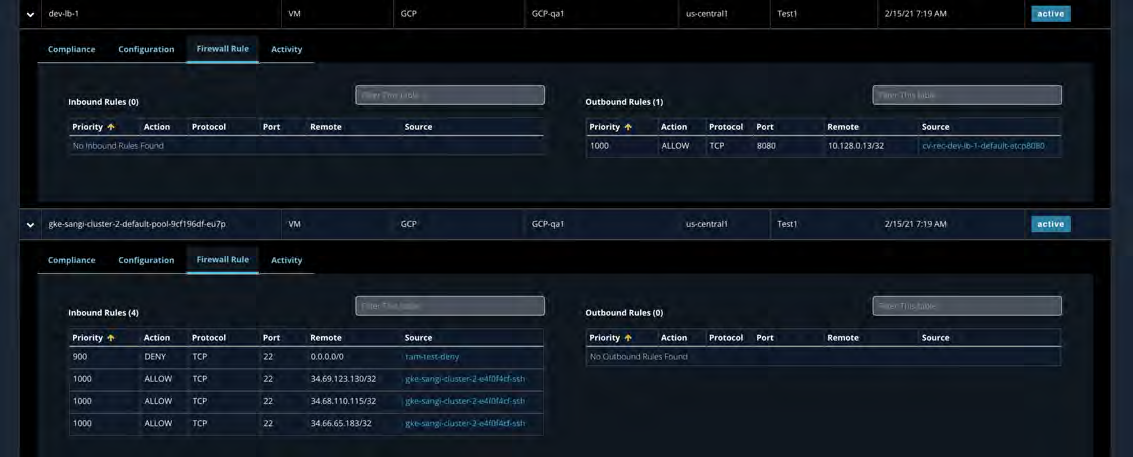
AWS: Security Group tab
This tab shows up if the provider type is AWS. This tab details the AWS assets Security group details.
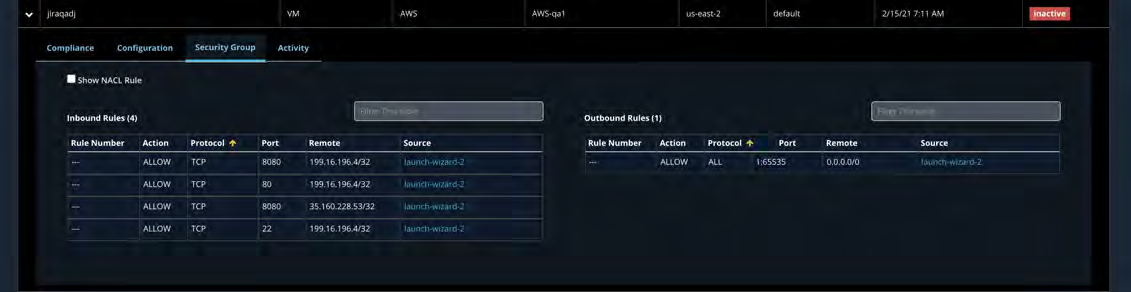
Permissions tab
This tab shows up for IAM role, user, policy, and group. This tab details the list of permission attached to the specific asset.

Azure: Network Security Group tab
This tab shows up if the provider type is Azure. This tab details the Azure assets Network security group details.
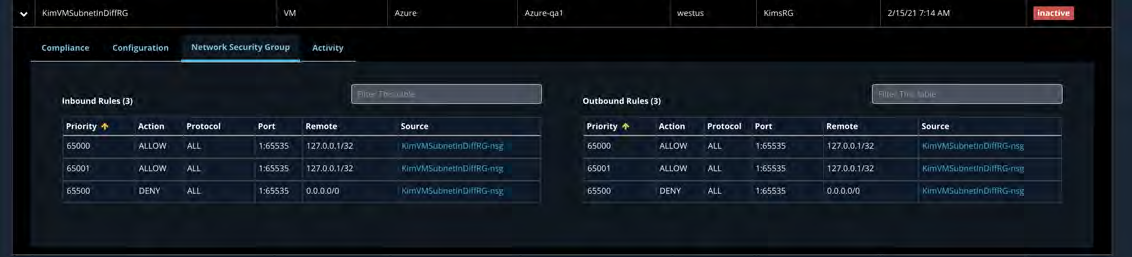
Generating Reports
Click the Export icon and select a format (PDF, XLSX, or CSV) to generate an infrastructure report.
Copyright © 2021 Cloudvisory Documentation, Fireeye Inc.
88
Asset Inventory Inspector
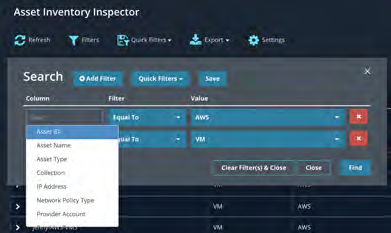
Search
Add Filter Quick Filters Save
Column | Filter | Value
Equal To | AWS
Equal To | VM
Asset ID, Asset Name, Asset Type, Collection, IP Address, Network Policy Type, Provider Account
Copyright © 2021 Cloudvisory Documentation, Fireeye Inc.
89
Check Inspector
To view, go to Inspector > Checks
Use the Check Inspector to search for checks and their results and generate reports. Click the Latest Result checkbox to show the most recent run of checks. By default, check results are ordered by run time. To add additional columns, click the Settings icon.
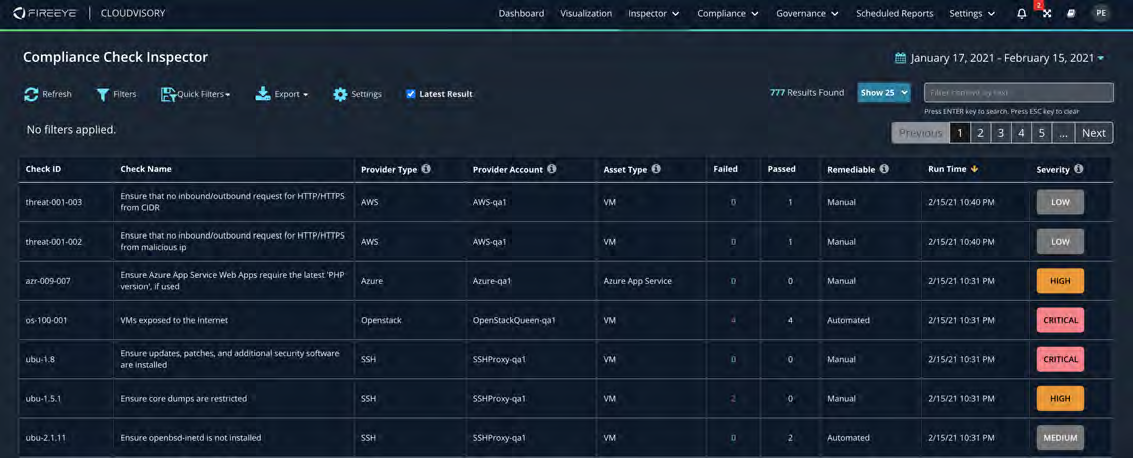
Search & Filtering
You can search and filter for checks and results. Multiple filters can be applied simultaneously.
Click the down arrow next to the calendar in the top right corner to change the time range.
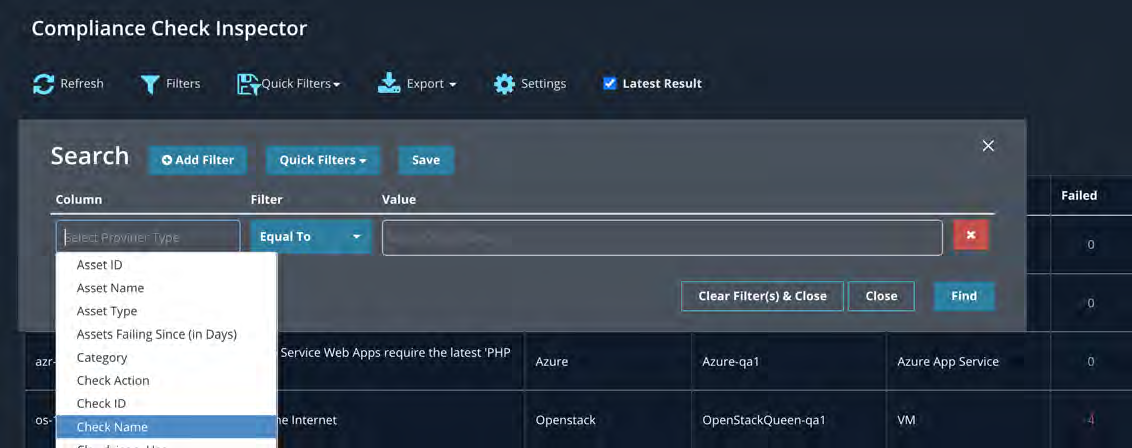
View Detail
Click on the check result line to show the details of each check run. The details include check descriptions, summary results, and other information on multiple tabs.
Copyright © 2021 Cloudvisory Documentation, Fireeye Inc.
90
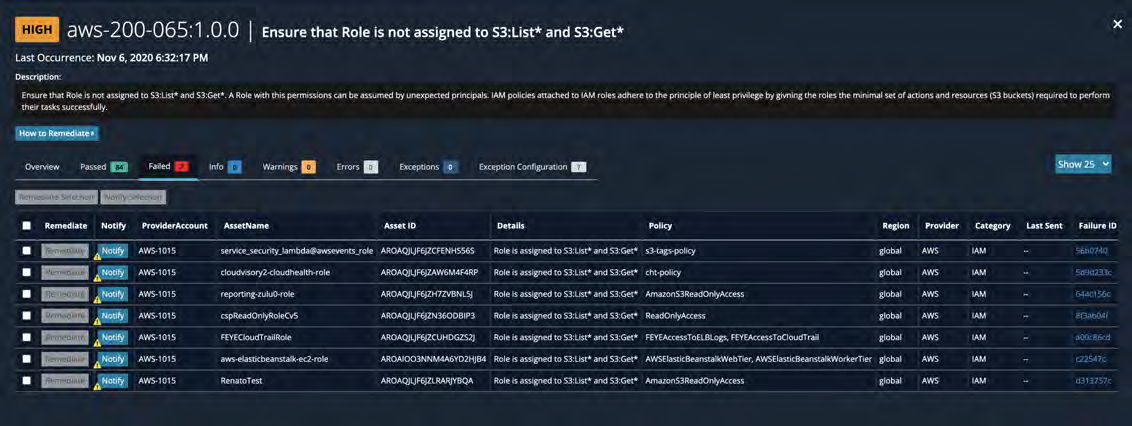
How to Remediate
The How to Remediate description provides detailed steps for remediating a failure in the provider.
The Failed tab shows details for each failure and options to take action.
Remediate & Notify
Use the Remediate button to remediate failures and optionally to send an email during remediation.
Click Notify to send an email notification to the user. Click Edit to customize the body of the email.
Copyright © 2021 Cloudvisory Documentation, Fireeye Inc.
Create an Exception
To create or cancel an exception, click the Exception Configuration tab and select one or more failures. When you create an exception, the failure check will be omitted from risk calculations and will be marked as an exception in future check runs.
Add Activity Details
To view the activity details for a check, go to Settings and select the Activity column. Then click the icon in the Activity column. The Activity column will be displayed in the Compliance Check Inspector page. You can select additional columns to be displayed.
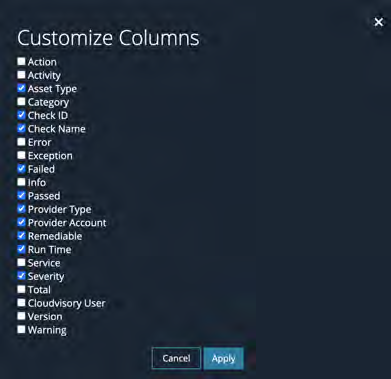
Generate a Report
To download a report, click the export icon and select the format from the dropdown menu. Enter the report file name and select the compliance check results the report should include. Click Download.
Copyright © 2021 Cloudvisory Documentation, Fireeye Inc.
[IMAGE PLACEHOLDER: Export dropdown menu showing options PDF, XLSX, CSV and Schedule Report; below it a dialog titled "Enter File Name" with a filename input, selection checkboxes (Summary, Failed, Passed, Warning, Exception, Errors, Info, Remediation Steps) and Cancel/Download buttons.]
NOTE
The maximum export limit is 1000 rows/results. Use the search filter to narrow your results.
Schedule a Report
To schedule a report, click the export icon and select Schedule Report. Follow the instructions on the screen.
You can schedule a recurring or one-time report and send it to one or more email addresses.
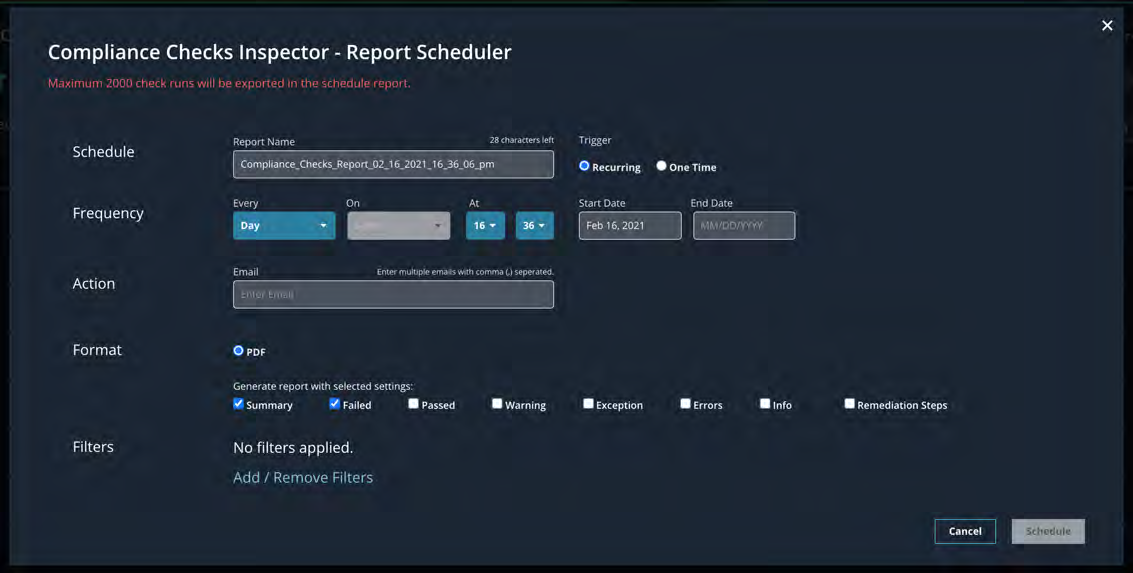
Frequency Options
One time: The report will be sent to the email address only once at the time and date you specify.
Copyright © 2021 Cloudvisory Documentation, Fireeye Inc.
93
Every day: The report will be sent every day at a specified time. You can select the start and end date for triggering the report.
Every Month: The report will be sent every month on the day you specify.
Every Week: The report will be sent every week on the day of the week and time you specify.
INFO
You can select the start and end date while scheduling a report for any frequency type.
Apply Filters and Check the Results
The report will be generated with the applied filters.
CAUTION
Apply filters and check whether the results exceed 1000 rows before you schedule the report.
The maximum export limit is 1000 rows/results.
To see the all the scheduled reports, go to Scheduled Reports
For more information, see Scheduled Reports.
Copyright © 2021 Cloudvisory Documentation, Fireeye Inc.
Flow Inspector
The Flow Inspector shows VMs with user-specified flows (connections) of interest made over a user-specified time period (default one day) such as flows from known malicious IPs, flows from or to user specified geo-locations, unauthorized outbound flows to the Internet, etc.
By default, i.e. when no filters are specified, it shows the top 25 VMs with the maximum number of flows, sorted in a descending order.
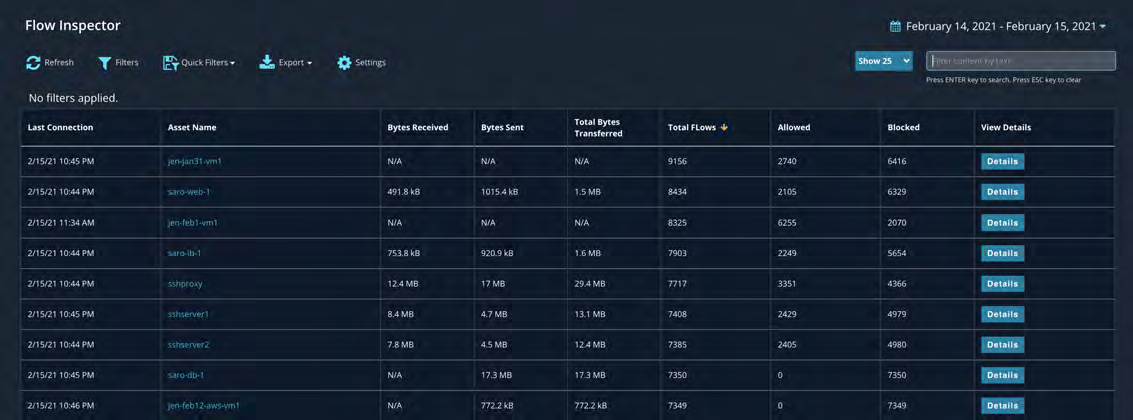
The columns of the landing page are:
Last Connection time when this asset last connected to another asset or a network.
Asset ID the cloud provider's identifier for this asset.
Asset Name the human friendly name of this asset.
Bytes Received the total number of incoming bytes transferred.
Bytes Sent the total number of outgoing bytes transferred.
Total Bytes Transferred the sum of incoming and outgoing bytes transferred.
Total Flows the total number of connections that were made.
Allowed the number of connections that were successfully established.
Blocked the number of connections that were attempted but could not be established.
Unmanaged neither this asset nor the remote end of this connection (another asset or a network) is managed i.e. no network policy has been defined between the two in Cloudvisory.
Compliant the number of connections that are covered by one or more Cloudvisory network policy.
Non-Compliant the number of connections that were not covered by any of the current Cloudvisory network policies.
View Details Clicking on this link brings up a pop-up that can be used to further investigate the flows of this particular asset.
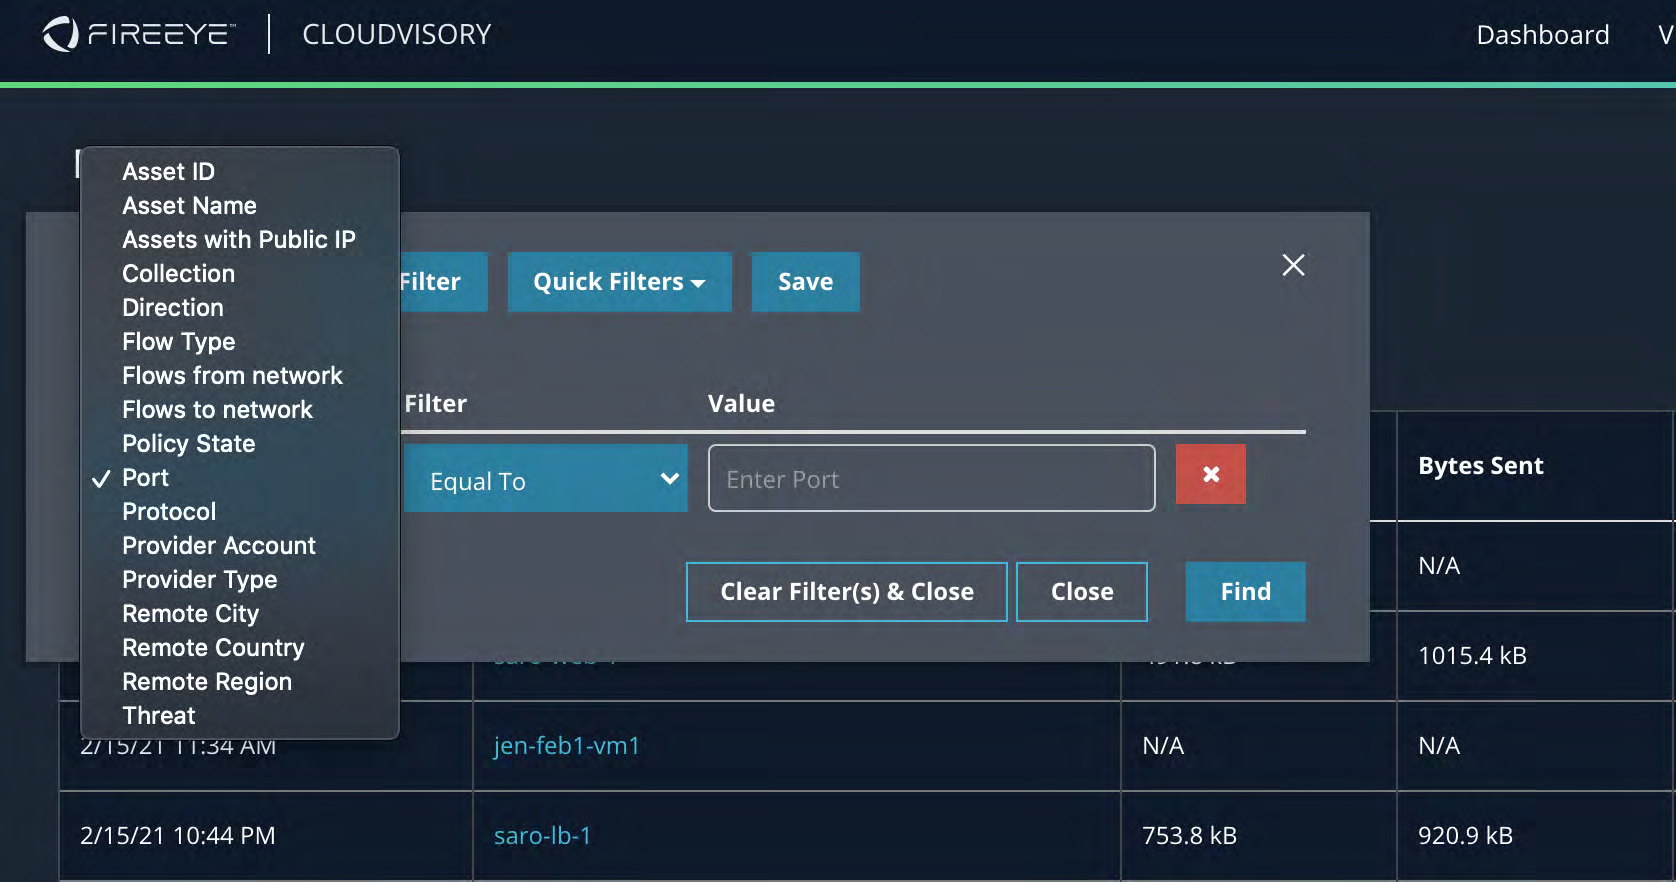
This page has a number of filters:
Asset ID filter by the cloud provider's identifier of an asset.
Asset Name filter by the human friendly name of an asset.
Assets with Public IP if true, get only those assets that have a Public IP.
Collection filter assets that belong to the specified collection, such as an AWS VPC, an Azure Resource Group and a GCP or Openstack Project.
Copyright © 2021 Cloudvisory Documentation, FireEye Inc.
Direction filter by the direction of the connection from the asset's point of view - ingress or egress.
Flow Type filter by whether the connection was allowed or blocked.
Flows from network filter for connections made to this asset originating from the specified network.
Flows to network filter for connections made from this asset to the specified network.
Policy State filter by whether the connection was unmanaged, compliant or non-compliant.
Port filter by connections made to an asset on the specified port.
Protocol filter by connections made from or to an asset using the specified network protocol.
Provider Account filter by assets that belong to the specified provider account.
Provider Type filter by assets that belong to the specified provider type.
Remote City filter by connections originating from or made to an asset or a network in the specified city.
Remote Country filter by connections originating from or made to an asset or a network in the specified country.
Remote Region filter by connections originating from or made to an asset or a network in the specified region.
Threat filter by connections originating from or made to a known malicious IP.
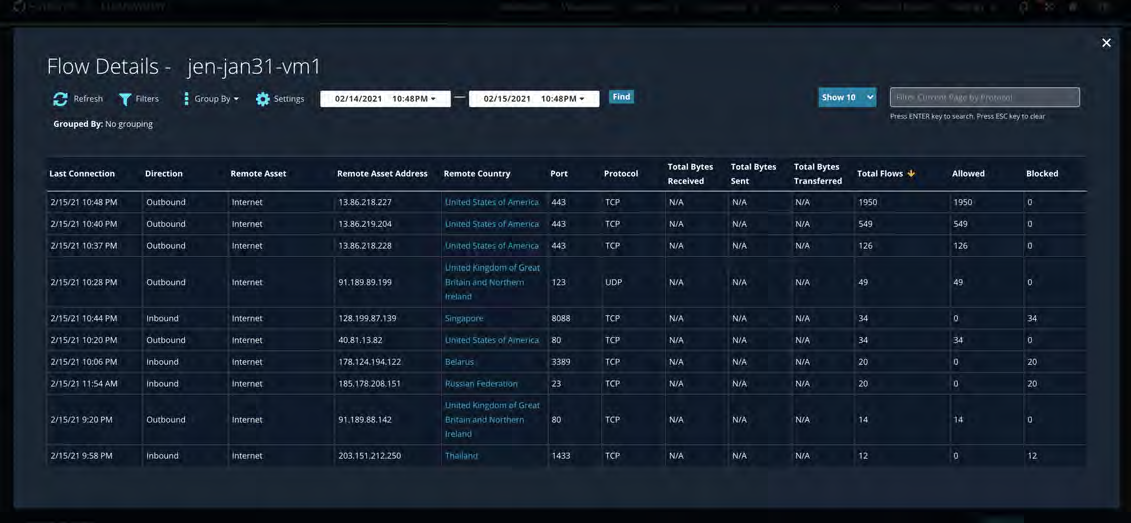
The details pop-up can be used to further investigate the flows of a particular asset. The columns of the details page are:
Last Connection time when this asset last connected to another asset or a network.
Direction the direction of the connection from the asset's point of view - ingress or egress.
Remote Asset the human friendly name of the asset or network at the remote end of this connection.
Remote Asset Address the IP address of the asset or network at the remote end of this connection.
Remote Country the country of the asset or network at the remote end of this connection.
Remote City the city of the asset or network at the remote end of this connection.
Remote Region the region of the asset or network at the remote end of this connection.
Port the port of the asset on which the inbound connection is made or the outbound connection is targeted.
Protocol the network protocol used for this connection.
Total Bytes Received the total number of incoming bytes transferred.
Total Bytes Sent the total number of outgoing bytes transferred.
Total Bytes Transferred the sum of incoming and outgoing bytes transferred.
Total Flows the total number of connections that were made.
Allowed the number of connections that were successfully established.
Blocked the number of connections that were attempted but could not be established.
Unmanaged neither this asset nor the remote end of this connection (another asset or a network) is managed i.e. no network policy has been defined between the two in Cloudvisory.
Compliant the number of connections that are covered by one or more Cloudvisory network policy.
Non-Compliant the number of connections that were not covered by any of the current Cloudvisory network policies.
The asset-specific flows on this pop-up can be filtered using the same filters as the landing page. Any filters used on the landing page carry over to the details pop-up, and are automatically applied before the results are rendered in the pop-up.
In addition, this page allows the user to perform an additional level of aggregation using the columns in the Group By option.
Copyright © 2021 Cloudvisory Documentation, Fireeye Inc.
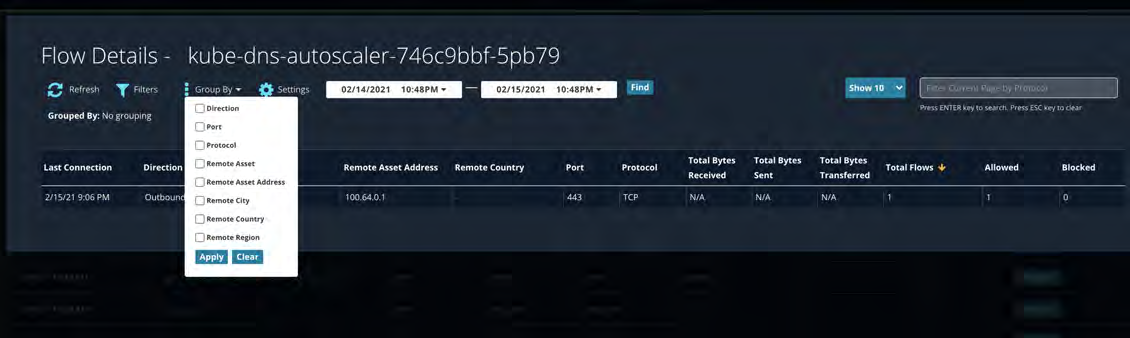
Grouping my be done by any number and combination of the options available in the drop-down.
For example, selecting Direction on an asset with both Ingress and egress flows will collapse the results into two rows, one for Inbound connections and the second for Outbound connections.
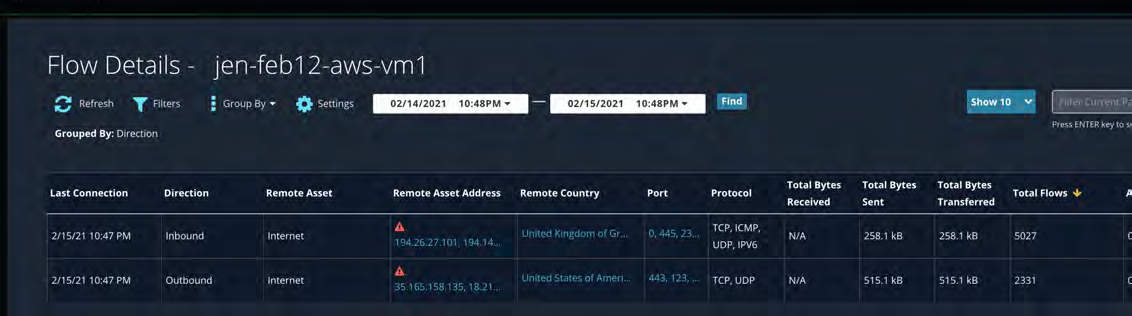
Now selecting Protocol in addition to the previously selected Direction will split the results by Protocol (TCP, UDP, etc.) depending on the protocols that have been used by this asset to connect with the other assets or networks.
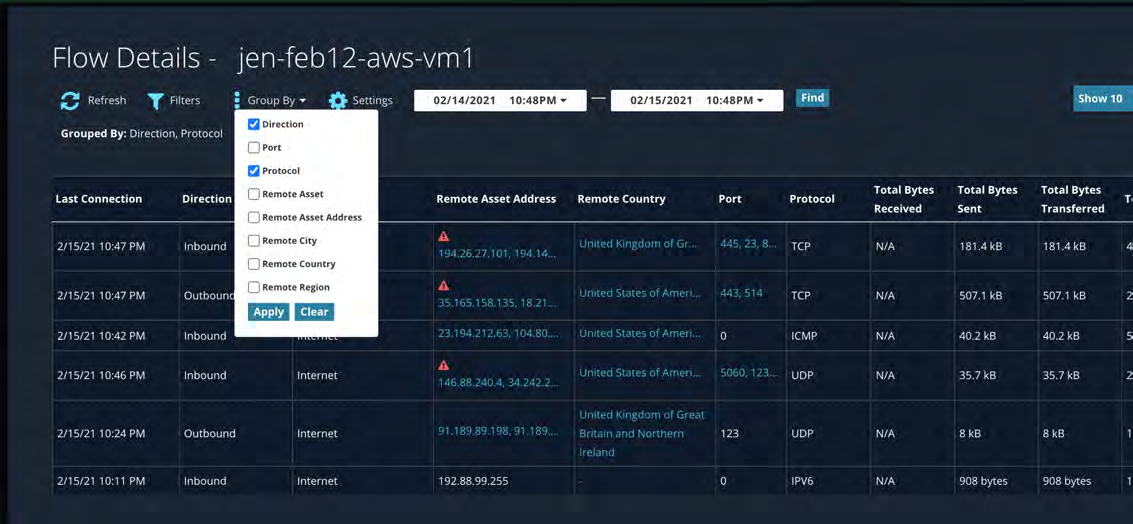
Copyright © 2021 Cloudvisory Documentation, Fireeye Inc.
97
Network Policy
To view existing network policy rules in the system, go to Inspector > Network Policy
The list of policy rules is displayed, ordered by the discovered time.
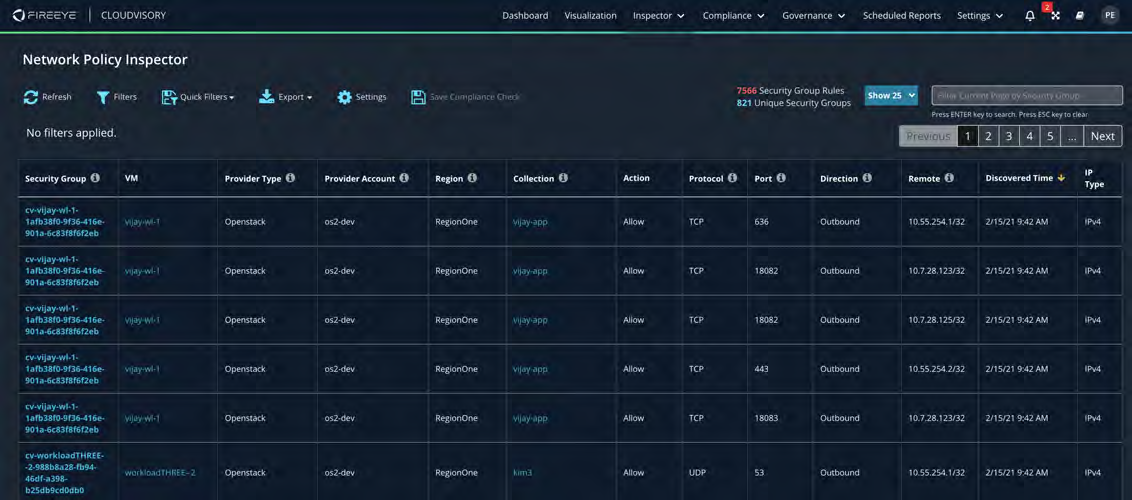
Searching and Filtering
You can filter and search the list by defining the search parameters.
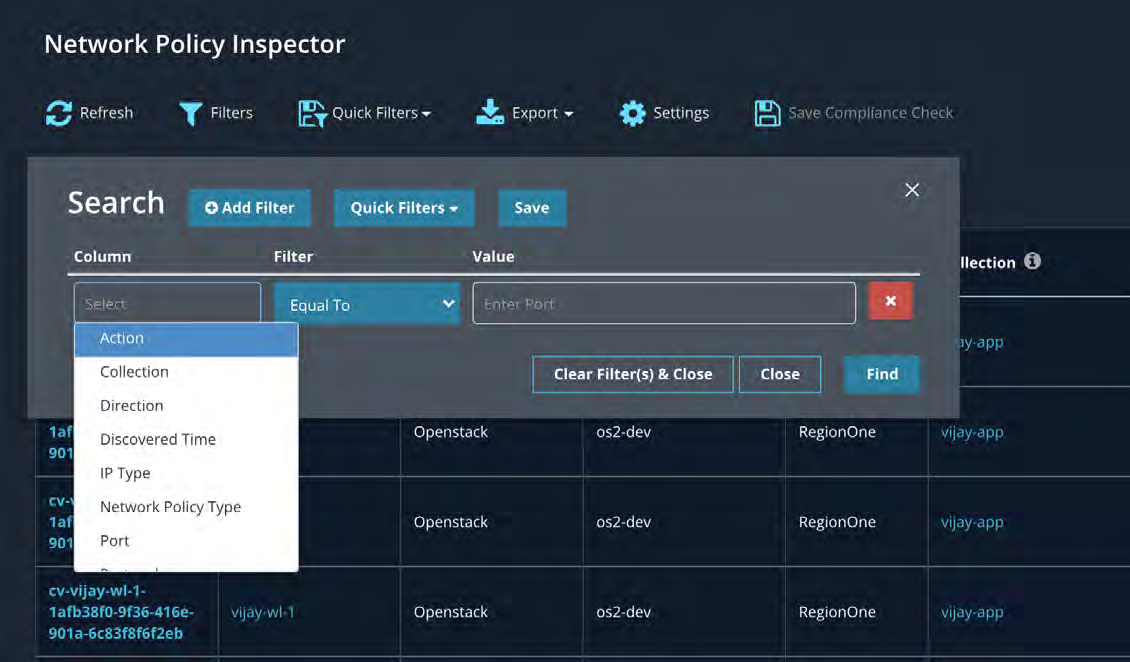
Combining Search Filters
Search filters can be combined for more detailed results. To combine different types of filters, separate them by “AND.” To combine filters of the same type, separate them by “OR”.
For example, the following search filters when used together
Port = 22
Port = 3389
Remote = 0.0.0.0/0
Direction = InboundWill be evaluated as
Copyright © 2021 Cloudvisory Documentation, Fireeye Inc.
98
(Port = 22 OR Port = 3389) AND Remote = 0.0.0.0/0 AND Direction = Inbound
Security Group, VM and Collection Details
Click on a security group name, VM, or collection to display its details.
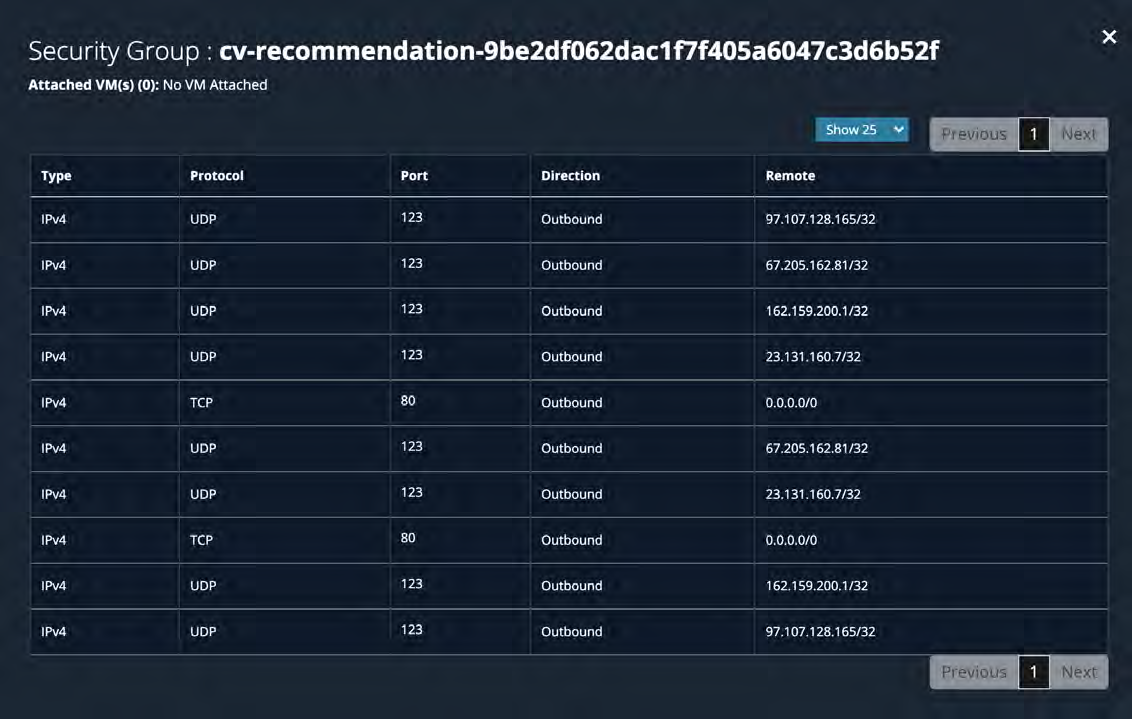
Security group details display the names of all the VMs that contain the security policy and the rules within the security group.
Copyright © 2021 Cloudvisory Documentation, Fireeye Inc.
99
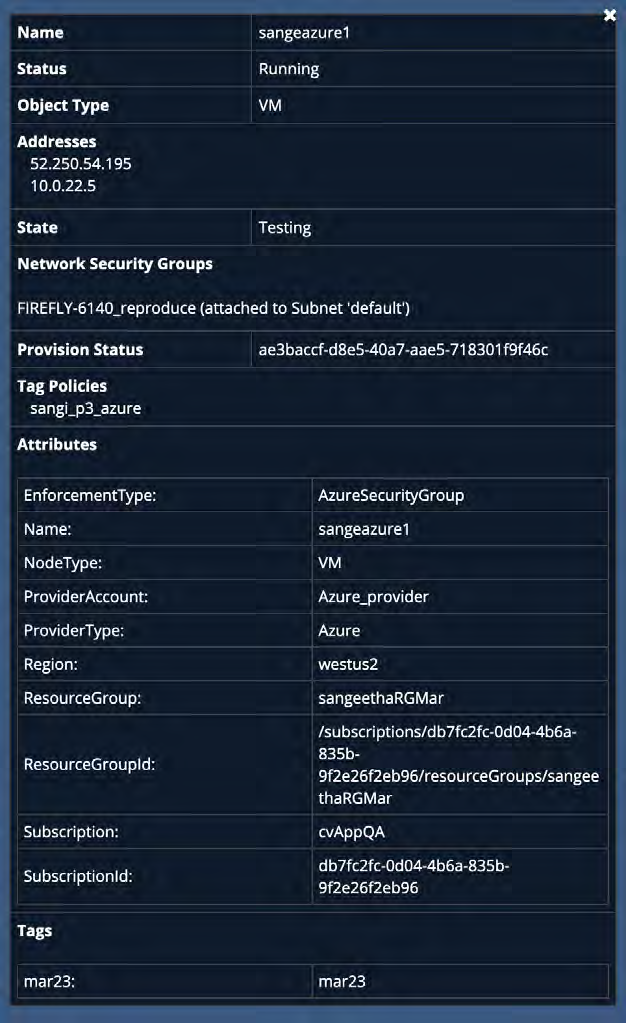
Name | sangeazure1 |
Status | Running |
Object Type | VM |
Addresses | 52.250.54.195 |
State | Testing |
Network Security Groups | FIREFLY-6140_reproduce (attached to Subnet 'default') |
Provision Status | ae3baccf-d8e5-40a7-aae5-718301f9f46c |
Tag Policies | sangi_p3_azure |
Attributes
EnforcementType: | AzureSecurityGroup |
Name: | sangeazure1 |
NodeType: | VM |
ProviderAccount: | Azure_provider |
ProviderType: | Azure |
Region: | westus2 |
ResourceGroup: | sangeethaRGMar |
ResourceGroupId: | /subscriptions/db7fc2fc-0d04-4b6a-835b-9f2e26f2eb96/resourceGroups/sangeethaRGMar |
Subscription: | cvAppQA |
SubscriptionId: | db7fc2fc-0d04-4b6a-835b-9f2e26f2eb96 |
Tags
mar23: | mar23 |
VM and VPC (Collection) details.
Copyright © 2021 Cloudvisory Documentation, Fireeye Inc.
Recommendation Inspector
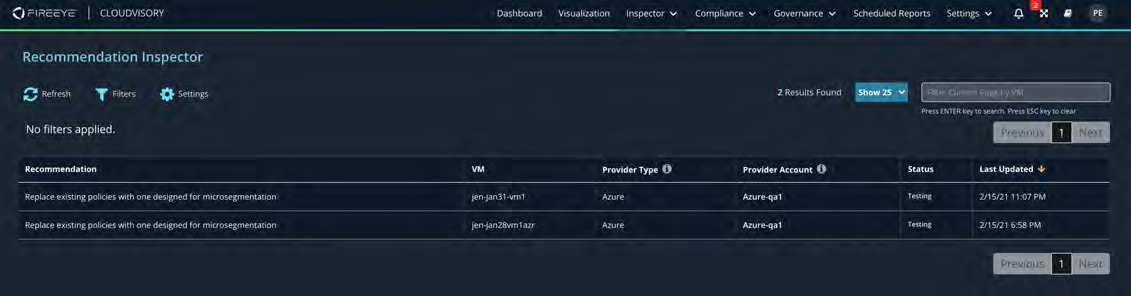
The Recommendation Inspector displays recommended rules for each workload. You can test the recommended rules and choose whether to provision the provider with them or roll back to the previous set of rules.
Recommendation Details
Click a row to view the recommendation details and to take action on the recommendation. The detail view shows the security groups attached to the workload and lists recommended inbound and outbound rules for the workload.
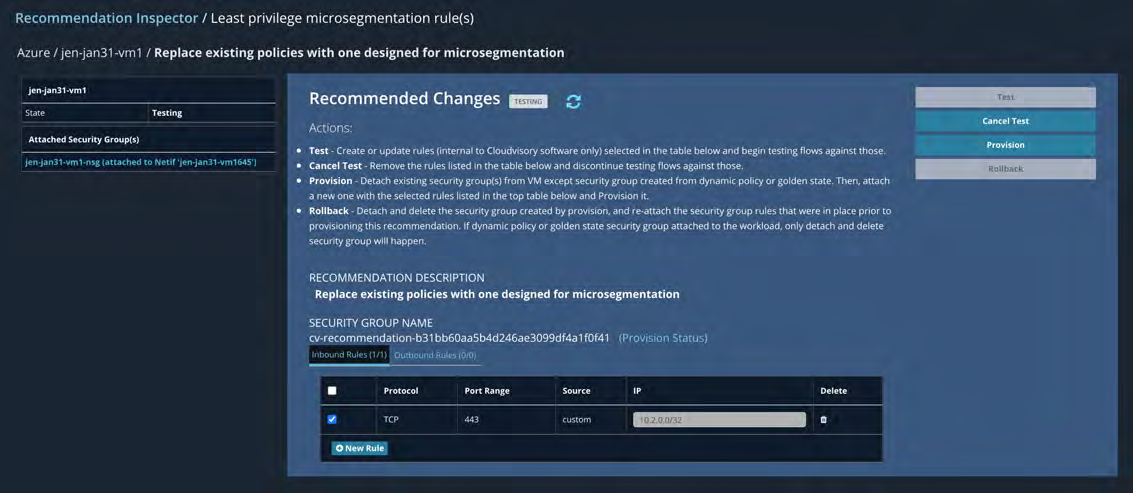
Testing a Recommendation
In the recommendation detail view, click Test to test the rules. You can add new rules or delete any recommended rules before testing. In test mode, Cloudvisory evaluates all new network flows against these rules and generates flow violation alerts. The alerts are displayed in the Network Flow visualization page. A red flow indicates that a violation occurred and the outbound flow did not match the recommendation. A green flow indicates that the flow matched the recommendation.
It is good practice to test any recommendation for a few days. You can also cancel the test at any time.
After testing, you can choose to provision the new rules or roll back to the previous rules.
Provisioning a Recommendation
After testing is complete, click Provision to provision the rules to the provider. After provisioning, a new security group with the recommended rules will be attached to the workload.
Copyright © 2021 Cloudvisory Documentation, Fireeye Inc.
101
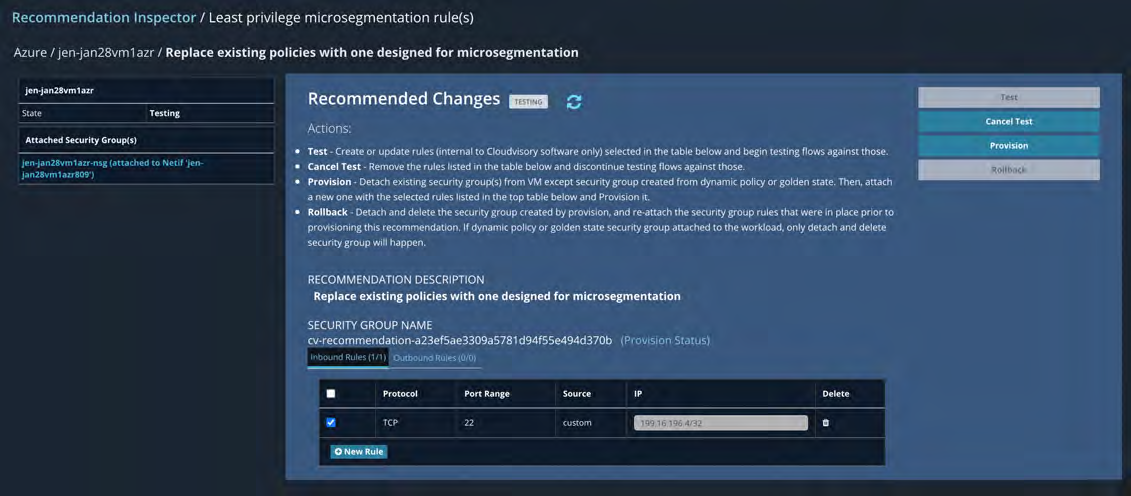
Rolling Back a Recommendation
Click Rollback to discard the changes and return the workload to its pre-test state.
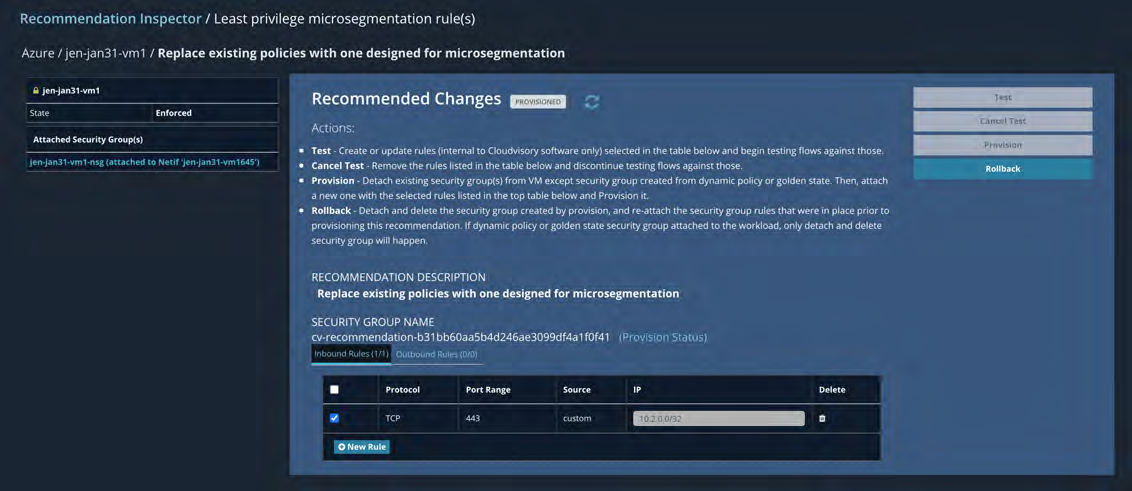
Copyright © 2021 Cloudvisory Documentation, Fireeye Inc.
102
Available Compliance Checks
View Available Checks
To View Admin Settings, go to Compliance > Available Checks
Use this page to define the system-wide usage of your compliance checks. A compliance check is an automated action to examine and compare the accuracy, quality, or condition of something to a defined best practice or expected result.
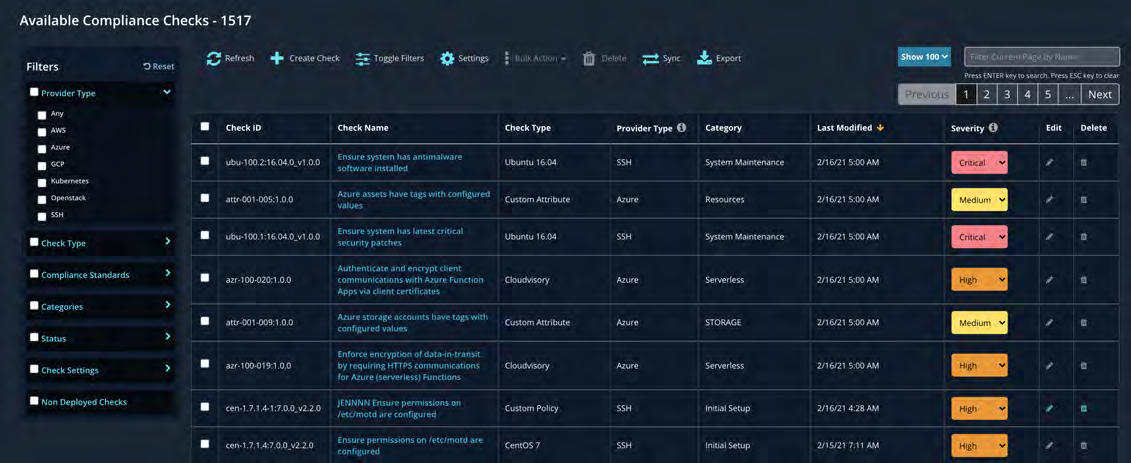
Compliance Check Result Types
Pass -- The check was successful (the expected result was obtained).
Fail -- The check was unsuccessful (the expected result was not obtained). A failed check is considered a potential security risk.
Error -- The check could not be performed due to a malformed request, malformed response, or connectivity issue.
Info -- The check provides information on which you may choose to take action. For example, a check might return all users with the Admin role. It is up to the operator to review the appropriate usage of that role.
Warn -- The check was unable to determine a pass or fail because of a problem, such as improper permissions, rate limiting, or missing data/files. View the details of the warning to determine how to rectify the situation.
Check Settings
Check Types
For better sorting and identification, checks are differentiated by type into custom network policy checks and Cloudvisory-defined checks. Companies that build their own custom checks would associate them with their own type (for example, ACME Checks).
Categories
Checks must be assigned to a category, such as Networking, IAM, Monitoring, and so on, for organization and reporting.
Provider
Checks can be affiliated with a specific provider or with all providers. You will only see the checks for the cloud providers for which you are licensed.
Severity
You can assign a severity level to a check, depending on the importance of that specific check. The severity level affects the score of a compliance report.
ID
All checks have unique IDs for referencing and auditing.
System Use
Checks can be enabled or disabled. When a check is enabled, it is available for usage in any compliance group in the system. When disabled, it is available in any compliance group.
Minimum Check Interval
The minimum amount of time that elapses after a check before it is run again. The minimum interval varies between checks and depends on what the cloud provider's infrastructure supports. For example, the AWS credential checks depend on a credential report available from AWS. The AWS credential report is generated only once every few hours (even if you request a new one). Hence, AWS credential checks have a minimum check interval of 1 hour.
Check Parameters
The rules that define the custom network policy check, such as Port: 8080 and Direction: Inbound.
Remediation Support
Some checks can be remediated directly through Cloudvisory. If a check has remediation support, then the remediation can be done automatically or by clicking a button.
Cloning a Compliance Check
By Selecting a single available checks you can clone and create new checks with new name, description and parameters.
Copyright © 2021 Cloudvisory Documentation, Fireeye Inc.
103
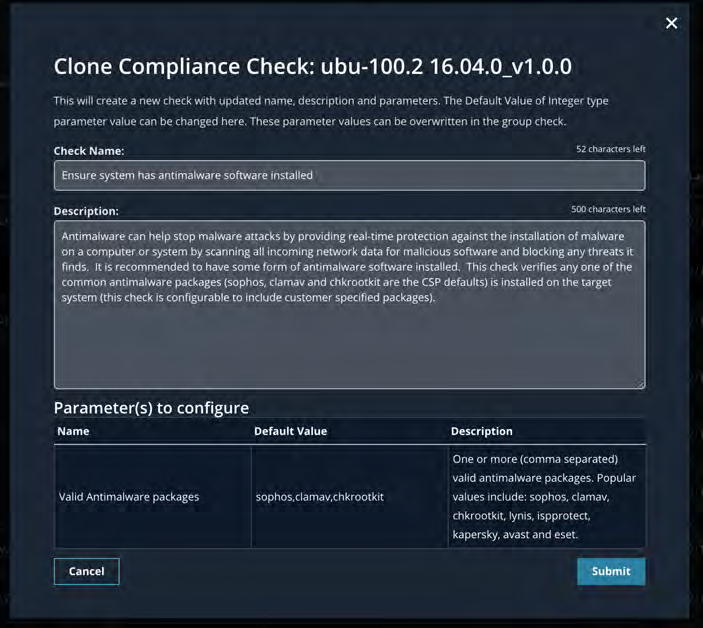
Delete a Compliance Check
Custom compliance checks can be deleted. Click the Delete icon on the right to delete the check.
You cannot delete Cloudvisory compliance check types. Only custom checks can be deleted. If you do not want a Cloudvisory check type to be used, then change its state to disabled.
The Delete icon is not available for system checks.
Create Custom Policy Checks
Compliance checks can be created from the Compliance Check configuration page and from the Network Policy Inspector page. Only custom network policy checks can be created through the Cloudvisory UI. SSH-based checks and custom Golang-based custom plugins can also be created.
Create Checks From Compliance > Available Checks
Go to Compliance > Available Checks.
Click on Create Check.
Fill in the appropriate fields:
Select a category.
Select a custom check type.
Select a provider.
Enter a name.
Enter a description (optional).
Click Next.
Copyright © 2021 Cloudvisory Documentation, Fireeye Inc.
104
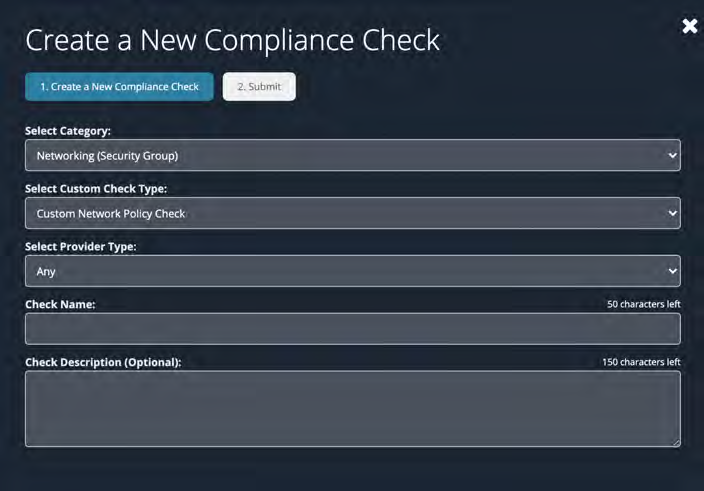
Add filters:
Click Add Filter.
Select an attribute under Column.
Select the expression under Filter (Equal to, greater than, less than).
Enter or select a value.
Click Submit.
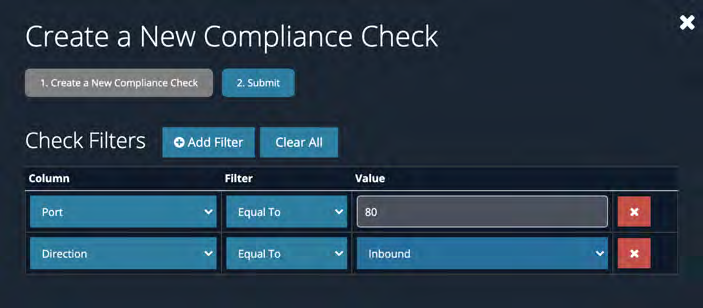
Create Checks from the Network Policy Inspector Page
Use search filters to create compliance checks on the Network Policy inspector page.
Click Filters.
Add filters and select the parameters for this check.
Click Find.
Click Save Compliance Check.
Configure the compliance check:
Enter a name and a description.
Select a provider.
Click Submit.
View Compliance Check Details
After a check is created, click on the check's name to view additional details. The compliance check popup contains information such as the check's name, description, minimum check interval, remediation support status, and check parameters.
Edit a Compliance Check
Edit an existing custom compliance check by clicking on the pencil icon on the right side of the table. The edit check button is not available for system checks.

In the popup, you can change the custom check's name and description.
Copyright © 2021 Cloudvisory Documentation, Fireeye Inc.
105
[IMAGE PLACEHOLDER: "Edit ubu-100.2" modal showing Name and Description fields with character counters and a dark blue modal background]
Changing a Check's Status
Change the status of a check to enable or disable the check in the Cloudvisory system. When enabled, the check will be available in all Compliance Groups. If a check is disabled, it will not be available for use in any Compliance Group, even if the check was previously active in a Compliance Group. The default state of a check in a Compliance Group is "inactive".
[IMAGE PLACEHOLDER: "Customize Columns" modal showing a list of checkboxes for Category, Check Type, ID, Last Modified, Name, Provider Type, Severity, and System Use with Cancel and Apply buttons on a dark blue background]
Click the dropdown under System Use to change the status to enabled or disabled.
Changing a Check's Severity
The default check severity can be changed for every compliance check. The default severity setting is assigned to the check in any new Compliance Group and can be overridden when you configure the Compliance Group. Check severity is used for alerts, sorting, and scoring.

Click the dropdown under Severity to assign a severity level to a Compliance Check. The default level is Medium.
Changing Multiple Check Settings
You can change settings such as enabling/disabling and severity levels on multiple Compliance Checks simultaneously.
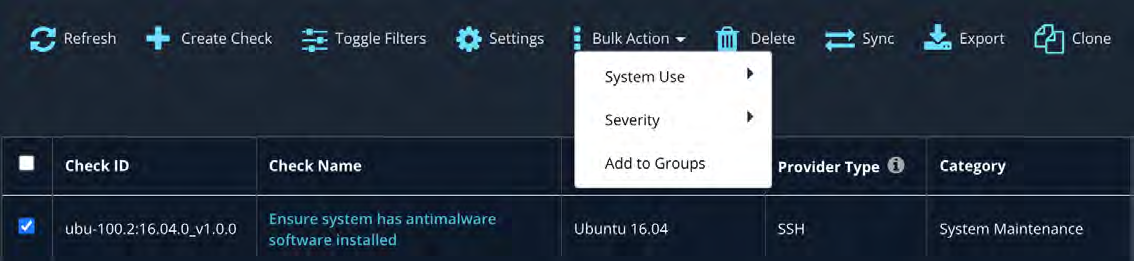
Use the checkboxes to select compliance checks that need to be changed. Click the Bulk Actions dropdown at the top menu to change the settings.
Filtering/Pagination/Sorting
Use filters, pagination and sorting to quickly find compliance checks and to refine your search.
Copyright © 2021 Cloudvisory Documentation, Fireeye Inc.
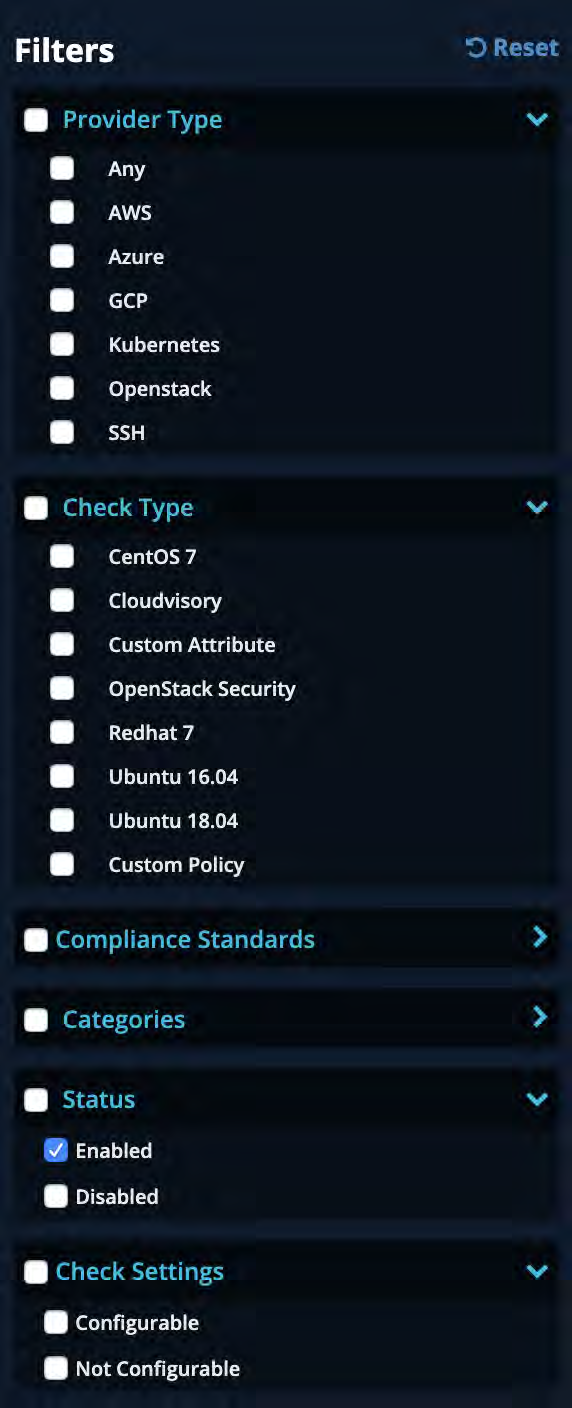
Filters Reset
Provider Type
Any
AWS
Azure
GCP
Kubernetes
Openstack
SSH
Check Type
CentOS 7
Cloudvisory
Custom Attribute
OpenStack Security
Redhat 7
Ubuntu 16.04
Ubuntu 18.04
Custom Policy
Compliance Standards
Categories
Status
Enabled
Disabled
Check Settings
Configurable
Not Configurable
Copyright © 2021 Cloudvisory Documentation, Fireeye Inc.
107
Custom Compliance SSH Checks
FireEye Cloudvisory (CV) ships with many compliance checks which are SSH based - meaning CV connects to one or more systems via SSH, performs some form of validation or remediation, and returns the result in a form that is consumable by CV and displayed in the UI. Examples shipped with FireEye Cloudvisory include CIS-based compliance checks for CentOS, Redhat and Ubuntu operating systems.
Customers can create similar custom checks specific to their environment and requirements. FireEye Cloudvisory supports this by reading YAML files that conform to the SSH check specification from a specific directory. See below for examples of this specification.
Specification/Examples
Below is the required form of yaml consumed by FireEye Cloudvisory. To ensure portability, it is recommended that shell code be POSIX compliant. This file illustrates several different checks with comments/documentation of the various yaml sections.
config: &ssh-config
SharedCode: |
#!/bin/sh
#
#
# Functions to return failure, info, warning or error results
#
res_num=0
fail_type="Failure"
info_type="Information"
warn_type="Warning"
err_type="Error"
pass_res_num=0
pass_type="Pass"
clear_results() {
res_num=0
res=""
detail_type=""
details=""
pass_details=""
pass_res_num=0
pass_res=""
}
pass_with_results () {
numargs=$#
if [ "$numargs" -ge 2 ]; then
add_pass_result "Details" "${@:2}"
fi
printf '[CLOUDVISORY]{"Details": [ $res ], \"PassDetails\": [ $pass_res ],\"TotalCount\": $1 }[CLOUDVISORY]\n'
}
add_pass_result() {
pass_res_num=$(expr "$pass_res_num" + 1)
pass_details="\"_Type\":\"$pass_type\""
numargs=$#
i=1
while [ "$i" -le "$numargs" ]
do
pass_details="$pass_details,\"$1\":\"$2\""
i=$(expr "$i" + 2)
shift 2
done
if [ "$pass_res_num" -eq 1 ]; then
pass_res="${pass_details}"
else
pass_res="$pass_res,${pass_details}"
fi
}
add_info_result() {
detail_type="$info_type"
add_result "$@"
}
add_warn_result() {
detail_type="$warn_type"
add_result "$@"
}
add_err_result() {
detail_type="$err_type"
add_result "$@"
}
add_fail_result() {
detail_type="$fail_type"
add_result "$@"
}
add_result() {
res_num=$(expr "$res_num" + 1)
# if no type provided, then set to fail type
if [ ! "$detail_type" ]; then
detail_type="$fail_type"
fi
details="\"_Type\":\"$detail_type\""
numargs=$#
i=1
while [ "$i" -le "$numargs" ]Copyright © 2021 Cloudvisory Documentation, Fireeye Inc.
108
do
details="$details,\"$1\":\"$2\""
i=$(expr "$i" + 2)
shift 2
done
if [ "$res_num" -eq 1 ]; then
res="${details}"
else
res="$res,${details}"
fi
detail_type=""
#
# Function to indicate check has passed (with the
# the number of checks that have passed).
#
pass () {
printf '[CLOUDVISORY]{"Details": [ ], \"PassDetails\": [ $pass_res ],\"TotalCount\": $1 }[CLOUDVISORY]\n'
}
#
# Function to indicate check has failed
#
fail () {
add_result "Details" "$2"
printf '[CLOUDVISORY]{"Details": [ $res ], \"PassDetails\": [ $pass_res ],\"TotalCount\": $1 }[CLOUDVISORY]\n'
}
return_results () {
printf '[CLOUDVISORY]{"Details": [ $res ], \"PassDetails\": [ $pass_res ],\"TotalCount\": $1 }[CLOUDVISORY]\n'
}
#
# Check if file has desired permission
#
test_file_perms_le() {
local file="${1}"
local pattern="${2}"
local pattern_user=$(echo $pattern | cut -c1)
local pattern_group=$(echo $pattern | cut -c2)
local pattern_world=$(echo $pattern | cut -c3)
perms=$(sudo stat -c %a $file)
user=$(sudo stat -c %u $file | cut -c1)
group=$(sudo stat -c %g $file | cut -c2)
world=$(sudo stat -c %a $file | cut -c3)
if [ "$user" -gt "$pattern_user" ] || [ "$group" -gt "$pattern_group" ] || [ "$world" -gt "$pattern_world" ]; then
echo "$perms"
return
fi
echo "$pattern"
}
#
# Common code goes here, can be re-used by multiple checks in
# this yaml file.
#
# Common function to check the ownership of a file
#
get_ownership() {
local file="${1}"
local owner=$(stat -L -c "%U:%G" ${file})
echo "$owner"
}
Connection:
#
# This section is for testing, can put connection specifics
# here for iterative testing.
#
Hostnames:
Port:
Username:
Password:
KeyData:
checks:
- Id: ssh-999-001
Config: *ssh-config
Name: "Check that illustrates returning a check failure"
OrgId:
BusinessUnitIds:
ConfigParms:
Tags:
- Key: Compliance Standards
Value:
- FireEye DemoA
DefaultSeverity: "MEDIUM"
Description: >
A sample check to illustrate check failure.
Instructions: >
Can put HTML here for instructions on how to manually remediate here.
CanAutoRemediate: false Service: "SSH" Provider: "SSH" MinimumRunInterval: 60 CheckType: "Custom SSH" Category: "Example" Version: "1.0.0"
Copyright © 2021 Cloudvisory Documentation, Fireeye Inc.
109
CheckCode: |
#
# Put actual check code here, then use functions from the common
# section above to return results to CSP in the correct form.
#
add_fail_result "Details" "This check has failed"
return_results 1
- Id: ssh-999-002
Config: *ssh-config
Name: "Check that illustrates returning a check warning"
OrgId:
BusinessUnitIds:
ConfigParms:
Tags:
- Key: Compliance Standards
Value:
- _FireEye Demo B
DefaultSeverity: "MEDIUM"
Description: >
A sample check to illustrate check warning.
Instructions: >
<p>Can put HTML here for instructions on how to manually remediate here.</p>
CanAutoRemediate: false
Service: "SSH"
Provider: "SSH"
MinimumRunInterval: 60
CheckType: "Custom SSH"
Category: "Example"
Version: "1.0.0"
CheckCode: |
#
# Put actual check code here, then use functions from the common
# section above to return results to CSP in the correct form.
#
add_warn_result "Details" "This check has is returning a warning"
return_results 1
- Id: ssh-999-003
Config: *ssh-config
Name: "Check that illustrates success"
OrgId:
BusinessUnitIds:
ConfigParms:
Tags:
- Key: Compliance Standards
Value:
- FireEye Demo A
DefaultSeverity: "MEDIUM"
Description: >
A sample check to illustrate check success.
Instructions: >
<p>Can put HTML here for instructions on how to manually remediate here.</p>
CanAutoRemediate: false
Service: "SSH"
Provider: "SSH"
MinimumRunInterval: 60
CheckType: "Custom SSH"
Category: "Example"
Version: "1.0.0"
CheckCode: |
#
# Put actual check code here, then use functions from the common
# section above to return results to CSP in the correct form.
#
pass 1
- Id: ssh-999-004
Config: *ssh-config
Name: "Check that illustrates a check that supports remediation"
OrgId:
RemediationDescription: >
<p>Remediation will perform the following actions:
<ol>
<li>Test Remediation descriptipn</li>
</ol>
</p>
BusinessUnitIds:
ConfigParms:
Tags:
- Key: Compliance Standards
Value:
- FireEye Demo B
DefaultSeverity: "MEDIUM"
Description: >
A sample check to illustrate a check supporting remediation.
Instructions: >
<p>Can put HTML here for instructions on how to manually remediate here.</p>
CanAutoRemediate: true
Service: "SSH"
Provider: "SSH"
MinimumRunInterval: 60
CheckType: "Custom SSH"
Category: "Example"
Version: "1.0.0"
ResultParams:
- File
- Desired-Value
- Actual-Value
CheckCode:
f="/tmp/some_file_to_test"
desired_perm='600'
desired_ownership="root:root"Copyright © 2021 Cloudvisory Documentation, Fireeye Inc.
if [ -f "$f" ]; then
perm=$(test_file_perms_le "$f" "$desired_perm")
if [ "$perm" -eq "$desired_perm" ]; then
ownership=$(get_ownership "$f")
if [ "$ownership" = "$desired_ownership" ]; then
add_fail_result "Details" "File ownership not correct" "File" "$f" "Desired-Value" "$desired_ownership" "Actual-Value" "$ownership"
else
add_pass_result "Details" "File ownership and permissions are correct" "File" "$f" "Desired-Value" "$desired_ownership" "Actual-Value" "$ownership"
fi
else
add_fail_result "Details" "File permissions are not correct" "File" "$f" "Desired-Value" "$desired_perm" "Actual-Value" "$perm"
fi
else
add_warn_result "Details" "File not found" "File" "$f"
fi
return_results 1
RemediationCode: |#
# This is the code called when the user clicks remediate in the
# UI, this example code is setting the ownership of the file
# that failed the CheckCode above. The file name(s) are injected
# into the script below by the CSP calling program:
#
files='{{CLOUDVISORY_File}}'
desired_perm='600'
desired_ownership='root:root'
num=0
IFS="|"
for file in $files
do
num=$(expr "$num" + 1)
command=`sudo chmod $desired_perm $file > /dev/null`
retVal=$?
if [ "$retVal" -ne 0 ]; then
add_fail_result "Details" "chmod $desired_perm failed with return code: $retVal" "File" "$file"
else
command=`sudo chown $desired_ownership $file > /dev/null`
retVal=$?
if [ "$retVal" -ne 0 ]; then
add_fail_result "Details" "chown $desired_ownership failed with return code: $retVal" "File" "$file"
fi
fi
done
if [ "$num" -eq 0 ]; then
pass 1
else
return_results "$num"
fiTesting Your Checks
Once you have your yaml written, you'll need to test it. CV ships with a test program that allows you to run the code before deploying (below) for consumption by CV. You'll need to login to one of the 'consolidated' nodes where the 'cvcomptest' executable is installed. The easiest way to login to this system is to login to the inception server as the 'ansible' user, then ssh to one of the consolidated nodes, then change to the 'cvuser'.
NOTE
Contact your Cloudvisory representative if you don't know how to do this or have access to the inception server as the 'ansible' user.
Create/copy your yaml file to the directory read by the ssh compliance plugin:
% cp /tmp/mychecks.yaml /opt/cloudvisory/compliance/engine-2.3.9-compliancesvc/plugins/checks/ssh (make sure version is correct)
Create a json file with your SSH credentials, and set and environment variable (later used by the test program):
% cat /tmp/mysshcreds.json:
{ "Provider": { "SSHCheckConfig": [ { "Port": "22", "Username": "YOUR_USER_NAME", "KeyData": "YOUR_KEY", "Targets": [ "YOUR_IP" ] } ] } }Note: KeyData must be in one line, For eg:
-----BEGIN RSA PRIVATE KEY----- MIIJKQIBAAKCAgEAsuCNX/on3jXhXGIMrLf/9f1SHCd00JEuLK4p5UwcTr0ZFDmr ... -----END RSA PRIVATE KEY-----% export TESTCLI_PARAMS=/tmp/mysshcreds.json
% export TESTCLI_PLUGIN=/opt/cloudvisory/compliance/engine-2.3.9-compliancesvc/plugins/checks/ssh.so
Run the testcli, it should display your checks.
% cd /opt/cloudvisory/compliance/engine-2.3.9-compliancesvc
% ./cvcomptest
Attempting to load: /opt/cloudvisory/compliance/engine-2.3.8-compliancesvc/plugins/checks/ssh.so
+---------------------------------------+
| ID | NAME |
+---------------------------------------+
| ssh-999-001 | Check that illustrates |
| | returning a check |
| | failure |
+---------------------------------------+Copyright © 2021 Cloudvisory Documentation, Fireeye Inc.
| ssh-999-002 | Check that illustrates
| | returning a check warning
| ssh-999-003 | Check that illustrates success
| ssh-999-004 | Check that illustrates a check
| | that supports remediation
+------------+------------------------------------------------------+4. Run a check:
command (or help): ssh-999-001
Enter 1 (run), 2 (remediate), or 3 (display): 1
RUN RESULTS----------------------------------------------------------------
SUMMARY: Check Failed: Check that illustrates returning a check failure
TOTAL CHECKS: 1, PASSED: 0, FAILED: 1, INFO: 0, WARN: 0, ERRORS: 0
Failures and Error Details:
+-----------+---------+------------------+---------------------------+----------+----------+
| # | ISERROR | SSHHOSTNAME | DETAILS | PROVIDER | CATEGORY |
+-----------+---------+------------------+---------------------------+----------+----------+
| 1 | false | 34.232.126.226 | This check has failed | SSH | Example |
+-----------+---------+------------------+---------------------------+----------+----------+Deploying your custom yaml file(s)
Once you've created the yaml file you wish to deploy, you then need to login to the FireEye Cloudvisory (CV) inception server (as the 'ansible' user), to deploy it (the file must exist somewhere on the filesystem of the inception server).
NOTE
Contact your Cloudvisory representative if you don't know how to do this or have access to this server.
our file name (or file names) are passed to the ansible playbook as an argument (with the ansible -e option). This playbook will stop the necessary CV services, copy the specified files to the necessary nodes, and then restart the services.
NOTE
The FireEye Cloudvisory UI will be briefly unavailable during this deployment
ansible-playbook /etc/ansible/playbooks/compliance/deploy-custom-ssh-checks.yml -e 'custom_files=/tmp/ssh_checks_1.yaml,/tmp/ssh_checks_2.yaml'After the playbook runs successfully, it will take up to 10 minutes for your new checks to become visible in the UI, and to be available for inclusion in a Compliance Group.
CAUTION
Special Considerations
You must be careful to choose a unique 'Id:' and 'Version:' combination for your ssh checks. If you have two checks with the same Id/Version combination, CSP will only display one of the two (non-deterministic).
Upgrading CSP will require that you repeat the ansible playbook execution mentioned above to install your custom check with the new version of CSP.
Custom Compliance Golang Checks
This document describes the process to build a custom check using the Golang programming language.
Building Golang Plugin Checks
Preconditions
Plugins are a recent addition to the Go language, and in order to build a plugin that can be loaded by the Cloudvisory application there are a few specific steps which are necessary (these constraints are imposed by Golang's plugin architecture):
Golang version 1.10.3 (linux/amd64 architecture) is required.
The environment to build the plugin should have the same runtime environment as the system used to build the Cloudvisory application.
The same GOPATH directory structure as CSP is built with.
The complianceplugin github repo must be checked out in your GOPATH directory (not satisfied with a glide/vendor dependency).
Building the sample plugins
Below are example steps for configuring an ubuntu instance to checkout and build the example checks:
Install an ubuntu 18 server.
Login to the server.
Install some needed packages:
sudo apt install make sudo apt install golang-glide sudo apt install gcc cd /home/ubuntuInstall the correct version of go:
curl -L http://golang.org/dl/go1.10.3.linux-amd64.tar.gz | tar zxvExport environment variables (can put these in ~/.bashrc file):
export GOPATH=/home/ubuntu/workspace/compliance_release/go << this path is important to deploy the custom check build with released version of compliance. If it is hotfix, it may be compliance_hotfix. export GOROOT=/home/ubuntu/go/ export GOBIN=/home/ubuntu/go/bin/ export PATH=/home/ubuntu/go/bin:$PATHCreate the correct directory structure (very important):
mkdir -p ${GOPATH}/src/github.com/cloudvisory/ cd ${GOPATH}/src/github.com/cloudvisory/Checkout the github/cloudvisory/complianceplugin repository (you will need to provide your github user name to your Cloudvisory support contact to access this private repo):
git clone https://github.com/cloudvisory/complianceplugin.git (enter your username and password when prompted) git fetch --tags git checkout <VERSION> (this version must match the CSP release of your installation)
Description of plugin interface
In the complianceplugin repository, there is a types/types.go file which defines the interface that needs to be followed by a plugin so that it can be imported by Cloudvisory:
~/workspace/compliance_release/go/src/github.com/cloudvisory/complianceplugins$ tree types
types
└── types.goIn the sample directory, there is a very simple example check which doesn't do much, but implements the interface mentioned above and conveys the minimal code you need to build (customCheck001):
~/workspace/compliance_release/go/src/github.com/cloudvisory/complianceplugins$ tree sample
sample
├── custom_check.go
└── main.goIt is recommended that you get familiar with this code first, as well as ensure you can build the plugin before you go much further. To build the examples, run make:
~/workspace/compliance_release/go/src/github.com/cloudvisory/complianceplugins$ make
go build -buildmode=plugin -o custom.so sample/*.go
go build -buildmode=plugin -o custom_aws.so custom_aws/*.goOnce familiar with the simple example, you can dig deeper and see some examples of checks that interact with AWS and perform various checks and remediations:
~/workspace/compliance_release/go/src/github.com/cloudvisory/complianceplugins$ tree custom_aws
custom_aws
├── aws-500-001-v1_0_0.go
├── aws-500-002-v1_0_0.go
├── aws-500-003-v1_0_0.go
├── aws-500-004-v1_0_0.go
├── aws-500-005-v1_0_0.goCopyright © 2021 Cloudvisory Documentation, FireEye Inc.
113
├─ aws-500-006-v1_0_0.go
└─ main.goThere are many helper methods in the custom_aws/main.go file that will be useful for extracting values that are passed in to your check at execution time (provider credentials, region, etc.). Spend a bit of time looking at these AWS examples, as they are working/realistic examples of provider interaction. You can now take these examples, and begin creating your own directory (parallel to the 'cloudvisory' directory in your GOPATH) to write y You can copy various *.go files, glide.yaml file (be sure to change your package name), and the Makefile to begin building your more useful custom plugin.
CAUTION
Ensure that when you run glide up --quick as opposed to simply glide up when building your plugin (this command is in the Makefile). It is necessary that the compliance plugin types interface dependency be satisfied in your GOPATH instead of the vendor directory - and this is accomplished with the --quick argument to glide. If this argument isn't specified when building your plugin, it will not load properly.
Testing Golang Plugin Checks
Once you have your plugin built, you'll need to test it. CSP ships with a test program that allows you to run the code before deploying (below) for consumption by CSP. You'll need to login to one of the 'consolidated' nodes where the 'cvcomptest' executable is installed. The easiest way to login to this system is to login to the inception server as the 'ubuntu' user, then ssh to one of the consolidated nodes. Contact your Cloudvisory representative if you don't know how to do this or have access to the inception server as the 'ubuntu' user.
1. Create/copy your plugin file to the directory read by the compliance plugin:(make sure Version is correct)
cp custom.so /opt/cloudvisory/compliance/engine-<Version>-compliancesvc/plugins/2. Create a credentials file for your provider which will be read by the test program. The format of this file is similar to the input parameters for your custom check at runtime:
cat ~/aws_creds.json{
"Parameters":{
"provideraccount":"AwsProvider"
},
"Provider":{
"Parameters":{
"AccessKey":"REDACTED",
"SecretKey":"REDACTED"
},
"Scope":[
{
"Key":"Region",
"Value":"us-west-2"
}
]
}
}3. Export a variable that points to this file:
export TESTCLI_PARAMS=/home/ubuntu/aws_creds.json4. Export another variable which tells the test program which plugin you wish to test:
export TESTCLI_PLUGIN=/opt/cloudvisory/compliance/engine-<Version>-compliancesvc/plugins/checks/custom.so5. Run the testcli, it should display your new checks:
% cd /opt/cloudvisory/compliance/engine-4.5.3-compliancesvc
% ./cvcomptest
Attempting to load: /opt/cloudvisory/compliance/engine-4.5.3-compliancesvc/plugins/checks/custom.so
+------------------------------------------------------+
| ID | NAME |
+------------------------------------------------------+
| custom-001 | Test Custom Check custom-001 |
+------------------------------------------------------+6. You can call the Run() and Remediate() methods on your plugin from the test program:
command (or help): custom-001
Enter 1 (run), 2 (remediate), or 3 (display): 1
RUN RESULTS-------------------------------------------------------
SUMMARY: Custom Check 001 succeeded.
TOTAL CHECKS: 1, PASSED: 0, FAILED: 1, INFO: 0, WARN: 0, ERRORS: 0
Failures and Error Details:
+----+---------+---------------+----------+------------+
| # | ISERROR | REGION | PROVIDER | CATEGORY |
+----+---------+---------------+----------+------------+
| 1 | false | sample_region | Any | MONITORING |
+----+---------+---------------+----------+------------+Deploying your custom plugins
Copyright © 2021 Cloudvisory Documentation, Fireeye Inc.
114
Once you've created the golang plugin file you wish to deploy, you then need to login to the CSP inception server (as the 'ubuntu' user), to deploy it (the file must exist somewhere on the filesystem of the inception server).
[IMAGE PLACEHOLDER: Circular information icon with letter "i" inside]
NOTE
Contact your Cloudvisory representative if you don't know how to do this or have access to this server.
Your file name (or file names) are passed to the ansible playbook as an argument (with the ansible -e option). This playbook will stop the necessary CSP services, copy the specified files to the necessary nodes, and then restart the services.
[IMAGE PLACEHOLDER: Circular information icon with letter "i" inside]
NOTE
The CSP UI will be briefly unavailable during this deployment
$ source /home/ubuntu/csp-ansible-installer/env/env.csp-ansible.local
$ csp-ansible.playbook.run compliance/deploy-custom-plugins.yml -e 'custom_files=/tmp/custom.so'After the playbook runs successfully, it can take up to 10 minutes for your new checks to become visible in the UI, and to be available for inclusion in a Compliance Group.
[IMAGE PLACEHOLDER: Yellow triangular caution icon with exclamation mark inside]
CAUTION
Special Considerations
Upgrading CSP will require that you re-compile your plugin and repeat the ansible playbook execution mentioned above to install your custom plugin with the new version of CSP.
Compliance Groups
Definition
You can divide your accounts into compliance groups and configure compliance checks and reports for all the accounts in a group. Compliance groups are useful if you want to view your security posture by environment (for example, Development, Production, and Staging), business unit, location, and so on.
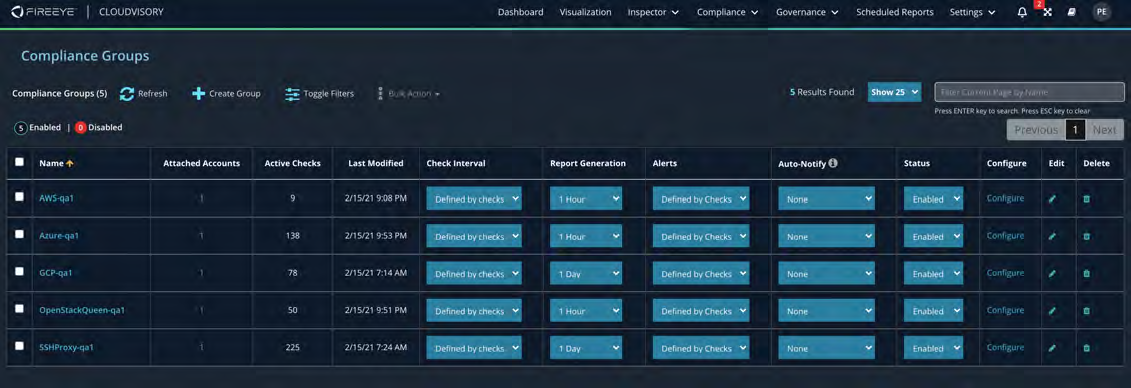
Terms and Definition
Compliance Groups
A Compliance Group is a group of Cloudvisory provider accounts that receive a collection of Compliance Checks for the purpose of configuring and reporting results.
Compliance Groups Status
Compliance groups can be enabled or disabled. An enabled group will run all automated checks and generate automated reports. A disabled group will pause all automated checks and report generation.
Account
Provider accounts can be assigned to compliance groups. The types of accounts will determine which checks can be configured in this group.
Check Interval
All the checks in the Compliance Group can be configured to run at a given interval.
Report Interval
The Compliance Group can be configured to automatically generate a report at a given interval.
Alerts
All the active checks in a Compliance Group can be configured to trigger alerts. Alerts are displayed in the Cloudvisory UI and emails are sent to subscribers of the associated provider accounts.
Create Compliance Groups
Consider the following things when you determine how to create and name compliance Groups.
How do you want to report on compliance?
By environment?
By ownership?
By Line of Business?
By cloud provider?
By site?
How are your provider accounts currently structured?
This will often dictate how you can group accounts.
A provider account can only be associated with a single Compliance Group. If you only use a single provider account to discover and manage all your infrastructure, regardless of how it is used (development, production) or by whom it is used (team, business unit), then you also must use a single Compliance Group to check and report on compliance for those resources.
Copyright © 2021 Cloudvisory Documentation, Fireeye Inc.
[IMAGE PLACEHOLDER: "Create a New Compliance Group" dialog showing form fields for Name, Description, Notification Email and tabs labeled "1. General Information" and "2. Submit". Dark themed UI screenshot.]
Step 1: Create a Compliance Group
Click on Create Group.
Enter a name for the group.
Enter a description (optional).
Click Next.
Step 2: Select Accounts for the Group
A provider account cannot be used in more than one group.
Select a provider from the dropdown.
Select one or more accounts to be assigned to this group.
Click Submit.
Compliance Group Settings
Group-level settings define the behavior of the group. By default, group settings override the settings of the individual checks in the group. You can allow individual check settings to take precedence over group settings.
Status
A compliance group can be Enabled or Disabled. When a group is disabled, the group's checks will not be run, reports will not be generated, and alerts/notifications will not be created. Disabling a compliance group is useful when you know its resources may be entering a maintenance window and you do not want compliance checks to be running.

Check Interval
The interval at which Cloudvisory runs the compliance checks on the entire group. The group level interval overrides all individual check settings. You can retain each individual check's interval by selecting "Defined by Checks."
Individual checks specify their own minimum check interval. Some checks you may be able to run as often as every 5 minutes, while others you may only be able to run once per hour.
If you specify a compliance group check interval that is shorter than the minimum interval of a check within the compliance group, that check's minimum check interval will be used for that check only. For example, if you set the Compliance Group check interval to 1 hour, but there are some checks in the Compliance Group that have a minimum check interval of 6 hours, then for those checks only, the 6-hour interval will be used.
When choosing a check interval for a compliance group, consider how often you really need to run the check. Many cloud providers have rate-limiting enabled on their API endpoints, and setting too short an interval can trigger rate limiting.

The Check Interval dropdown displays all the interval options for that group. "Define by Checks" means that the individual settings for each Compliance Check will take effect.
Report Generation
How often the compliance reports will be generated. Reports can be generated as frequently as hourly. For most compliance reporting, daily reports are sufficient. Remember that at any time, you can generate an on-demand report.

The Report Generation dropdown displays all the interval options for that group. "On Demand" stops the automated report generation and requires users to generate reports manually.
Copyright © 2021 Cloudvisory Documentation, Fireeye Inc.
Alert Notification
Alert notifications can be sent to administrators/operators by email if there are any compliance violations. The group-level alert notifications override all individual check settings, unless "Defined by Checks" is selected. Use the dropdown in the Alerts column.

The compliance alert email notifications can be turned on or off for all of the checks within a group. "Define by Checks" means that the individual settings for the Compliance Checks will take effect.
Changing Multiple Compliance Group Settings
Settings such as enabling/disabling compliance groups, group-level check intervals, report generation and alert notifications can be set on multiple compliance groups simultaneously.
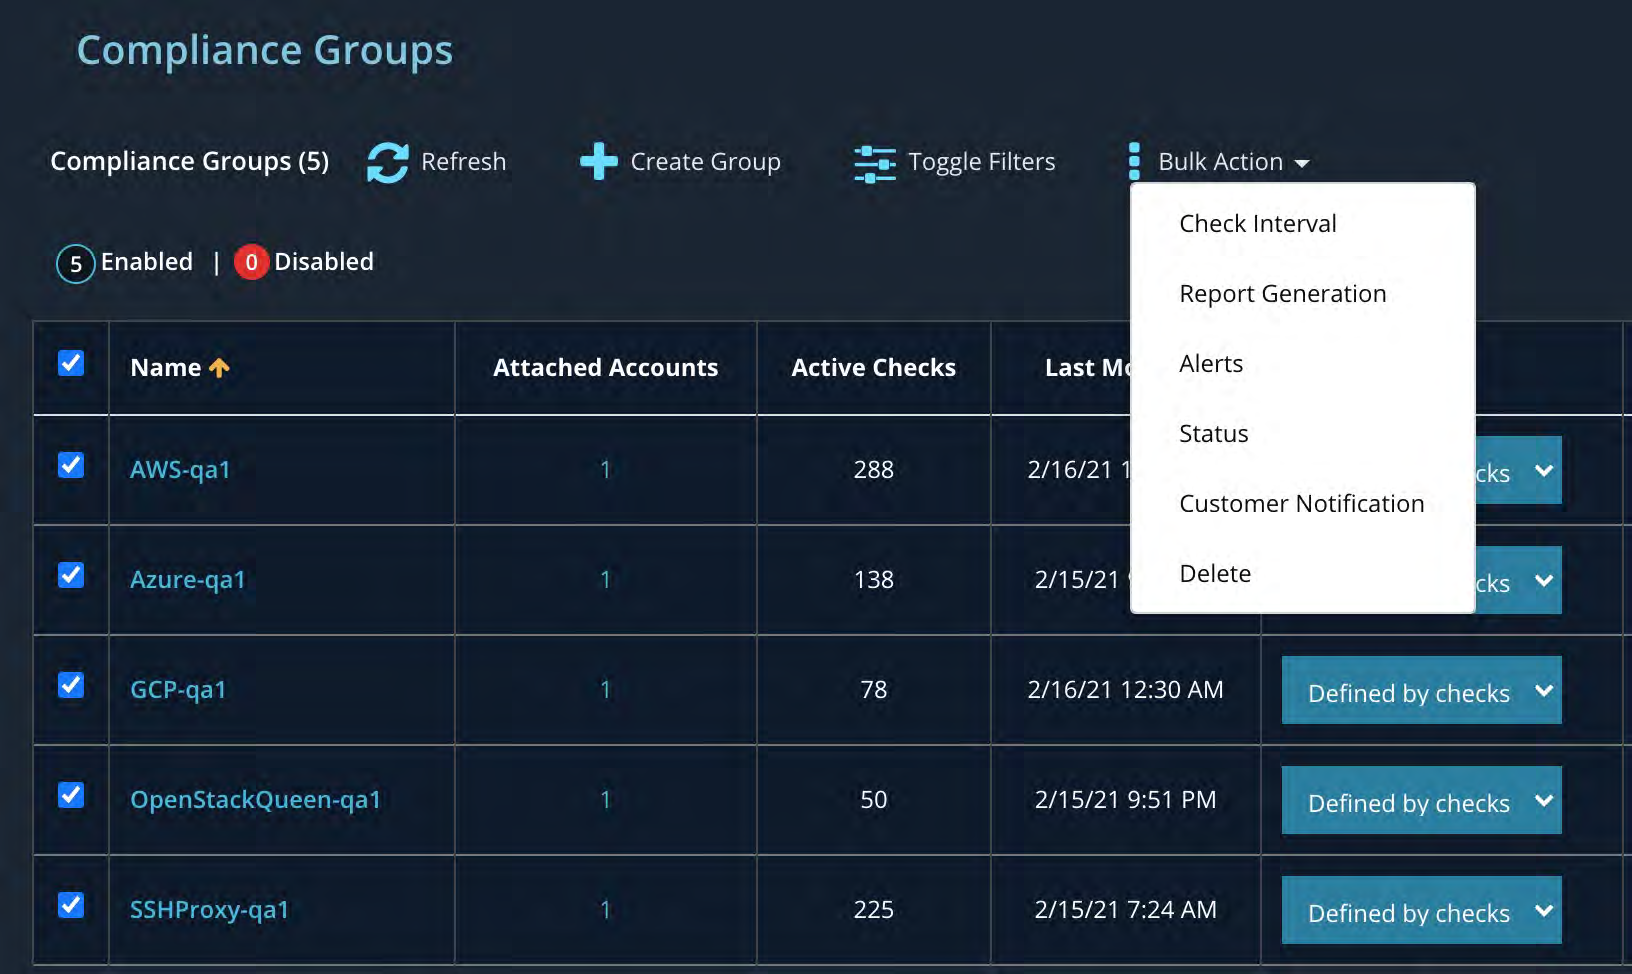
To change multiple settings simultaneously, select the checkboxes and use the Bulk Actions dropdown.
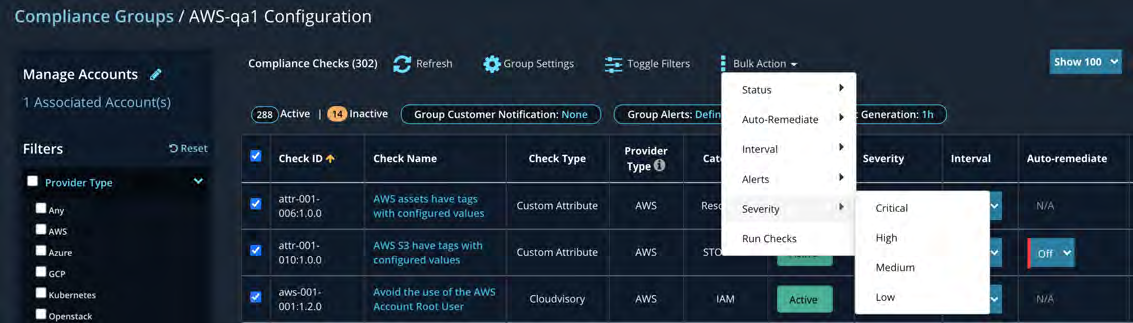
Changing the Name or Description of a Compliance Group
To edit an existing compliance group, click the pencil icon on the right side of the table.
Copyright © 2021 Cloudvisory Documentation, Fireeye Inc.
118
Clicking the edit icon opens a popup where you can change a Compliance Group's name and description.
Deleting Groups
Deleting a group stops all compliance check and automated report activity. Any prior reports will remain available in the historical view.
Clicking the delete icon opens a popup to confirm the group's deletion.
Filtering/Sorting Compliance Groups
Click Toggle Filters to filter the Compliance groups. Use pagination and sorting to quickly find groups or refine your Compliance Groups search.
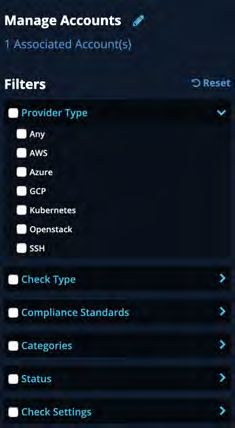
Filters are on the left frame. Pagination can be found at the top and the bottom of the table. Sorting can be done at the header of each column.
Adding Compliance Checks to a Compliance Group
Changes to the compliance group configuration settings do not affect any instances of compliance checks outside that group.
To configure the checks within a Compliance Group, click the Configure button on the right side of the screen.
Copyright © 2021 Cloudvisory Documentation, Fireeye Inc.
119
Clicking Configure displays a list of all of the compliance checks that are available for the Compliance Group. Available checks may vary depending on the types of associated provider accounts.
No checks are visible in the Compliance Group if no provider accounts have been associated with the group. When one more provider accounts are associated, the relevant checks will appear. You may need to refresh the page.
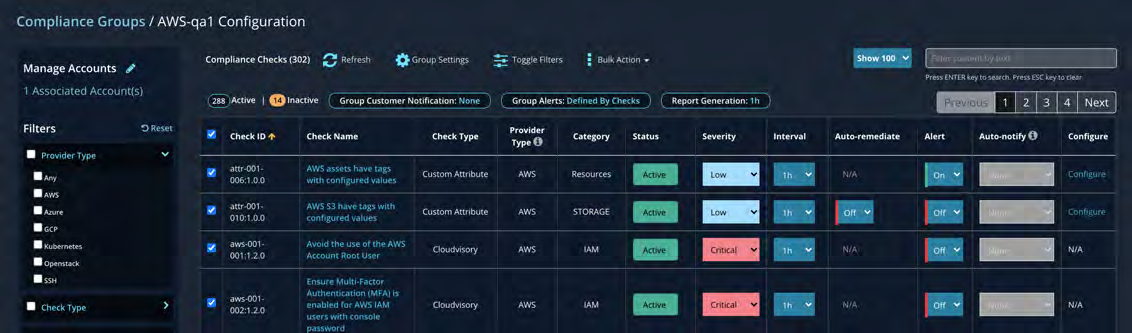
Group-level settings, such as Group Alerts, Check Intervals or Report Generation, are displayed at the top of the screen. Some group-level settings override individual compliance check settings. To enable the individual check settings, open the Group Settings and select Defined by Check for the desired option.

By default, checks added to a group are inactive until you enable them.
Compliance Check Settings within a Compliance Group
Enable/Disable Check
Checks by default are inactive in Compliance Groups. To make a check active, click the "Inactive" toggle to change it to "Active." To disable a check for the group, change toggle to "Inactive" again.
When a check is inactive, the group will no longer run that check or show it in future reports. It will still be visible in reports that were generated when it was active.
Inactive checks in a compliance group are disabled only for that specific group. All instances of the check outside the group are still active.

Clicking on enable/disable for a Compliance Check will open a popup to confirm your action.
Severity Level
The severity level of a specific compliance check can be changed in a group. Changing the severity affects the way the reports are scored and how alerts/notifications are propagated. Use the dropdown in the Severity column for the check.
Changing this setting will not affect any instances of this compliance check in other Compliance Groups.
Check Interval
If the the group setting for check interval is set to Defined by Checks, you can change the check interval for individual checks. Use the dropdown in the Interval column.
All checks have a minimum check interval defined. Some checks you may be able to run as often as every 5 minutes, while others you may only be able to run once per hour.
When choosing a check interval, keep in mind that many cloud providers have rate-limiting enabled on their API endpoints. Setting too small an interval can trigger rate limiting.
NOTE Changing this setting will not affect any instances of this compliance check in other Compliance Groups.

Auto Remediation
If auto remediation is enabled, then Cloudvisory will remediate the check as soon as a violation is detected. If auto remediation is not enabled for a check, push-button remediation is available from the summary reports and alerts screen. If the check does not support remediation, then N/A appears in the Auto Remediation field.
Copyright © 2021 Cloudvisory Documentation, Fireeye Inc.
CAUTION
Take care when enabling auto-remediation. Make sure you understand what remediation means for the particular check.
Changing this setting will not affect any instances of this compliance check in other Compliance Groups.

If a compliance check does not support remediation, "N/A" is displayed.
Alerts
Alert notifications can be turned on and off for any individual Compliance Check. These are administrative alerts that appear in the Cloudvisory UI and trigger email notifications to subscribers of alerts for the related provider account. To configure email subscriptions for administrative alerts, go to Email Alert/Request Notifications
Changing this setting will not affect any instances of this compliance check in other Compliance Groups.
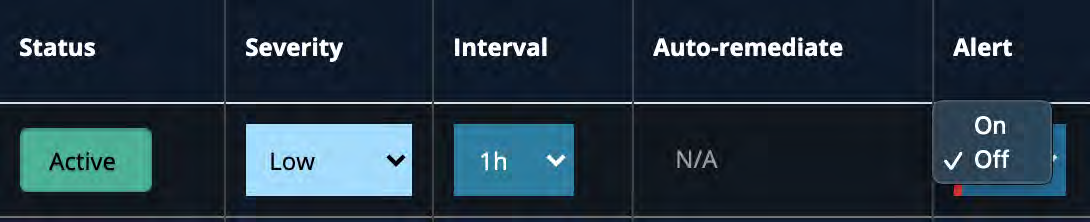
Managing Compliance Group Accounts
Accounts can be added and deleted in compliance groups at any time. Click the edit (pencil) icon next to Manage Accounts.
Available accounts are displayed in the left panel. Select a checkbox to add an account.
The account will be displayed under "Accounts to be Added".
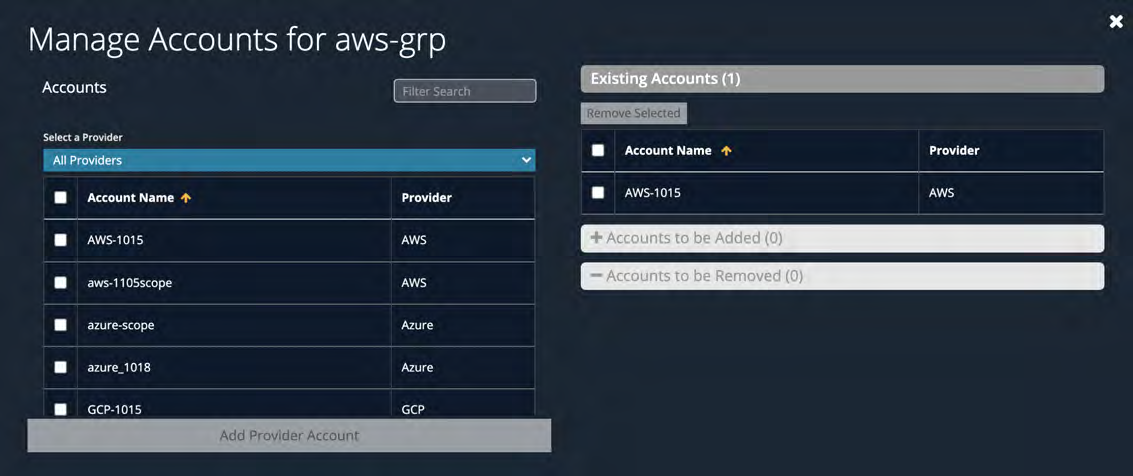
Accounts already in the group are displayed under Existing Accounts in the right panel. Select a checkbox to remove an account from the group.
The account will be displayed under "Accounts to be Removed".
Copyright © 2021 Cloudvisory Documentation, Fireeye Inc.
Email Alert/Request Notifications
You can specify the email addresses that will receive notifications of new alerts or requests. In order to receive alert notifications by email, you need to configure SMTP. For additional details on how to configure SMTP, please refer to Configure SMTP for Email Alert Notification Using Ansible below.
The Notifications landing page displays all the email addresses that will receive alert or request notifications. Click a row to display additional details about that subscription.
Configure SMTP for Email Alert Notification Using Ansible
Log in to the management/inception server.
Source the environment file for the CSP deployment / site you need to manage:
. ~/csp-ansible-installer/env/env.your-site-environment-file.dev
3. Add the office-smtp.yml, gmail-smtp.yml, or relay-smtp.yml file at /home/ubuntu/csp-ansible-installer/files/{site}/csp_customizations/
office-smtp.yml
cv_manager_mail_provider office365: true
cv_manager_mail_enable: true
cv_manager_mail_host: 'smtp.office365.com'
cv_manager_mail_port: '587'
cv_manager_mail_username: '<email address of the office365 service account>'
cv_manager_mail_password: '<password of the office365 service account>'
cv_manager_mail_smtp_auth: true
cv_manager_mail_smtp_ssl_enable: true
cv_manager_mail_from_address: '<email address of the office365 service account>'
cv_manager_mail_reply_to_address: '<email address of the reply to>'
cv_manager_mail_from_alias: 'CSP Contact'gmail-smtp.yml
cv_manager_mail_enable: true
cv_manager_mail_host: 'smtp.gmail.com'
cv_manager_mail_port: '465'
cv_manager_mail_username: '<email address of a gmail account>'
cv_manager_mail_password: '<password of the gmail account>'
cv_manager_mail_smtp_auth: true
cv_manager_mail_smtp_ssl_enable: true
cv_manager_mail_from_address: '<from address, an email address>'
cv_manager_mail_reply_to_address: '<reply to address, an email address>'
cv_manager_mail_from_alias: 'CSP Contact'relay-smtp.yml
cv_manager_mail_enable: true
cv_manager_mail_host: 'mail.smtp2go.com'
cv_manager_mail_port: '2525'
cv_manager_mail_smtp_auth: false
cv_manager_mail_smtp_starttls_enable: false
cv_manager_mail_smtp_ssl_enable: false
cv_manager_mail_from_address: 'cloudvisory.test@cloudvisory.com'
cv_manager_mail_reply_to_address: 'cloudvisory.test@cloudvisory.com'
cv_manager_mail_from_alias: 'CSP Contact'Run csp-ansible.config.
Run ansible commands to configure SMTP and restart the service.
Exporting a Report
To export a report:
Click the report button.
Select the type of report you want.
Enter the report name and select a format for the report.
Click Download.
Copyright © 2021 Cloudvisory Documentation, Fireeye Inc.
123
Historical Report
The historical view plots a chart with all the reports generated by the Compliance Group for a specified date range based on score, categories and severity.
Viewing Historical Reports
From Reports > Compliance Reports click on "History"

The default report displays a graph with all the previously saved reports based on their scores. You can view the reports by Score, Categories or Severity. All the past reports are listed in chronological order.
Changing the Date Range
To change the date range for the historical view, click on the date dropdown. The default date range is from 2 weeks ago to the current date. Use the dropdown on the left to specify the starting date and time, and the dropdown on the right to specify the end date.
Sorting, Filtering and Pagination
Sorting
By default, historical reports are sorted by the most recent first.
Filtering
You can filter the report results with the filters on the left panel: by score, check passes, check fails and check errors.
Pagination
By default, 25 results are displayed per page. To view more results at once, you can switch the setting to view more than 25.
Copyright © 2021 Cloudvisory Documentation, Fireeye Inc.
124
Compliance Report
Compliance Reports Overview
Compliance reports can be generated automatically or run on demand. Reports provide a snapshot into your compliance posture at a particular point in time. Cloudvisory retains reports for a year, and you can view and download these historical reports.
View Reports Landing Page
To view the reports, go to Reports > Compliance Groups
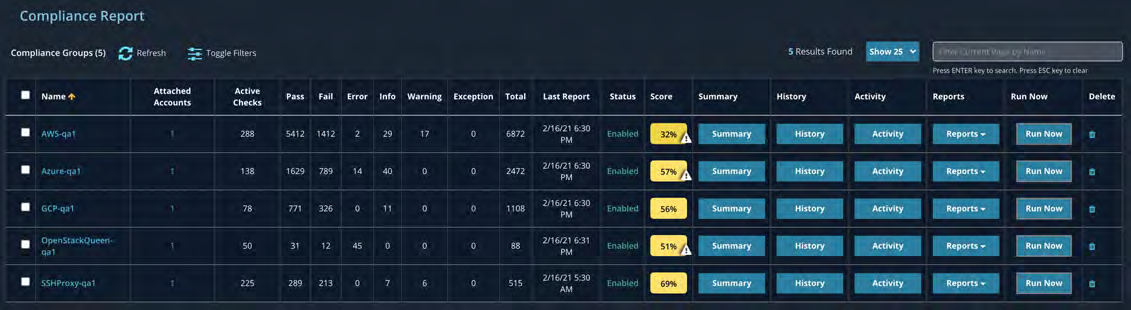
Terms and Definitions
Score
Compliance Report Scores are based on the passing and failing of the individual checks. 100% means all checks pass. 0% means no checks pass.
Pass/Fail/Error/Total
Pass/Fail represent the number of checks that have passed or failed in that group. Errors are the number of checks that failed to run. Total represents the number of checks in that group.
Status
The status indicates whether the report is running, disabled or deleted. If a group is running, then all of its automated processes are running. If a group is disabled, then all of its processes are paused. If a group is deleted, the group will no longer exist, but Cloudvisory will retain all of its old reports.
Last Report Date
The last report date is the date when the last report was generated.
CSP_ID
The CSP_ID is a unique ID assigned to the compliance checks within a report. This ID can be used for auditing, inspections, and investigation.
First Seen
First seen is the time when an alert is first seen in the system.
Number of Occurrences
The number of times that an alert has been triggered.
Summary
The summary report provides an overview of the current health of that report. It indicates the current score broken down by risks and displays all the running checks within that group.
Detail
The detailed report lists an exploded view of all of the passed and failed compliance checks and errors in that group. This report can be exported as a CSV, PDF or XLS file.
History
The historical view allows you to view all the previously generated reports. You can access both the summary views and the detailed reports. Cloudvisory stores the reports for up to one year, but after 90 days it will only keep one report per day.
Reports
The reports dropdown displays all the detail report options for that compliance group. All reports by default include a "Cloudvisory Detail Report".
Copyright © 2021 Cloudvisory Documentation, FireEye Inc.
125
Compliance Reports Retention Details
Data Type | Retention Period |
|---|---|
Alert Details | 60 days |
Check Result Details | 90 days |
Reports | 360 day |
Reports (interval less than 24 hours) | 90 days |
These retention intervals can be configured in the application.properties for the manager service.
Creating Reports On Demand
On-demand reports can be generated in two ways.
Click the Report dropdown on a specific Compliance group row and select a report type.
Select one or more rows and select Generate Report from the Bulk Action menu.
Generate a report for one or more groups by using the Bulk action dropdown menu
A dialog box asks if you would like to run all the checks prior to generating the report. If you click Yes, all the checks will run before the report is created. If you click No, then the last check results will be used.
Copyright © 2021 Cloudvisory Documentation, Fireeye Inc.
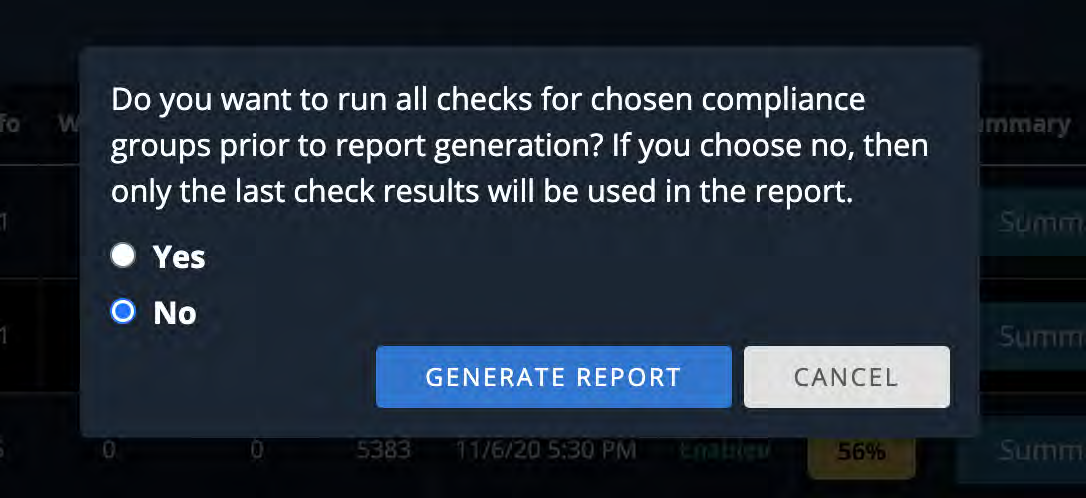
Deleting Reports
Reports can be deleted by using the Report dropdown on a specific row, or by selecting multiple rows and using the Aulk action menu.
Deleting a compliance group report deletes all historic data for the compliance group.
Copyright © 2021 Cloudvisory Documentation, Fireeye Inc.
127
Summary Report
Summary Report
The summary report displays several metrics that provide a quick overview of the compliance group's health. The checks are sorted by severity and their pass percentages in order to display the items that are most critical first.
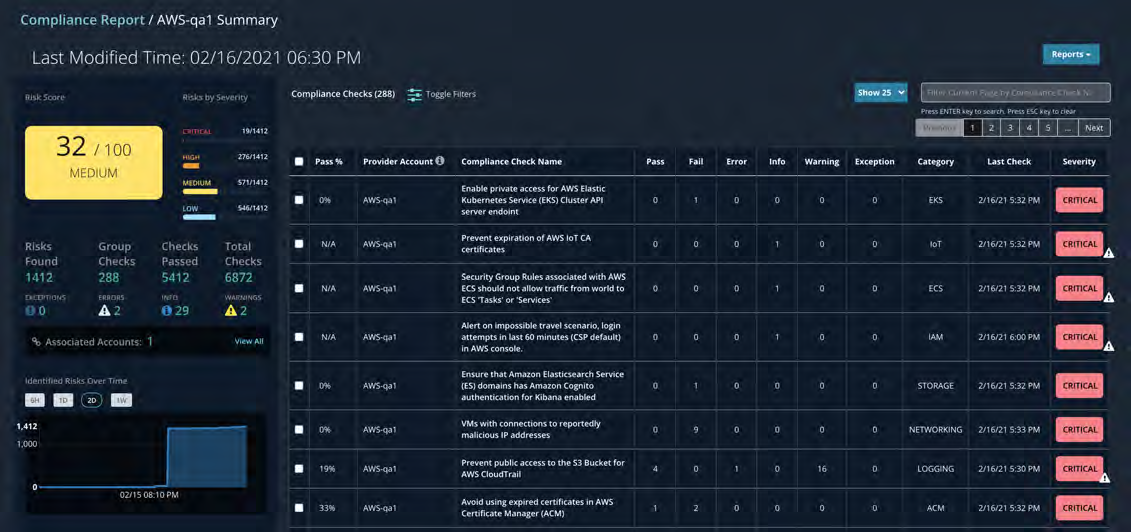
Components
Score Gauge
The score gauge displays the score of the compliance report.
Risks by Severity
This chart displays the number of checks in each severity category that did not pass.
Risks Found
The total number of check failures across the groups' compliance checks.
Errors Found
The total number of checks that failed to run.
Checks Passed
The total number of check passes across the groups' compliance checks.
Total Checks
The sum of all the check passes and failures across the groups' compliance checks.
Group Checks
The number of compliance checks in this group.
Accounts
The number of accounts associated with this compliance group.
Identified Risks over Time
The total risks within that group over a period of time.
Risks by Categories
The total risks by category, such as Networking and IAM.
Top 10 Risks
The top 10 offenders for Regions, Accounts and Collections.
Copyright © 2021 Cloudvisory Documentation, Fireeye Inc.
128
Filtering
Filter the summary report by clicking on the toggle filter icon.
You can filter the report by ID, severity, pass percentage and categories.
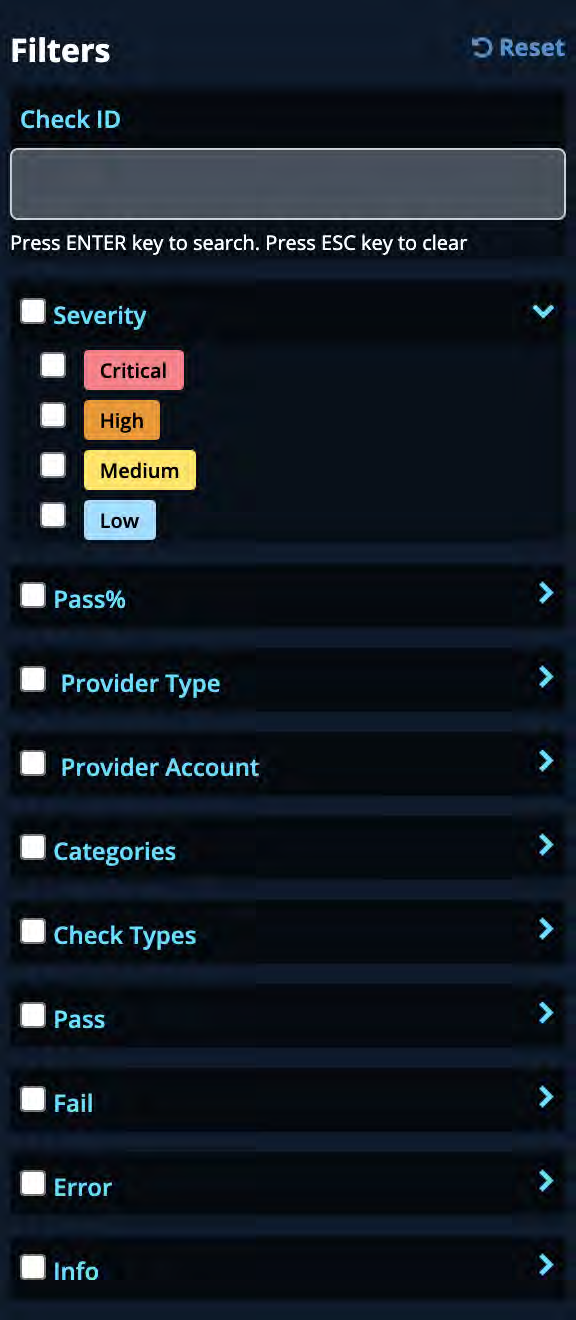
Summary Report Check Detail
Click on a compliance check to open a window with the details for the check. This window contains the failed checks for that group check, a list of the errors, and remediation steps.
Copyright © 2021 Cloudvisory Documentation, Fireeye Inc.
129
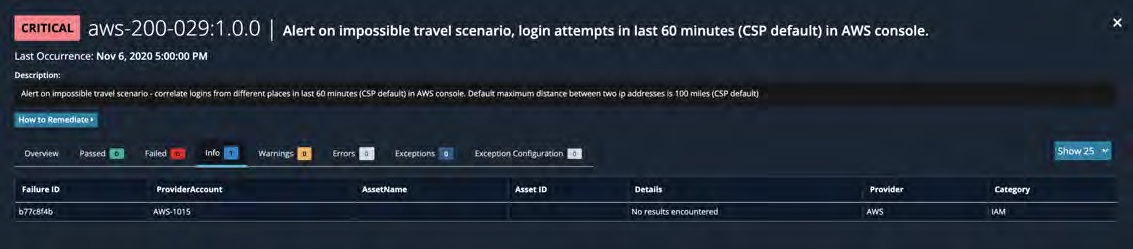
Tabs and Definition
Passed — The check was successful (expected result was obtained).
Failed — The check was unsuccessful (expected result was NOT obtained). If left unaddressed, this is considered a potential security risk.
Info — The check result cannot be determined by Cloudvisory and requires operator intervention. The check provides information on which you may choose to take action. For example, a check might return all users with the Admin role. It is up to the operator to review the appropriate usage of that role.
Warnings — The check could not determine a pass or fail due to improper permissions, rate limiting, missing data/file, or other reasons. You can view the details of the warning to determine how to rectify the situation.
Errors — The check could not be performed due to a malformed request, malformed response, or connectivity issue.
Manual Remediation
To view the manual steps to remediate this check, click on "How To Remediate".
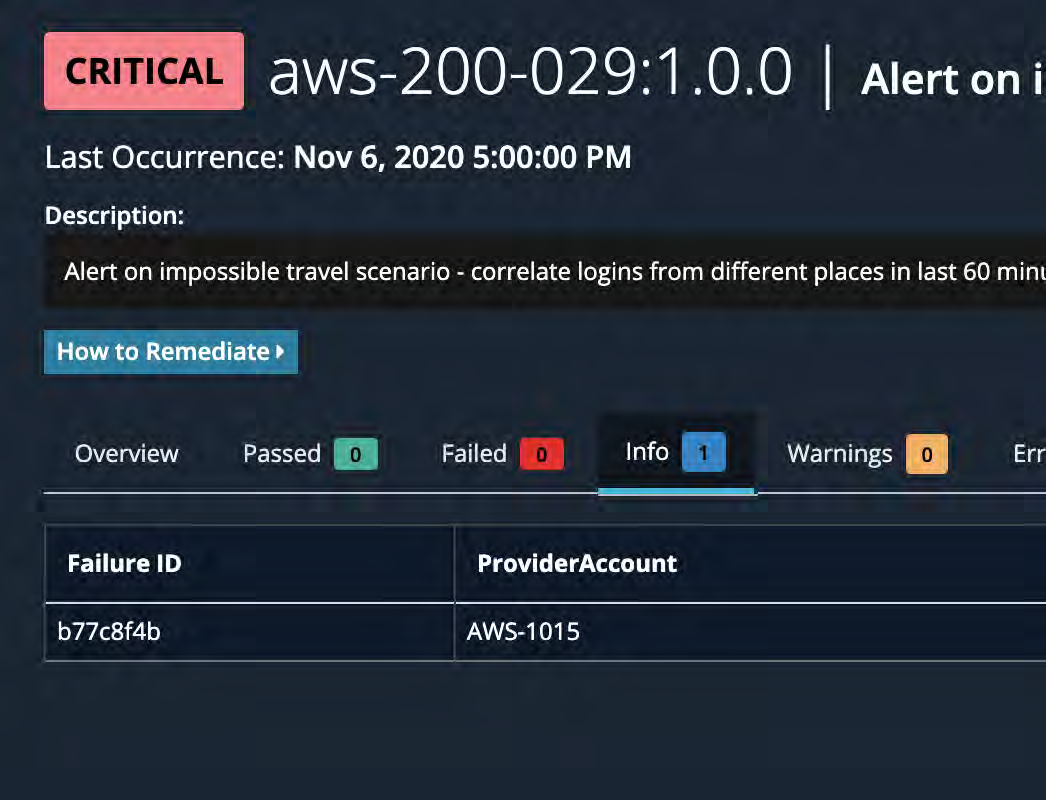
Automatic Remediation
To remediate checks that can be remediated by Cloudvisory, click on the Remediate button.
Notifications
You can specify the users who will receive notifications for failed checks.
Click on Notify.
The exclamation mark next to the Notify button means there are no assigned recipients for that check.
Copyright © 2021 Cloudvisory Documentation, Fireeye Inc.
2. Enter the recipient's email address. You can also change the subject and edit the body with custom parameters.
3. Click Submit.
When a check fails, the owner of that check can be notified directly from the detail popup.
Copyright © 2021 Cloudvisory Documentation, Fireeye Inc.
131
Network Groups
You group together network objects that handle the same types of traffic into a network group. Network groups allow you to classify different types of traffic. Any network object can belong to one or more network groups.
Cloudvisory is configured with a default network group called "Internet" with the network object internet, which represents the entire space of routable IP addresses. By default, all traffic is classified as traffic to or from the Internet. You should define additional network groups for all your network objects to classify your internal network traffic separately from Internet traffic.
Viewing Network Groups
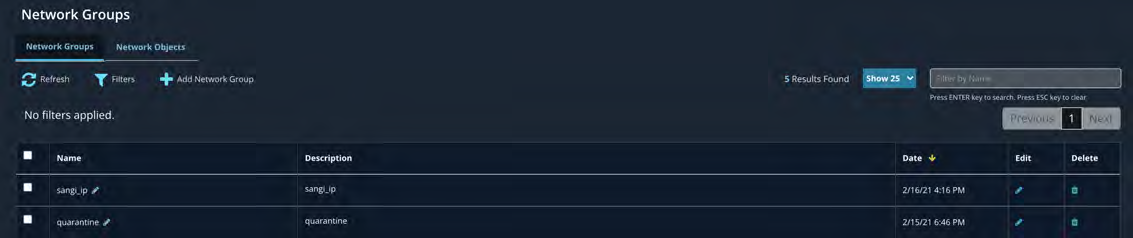
Creating a Network Group
Click Add Network Group on the Network Groups tab.
Enter a name and a description. The name must be unique.
Select one or more network objects for the group.
Click Save.
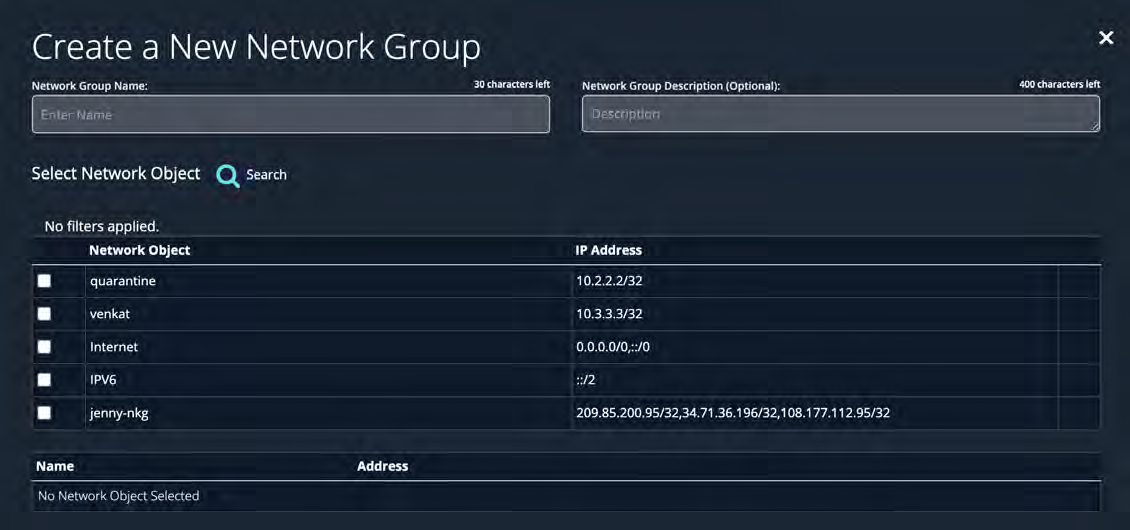
Editing a Network Group
To change the name of a group, click the edit icon next to the name.
To add or remove a network object from a network group:
Click the edit icon on the right.
To delete an existing network object, click the delete icon on the right.
To add a new network object, select the network object and click Add.
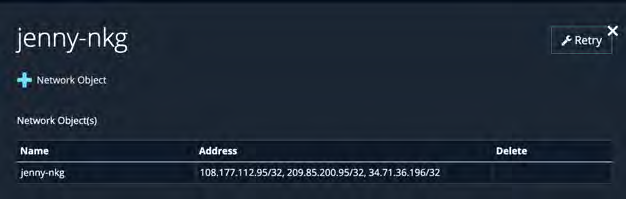
Copyright © 2021 Cloudvisory Documentation, Fireeye Inc.
132
Tag Policies
Cloudvisory provides very strong dynamic policy orchestration using tag/metadata/labels.
You can define a policy with a list of unique tag and value combinations, and then add a list of inbound/outbound network rules. Cloudvisory dynamically discovers the workload from the provider, matches tag-value combinations, and creates appropriate network security group rules for the matching workload.
Note the following about the dynamic nature of network policy:
A tag can be used in multiple policies, and multiple tags also can be added in one policy.
Each tag name and value combination set must be unique across policies.
For a policy to be applied to a workload, the workload must have all the tags included in the policy definition.
Tags name and values are both case sensitive.
When a tag is associated with a workload within Cloudvisory, the policies associated with the tag are applied to the workload.
You can require explicit admin approval before policies are applied to the workload.
Removing a tag from a workload will remove all policies depending on that tag from the workload.
Adding Policies
To create a policy, follow these steps:
Click on "Add Policy" in the Network Policies Landing Page.
Select one or more tags and enter a name and description for the policy.
Click Review and Submit. You can add inbound and outbound rules on the next screen.
Policy Details
Clicking on a policy takes you to the policy detail page. You can view the associated tags, edit the rules, view the associated workloads, change associated workload states, and delete the policy.
Copyright © 2021 Cloudvisory Documentation, Fireeye Inc.
133

Adding Rules to a Network Policy
Click a network policy on the Tag Policies page.
Click the Inbound Rules or Outbound Rules tab.
Click Add Rule to add rules.
Click Submit when you are finished.
Deleting Rules from a Network Policy
Rules can be deleted from the Policy Information page, Inbound Rules tab, or Outbound Rules tab.

Tags
This tab shows the list of tags and values included in this network policy.
Resources
This tab shows the list of workloads attached to this network policy.
To change the policy state, select one or more workloads and click Edit Selection.
Activity
This tab shows the list of activity of the network policy.
Deleting Network Policies
Policies can be deleted from the policy detail page.
Changing the Network Policy Name and Description
To update the network policy name and description, click Edit Policy.
Copyright © 2021 Cloudvisory Documentation, FireEye Inc.
134

Update Name and Description and click Save.
Copyright © 2021 Cloudvisory Documentation, Fireeye Inc.
135
Network Objects
Network objects represent routable network addresses inside and outside the enterprise network. Use network objects to classify and visualize discovered network traffic that is not associated with discovered Provider resources IP addresses. Network objects can be the target of Network Policy rules.
Each network object is configured with one or more address ranges specified in CIDR notation (for example, 10.1.1.0/24). If two network objects have CIDRs that overlap, flows are associated with the Network object that has the CIDR with the longest prefix (the largest mask size). Cloudvisory does not allow the same CIDR to be specified in multiple Network objects.
Cloudvisory is configured with a network object called 'internet' with CIDR 0.0.0.0/0, which represents the entire space of routable IP addresses. By default, all traffic is classified as traffic to or from the Internet. You should define additional network objects covering all the IP addresses in the internal enterprise network. This prevents internal network traffic from being classified as traffic to or from the Internet.
Viewing Network Objects
To view the network objects page, go to Governance > Network Groups. Click Network Objects.
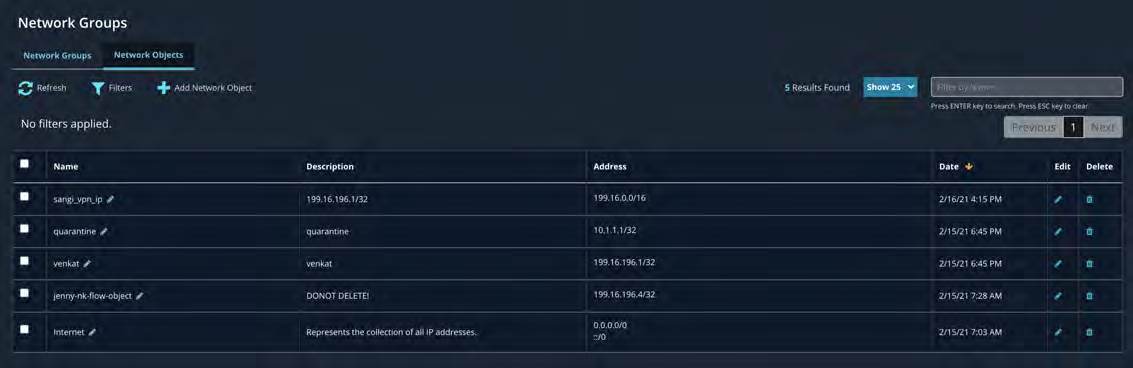
Creating a Network Object
Click Add Network Object on the Network Objects tab.
Enter a name and a description. The name must be unique.
Enter a range of IP addresses that will belong to the group.
Click Save.
Editing Network Object
Click the edit icon next to the name to change the name. Name must be unique. To add a new address to an existing network object, click on Edit Icon on the right.
Copyright © 2021 Cloudvisory Documentation, FireEye Inc.
jenny-nkg
Address
209.85.200.95/32
34.71.36.196/32
108.177.112.95/32
Copyright © 2021 Cloudvisory Documentation, Fireeye Inc. 137
Network Security
Use the Network Security tab to create and manage security groups and security group rules across multiple providers.
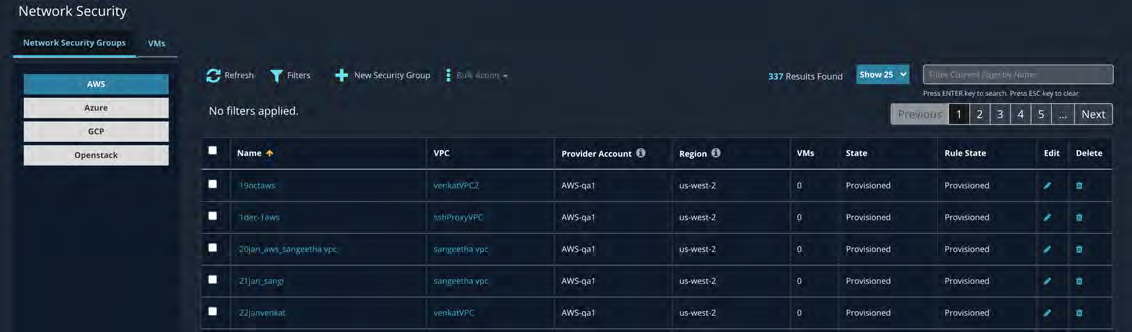
AWS - Create Security Group
Click the provider on the left and click New Security Group.
In the dialog box, enter information about the group. The information required depends on the provider. Click Save.
The new security group appears in the list.
When "Provisioned" is displayed in the State column, the group is ready. Go to Edit Security Group below to add rules and subnets.
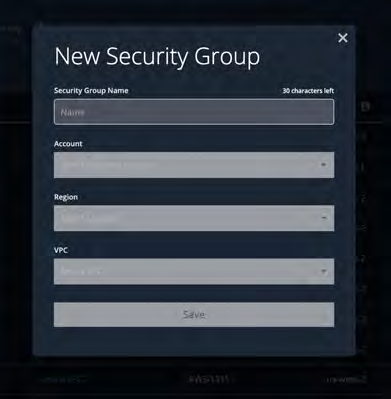
AWS - Edit Security Group
Click the row of the security group.
In the details pane on the right, click Edit Security Group.
Enter new rules on the Inbound or Outbound tab.
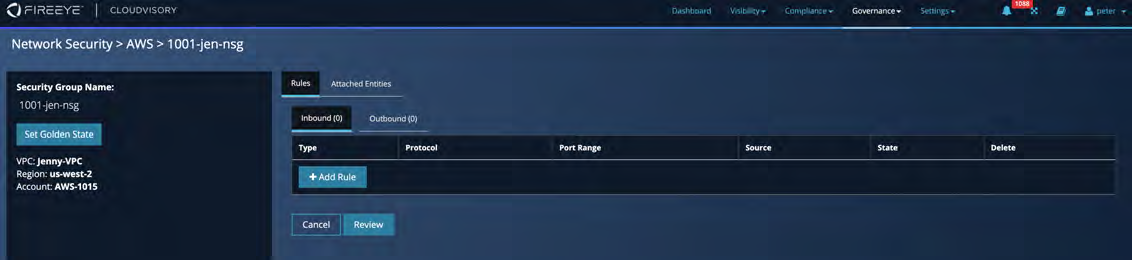
To attach a VM, click Attach Entities, then click VMs.
Click Attach VM and enter the VM information.
Click Review and confirm that the content is correct.
Click Submit.
Copyright © 2021 Cloudvisory Documentation, Fireeye Inc.
138
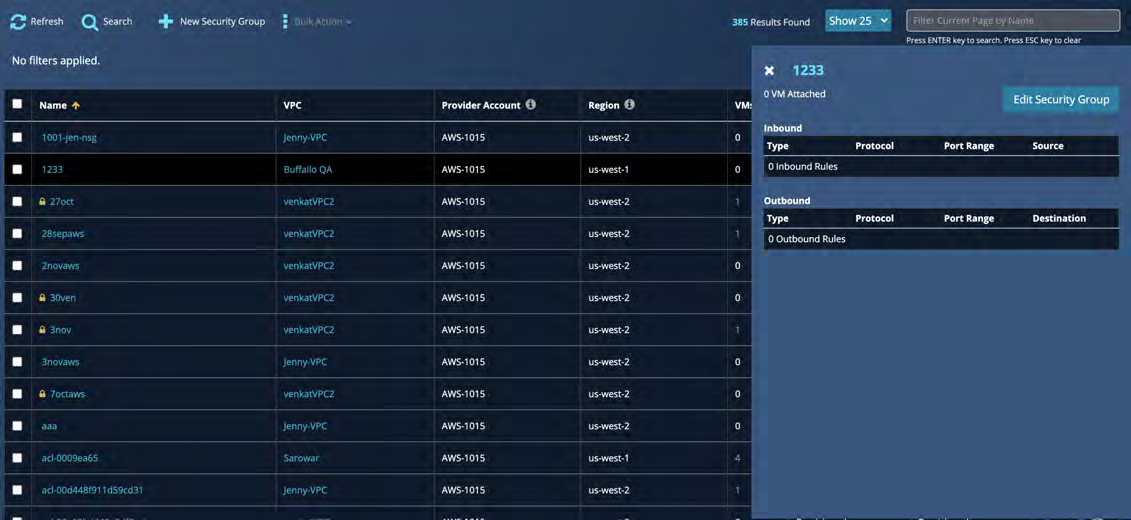
Click 'Attach Entities', then, 'VMs', and 'Attach VM' button.
Add Inbound and Outbound Rules
Review and Submit Security Group
Add Subnets (Azure Provider Only)
Click Azure on the left. The subnets are discovered and displayed.
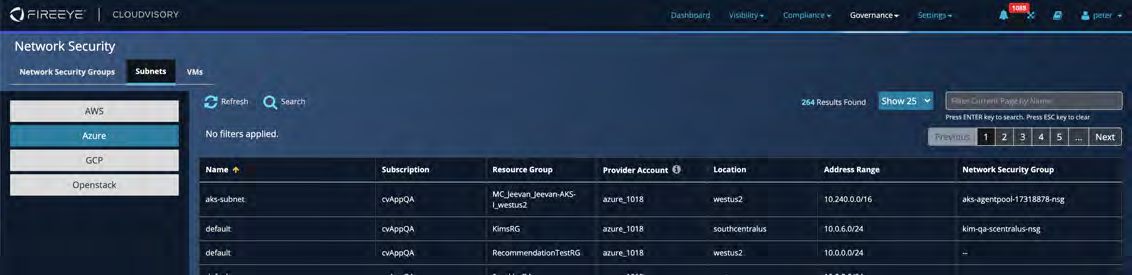
Azure - Attach Security Group
Click a subnet and subnet detail will show up on the right side.
Click 'Add Security Group' to select a network security group to attach
Copyright © 2021 Cloudvisory Documentation, Fireeye Inc.
Flow Collector
To view, Go to Settings > Flow Collector
The Flow Collector collects data for the flow analytics. The Flow Collector page displays the flows and their status.
To turn the flow collection on or off for an individual agent, click ON or OFF in the Flow Monitoring Status column.

To turn the flow collection on or off for multiple agents simultaneously, select their checkboxes. Select Bulk Action > Edit selection/Delete Selection.
Click the number in the Resources column to display the list of servers attached to the agent.
To delete a flow collector, first turn it off. Then click the icon in the Delete column.
i
NOTE
The flow collector may reappear and try to connect if it is running when you delete it. Before deleting, stop the flow collector.
Copyright © 2021 Cloudvisory Documentation, Fireeye Inc. 140
Import & Export
Exporting your Cloudvisory configuration is good practice. The exported file is a valuable backup of all your provider account settings, configuration, and network policies that can be restored in a DR event or site migration.
Importing a Cloudvisory Configuration
Import a previously exported Cloudvisory configuration file to create or override the Cloudvisory configuration or settings.
Click Choose File and select the zip-formatted exported file that you wish to import.
Click Import Data.
Enter the site name. If this exported file is from the same site, the name is populated already. Otherwise, get the site name from the management server.
Click Import Data. It may take a few minutes to import the file.
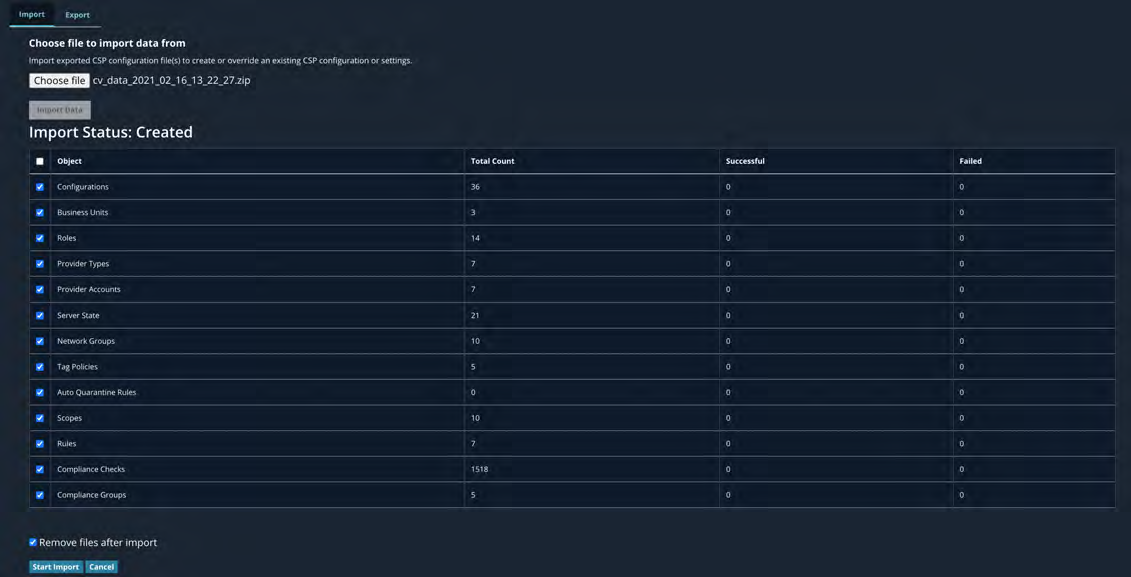
Exporting a Cloudvisory Configuration
You can export settings or configurations for any of the Cloudvisory features listed below. The export is a zipped file that contains a YAML file that can be edited and imported to any Cloudvisory environment.
Select the objects that you wish to export and click Export Data.
Review the total number of objects being exported for each of the selected items.
Click Download to export the zipped YAML file with all the configurations and parameters.
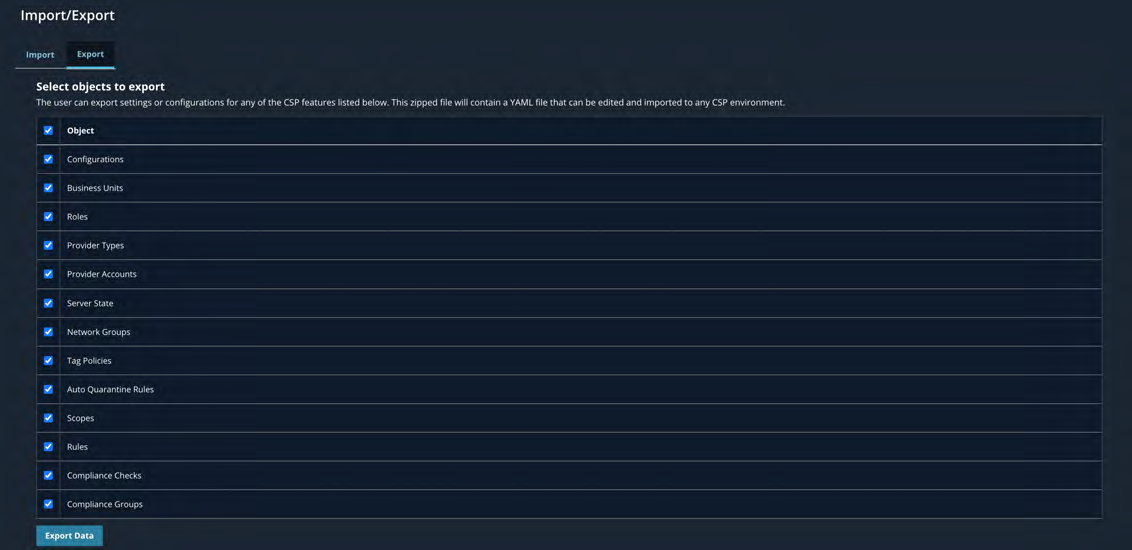
Copyright © 2021 Cloudvisory Documentation, FireEye Inc.
141
Providers
View Provider Accounts
All supported providers can be viewed at System Settings > Providers.
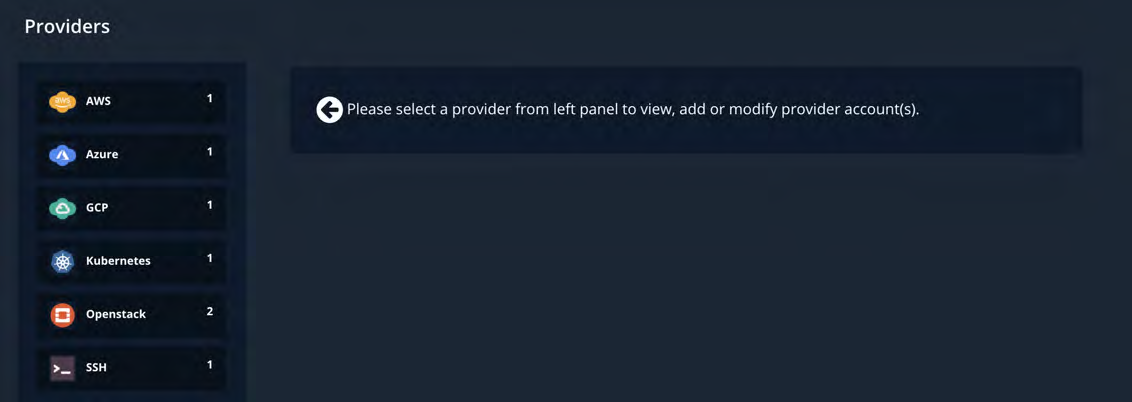
Add Provider Accounts
Some provider accounts require certain prerequisites to be met or settings to be configured. Refer to the onboarding document for the provider before adding an account.
AWS (Deployed outside AWS Cloud)
Edit Provider Account
Provider account can be edited at Settings > Providers.
Click on the edit icon on the right side of the selected provider account.
Make the changes to the available fields. When your changes are finished, click Save.
View Account Information
Click the provider account name to view the provider account information.
Edit Provider Icon Settings
Copyright © 2021 Cloudvisory Documentation, Fireeye Inc.
AWS Icon Configuration
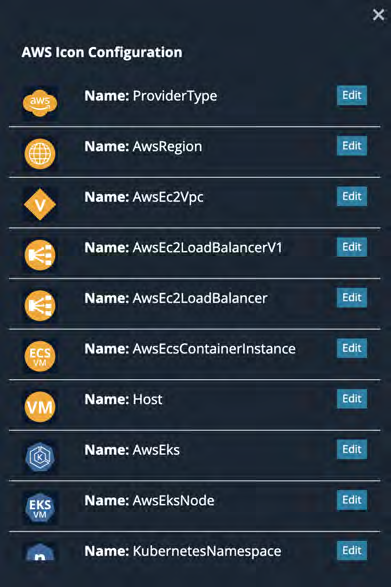
Name: ProviderType
Name: AwsRegion
Name: AwsEc2Vpc
Name: AwsEc2LoadBalancerV1
Name: AwsEc2LoadBalancer
Name: AwsEcsContainerInstance
Name: Host
Name: AwsEks
Name: AwsEksNode
Name: KubernetesNamespace
Copyright © 2021 Cloudvisory Documentation, Fireeye Inc.
143
Alerts & Notifications
Alerts
This section allows you to define the flow violation rollback settings. Flow violation rollback automatically reverts the security rule that caused the flow violation to its original state. Rollback is effective if a user creates rules in the Network Policies tab or Visualization tab and changes the workload state to enforced.
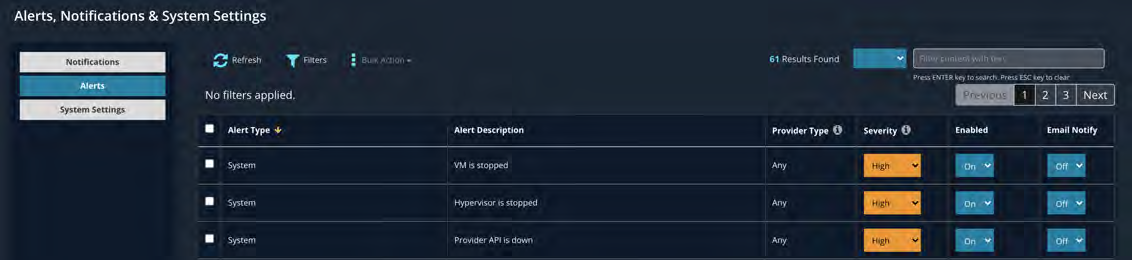
Notifications
The Notifications page displays the email addresses that receive System Notifications , Request Notifications, or Compliance Notifications.

For each type of notification, you can configure one more email addresses with one or more provider accounts. One or more email templates are provided for each type.
Add a New Email Address
Click Add New Email.
Enter the email address and select one or more provider accounts.
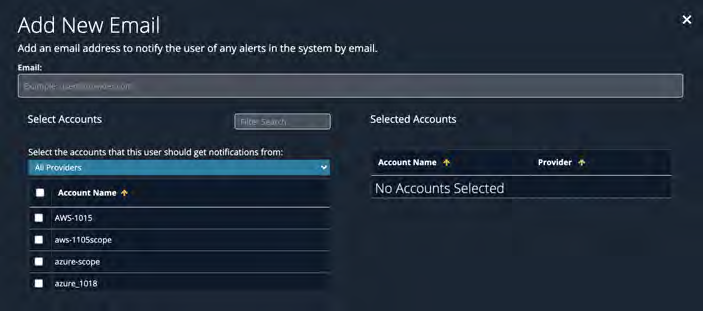
Delete an Email Address
Delete an address by selecting the row using the check box.
Add or Delete Account for Existing Email
You can delete or add more accounts for any email.
Copyright © 2021 Cloudvisory Documentation, Fireeye Inc.
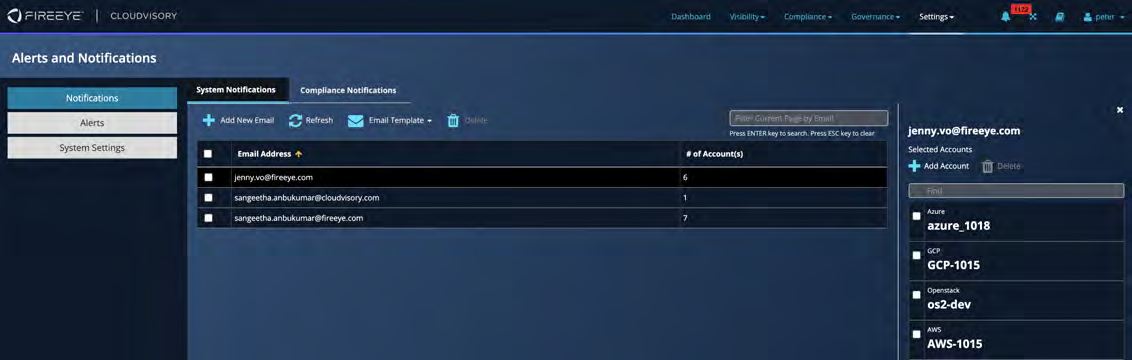
Email Template
One or more email templates are provided for each type. Each of these can be viewed and updated.
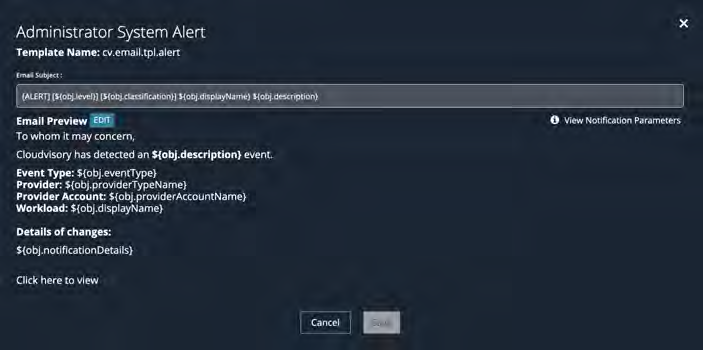
Copyright © 2021 Cloudvisory Documentation, Fireeye Inc.
145
Identity and Business Units
You can restrict access by creating unique user roles and attaching roles to business units. A role is a set of specific permissions. Each permission permits a specific task in Cloudvisory. A business unit groups one or more provider accounts together. Attaching a role to a business unit applies the role to all the accounts in the unit.
The Settings > Identity & Business Units page shows the roles, users, and business units.
Roles
The 'appadmin' role includes all Cloudvisory UI permissions.
The 'appadmin' role must NOT be updated or deleted. Any role can be copied and modified.
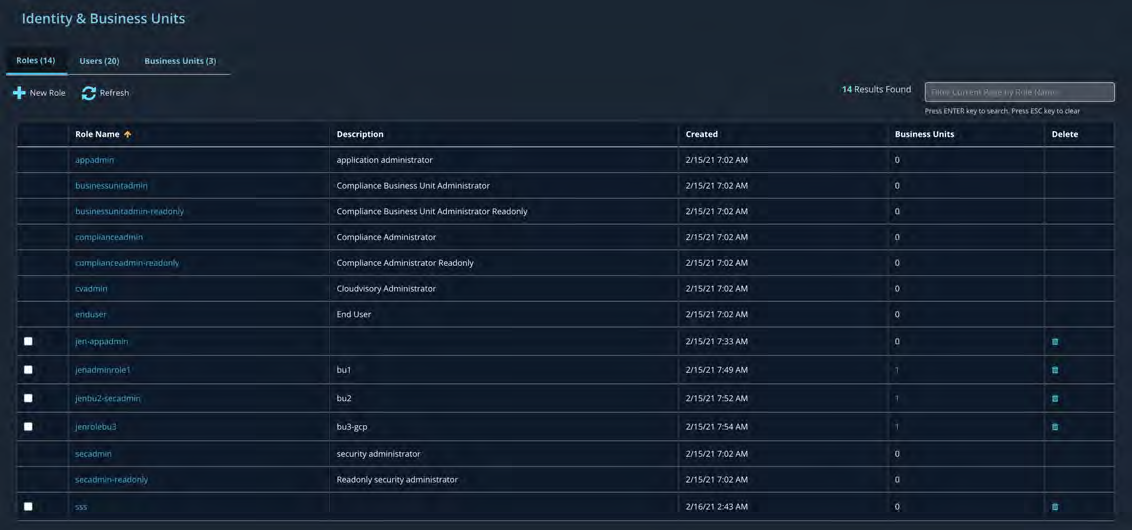
Create a Role
On the Roles tab, click New Role. Enter the Role Name and Description. Click Next.
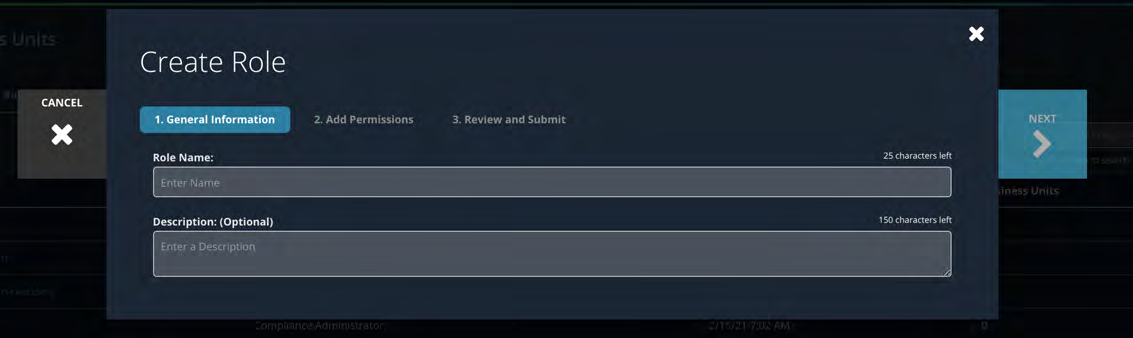
Select the user permissions using checkboxes or copy the permissions from an existing role. Copying permissions from an existing role is recommended.
Copyright © 2021 Cloudvisory Documentation, Fireeye Inc.
146
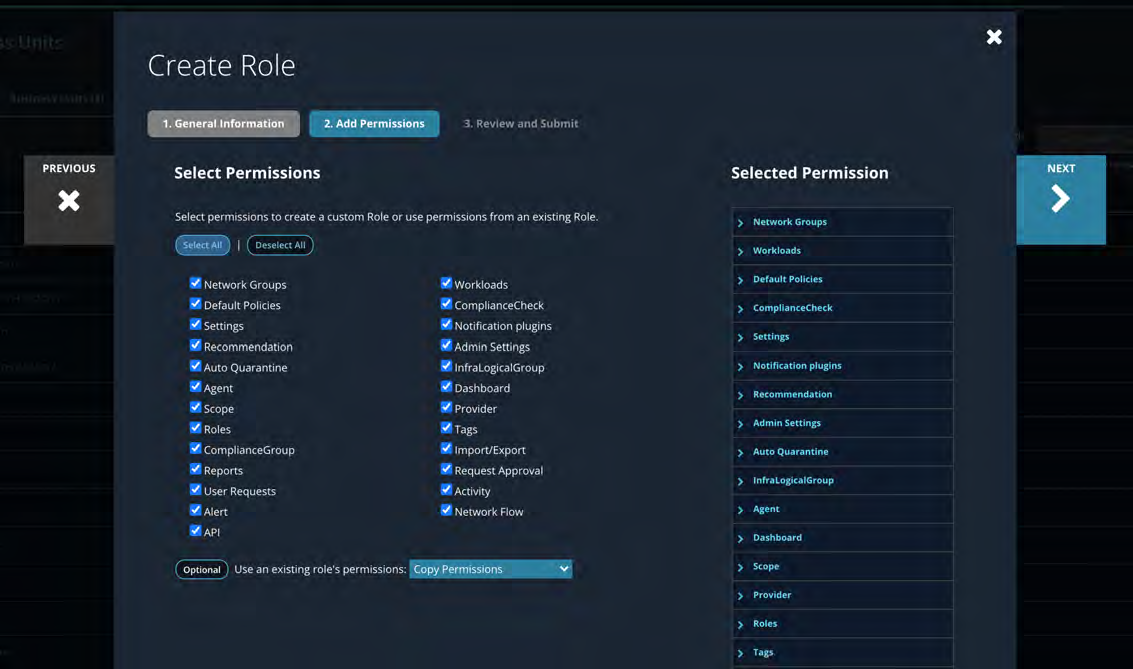
Click Review and Submit.
Next, add one or more business units with the role to restrict user access.
Add a Business Unit to a Role
Click the role and then click Business Units. Click Add Business Unit to select from existing business units. If there are no business units, see Create a Business Unit below.
A role assigned to no business units (0) means the user with the role has access to all provider accounts.


Select one or more business units and click Save.
Business Units
Click the number in the Account Access or Attached Role column to see details.
Create a Business Unit
Click Create Business Unit on the Business Unit tab.
Copyright © 2021 Cloudvisory Documentation, Fireeye Inc.
147
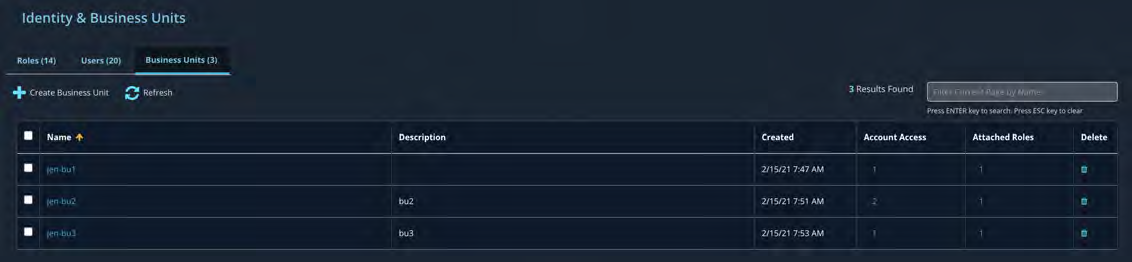
Enter a Business Unit Name and Description. Click Next.
Select one or more providers or provider accounts for the business under Objects Management. Click Next.
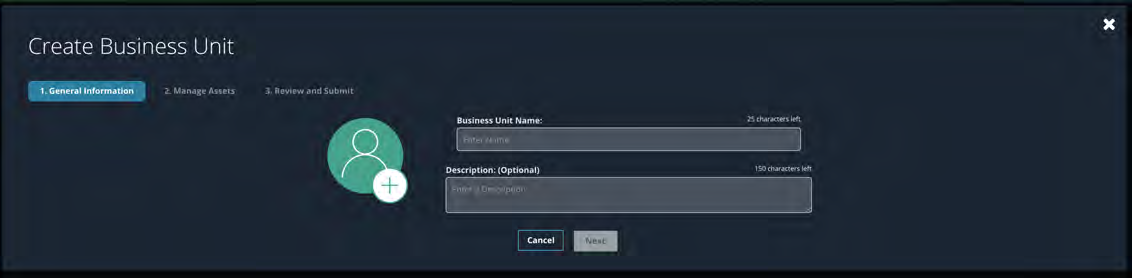
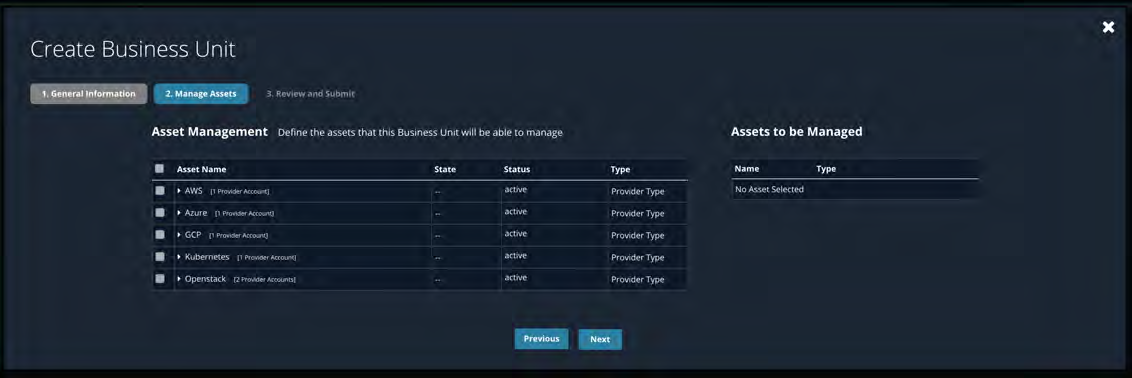
Click Review and Submit.
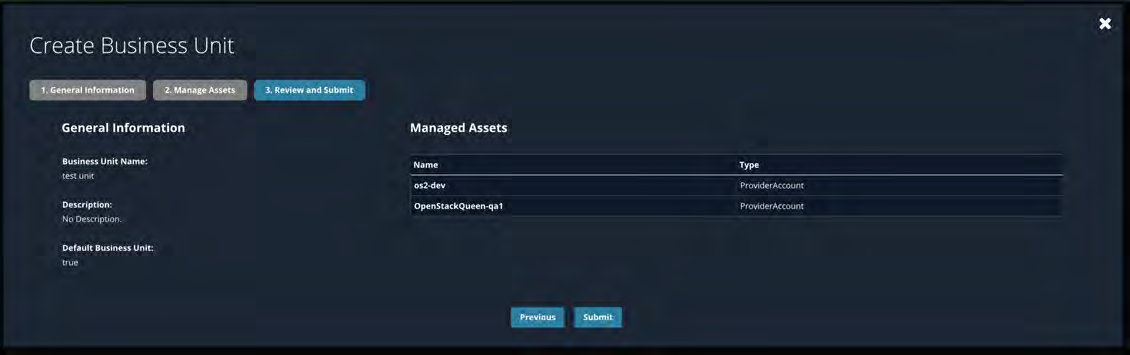
Edit Roles and Business Units
Click a role to add or change permissions.
Click a business unit to add or remove accounts.
Copyright © 2021 Cloudvisory Documentation, Fireeye Inc.
148

To add an account or provider, click Add Account.
Select one or more provider or accounts to add. Click Submit. To remove an account from a business unit, click the Delete icon in its row.
Users
Tighten security by creating unique user with roles with specified permissions and business units.
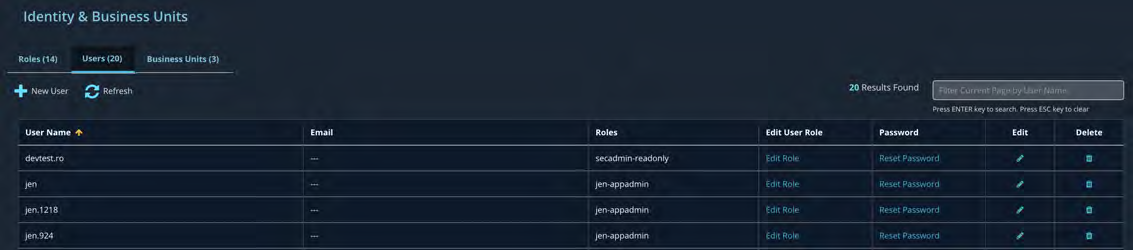
Add a User
Click Add User on the Users tab. Enter the User Name and Password, and confirm the password. Click Select Roles to assign one or more roles to the user. Click Submit when you are finished.
Copyright © 2021 Cloudvisory Documentation, Fireeye Inc.
149
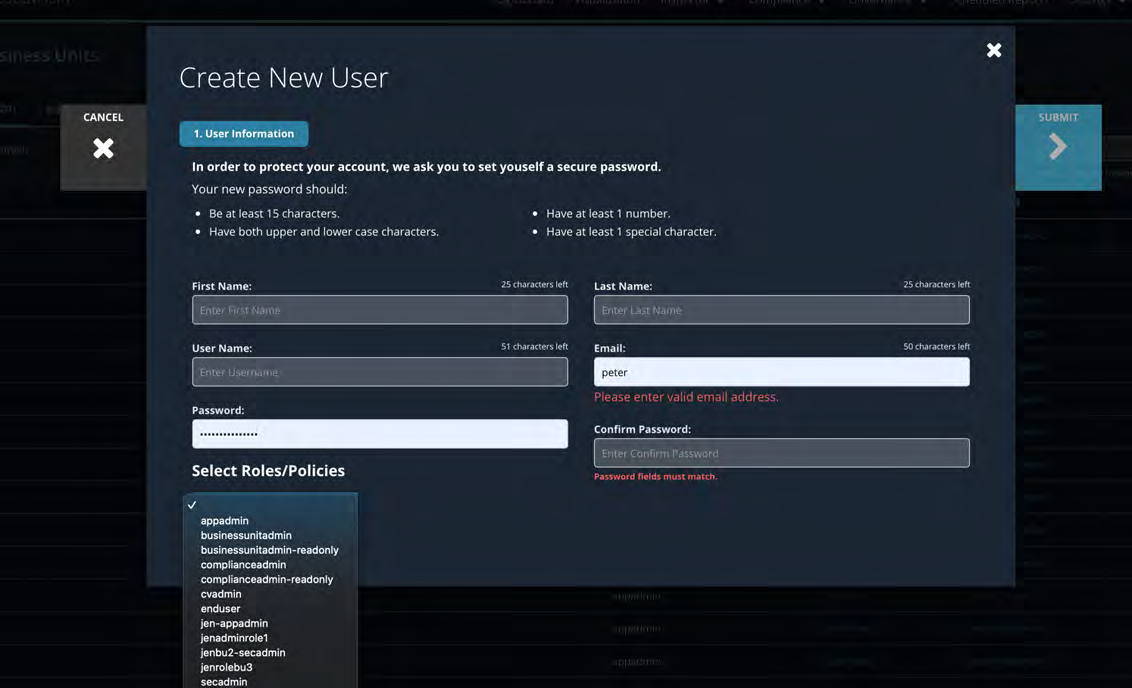
Reset User Password
Administrators can reset the password for an user. Click Reset Password in the user row on the Users tab. Enter the new password. Confirm the password, then click Submit.
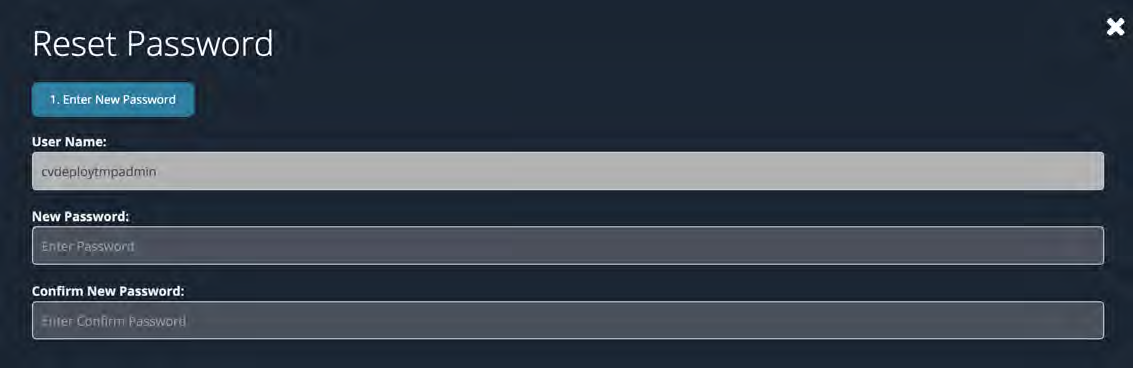
Edit a User Role
Administrators can change the roles assigned to a user. Click Edit Role in the user row on the Users tab. Select a role and click Submit.
Copyright © 2021 Cloudvisory Documentation, Fireeye Inc.
150
Edit User Details
User Name:
cvdeploytmpadmin
First Name:
Enter First Name
25 characters left
Last Name:
Enter Last Name
25 characters left
Email:
Example: user@domain.com
50 characters left
Copyright © 2021 Cloudvisory Documentation, Fireeye Inc.
151
System settings
Configuration Tab
Cloudvisory compliance checks can be configured to send notifications automatically. Notifications are delivered to the administrator of the compliance group, if the customer notify configuration is set at group level, or at individual check level. In this configuration, the asset owner can also receive the email for the violation or remediation.
License alert can be sent to the owner by configuring email using License Alerts Email Recipient. The asset owner email address is set using a tag and value. Configure the tag name using the Email Tag option.
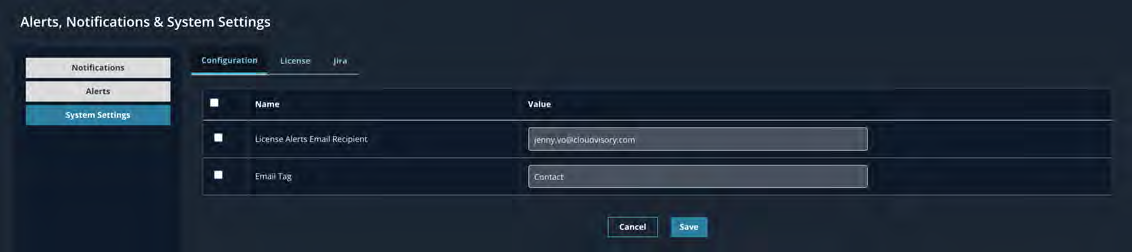
License Tab
This tab allows to configure license by uploading the license file.
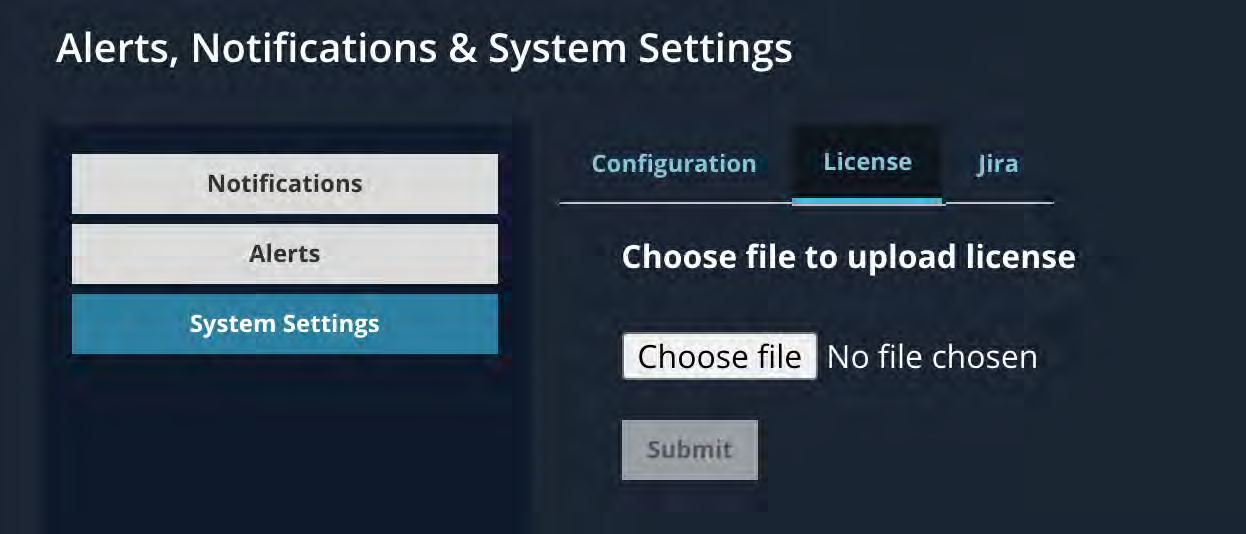
Jira Tab
This tab allows the user to configure jira to track severity tickets.
Copyright © 2021 Cloudvisory Documentation, Fireeye Inc.
152
Alerts, Notifications & System Settings
Notifications
Alerts
System Settings
Configuration License Jira
Name | Value | |
|---|---|---|
Jira URL | ||
Jira Username | ||
Jira Password | ||
Jira Project Key | ||
Jira Ticket Label | ||
Jira Ticket Priority Low | ||
Jira Ticket Priority Medium | ||
Jira Ticket Priority High | ||
Jira Ticket Priority Critical |
Copyright © 2021 Cloudvisory Documentation, Fireeye Inc.
153
Scheduled Reports
The Scheduled Reports Inspector lists all reports that have been scheduled. You can edit some report settings or delete a scheduled report. You can filter the list to narrow down a search.
Available Filters
Select a column heading to filter scheduled reports by frequency, name, status, or type.
Frequency, Report Name, Report Status, Report Type
Edit Settings
Select a report and click the pencil icon in the Edit column to change settings of a scheduled report.
NOTE
You cannot modify the report's name or filters using the Scheduled Reports Inspector.
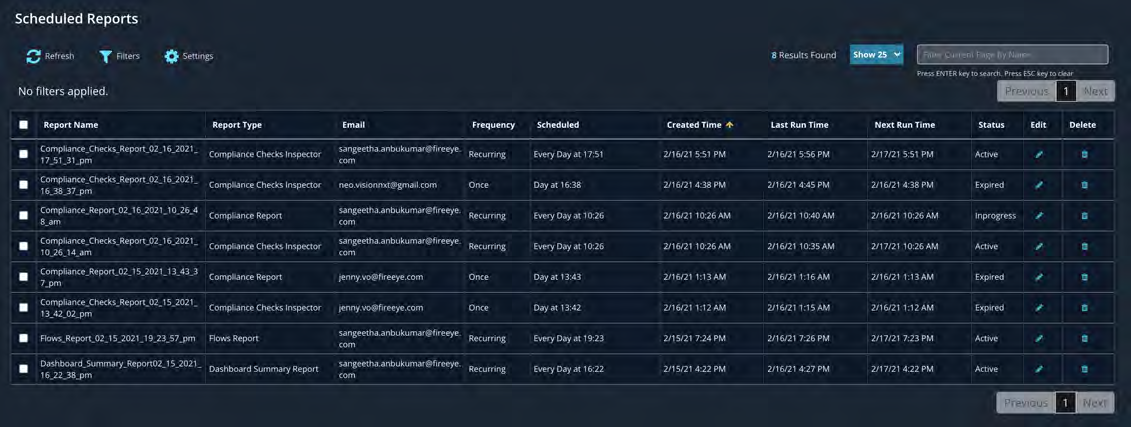
Delete a Scheduled Report
Select a report and click the trash can icon in the Delete column to remove the report from the schedule.
Copyright © 2021 Cloudvisory Documentation, Fireeye Inc.
154
Search Filters
Cloudvisory provides the following search filters to narrow down your seach results.
Available Filters
INFO
Auto-Suggest is enabled for all search filter values except Named Values and Boolean Type: filters.
Action
Definition: The alert's action state: acknowledged or unacknowledged.
Type: Named Values
Values: acknowledged, unacknowledged
Alert Type
Definition: The type of event or action that triggered the alert.
Type: Named Values
Values: Compliance, Enforcement, Flow, GCP Admin Add Group Member, GCP Admin Add User, GCP Admin Delete User, GCP Admin Remove Group Member, GCP App Engine Delete Service, GCP App Engine Update Service, GCP Compute Create Firewall Rule, GCP Compute Create Instance, GCP Compute Create Network, GCP Compute Create Subnet, GCP Compute Delete Firewall Rule, GCP Compute Delete Instance, GCP Compute Delete Network, GCP Compute Delete Subnet, GCP Compute Reset Instance, GCP Compute Start Instance, GCP Compute Stop Instance, GCP Compute Update Firewall Rule, GCP Iam Set Policy, GCP Kubernetes Create Cluster, GCP Kubernetes Delete Cluster, Membership, Move, Policy, Remediation, State, System, Threat
Asset Name
Definition: The name given by the user to an asset, service or resource in a cloud provider registered in Cloudvisory.
Type: Alphanumeric
Values: User Input
ID
Definition: The unique identifier generated when an alert is triggered. IDs are usually alphanumeric values.
Type: Alphanumeric
Values: User Input
Example: 2e3a3f71-7c32-4366-935e-dffbef65da25
Provider Account
Definition: Name of a specific provider account of a cloud service provider that is registered in Cloudvisory.
Type: Alphanumeric
Values: User Input
Example: dev-vm1
Provider Type
Definition: Type of cloud service provider registered in Cloudvisory.
Type: Named Values
Values: Depend on the cloud service provider registered in Cloudvisory.
Example: AWS
Region
Definition: The provider account's geographic region associated with a particular asset.
Type: Named Values
Values: Depend on the cloud service provider registered in Cloudvisory.
Example: us-east-1(for AWS cloud provider)
Severity
Definition: Severity of the associated risk (compliance failure): CRITICAL, HIGH, MEDIUM or LOW.
Copyright © 2021 Cloudvisory Documentation, Fireeye Inc.
Type: Named Values
Values: Critical High Medium Low
Asset ID
Definition: Unique identification of the asset name on the cloud provider.
Type: Text
Values: User Input
Asset Name
Definition: Name given to an asset on the cloud provider.
Type: Text
Values: User Input
Asset Type
Definition: The service, resources and purpose of each asset on the cloud provider.
Type: Named Values
Values: Agent, AWS API Gateway, AWS Cloud Trail, AWS EBS Snapshot, AWS EBS Volume, AWS NAT Gateway, AWS Subnet, AWS VPC, AWS Elastic File System, AWS IAM Group, AWS IAM Policy, AWS IAM Role, AWS IAM User, AWS Lambda, AWS Region, AWS Route53, AWS S3 Bucket, AWS SNS Topic, Azure AKS, Azure API Management, Azure App Service, Azure Disk, Azure DNS Zone, Azure Function App, Azure IAM Role, Azure IAM Role Assign, Azure IAM User, Azure Postgres DB, Azure Postgres Server, Azure Resource Group, Azure Storage Account, Azure Subnet, Azure Subscription, Datacenter, GCP Alert Policy, GCP K8S Engine, GCP IAM Role, GCP IAM Service Account, GCP KMS Key, GCP Managed Zone, GCP Network, GCP Project, GCP Project Logging, GCP Region, GCP SQL Instance, GCP Storage Bucket, GCP Subnet, K8S Deployment, K8S Namespace, K8S Node, K8S Pod, K8S Service, Network Policy, OS Hypervisor, OS Identity Domain, OS Identity Group, OS Project, OS Identity Role, OS Identity User, OS Subnet, SecurityGroup, VM
Category
Definition: Compliance check category, based on the cloud provider's resource and services.
Type: Named Values
Values: Access, AuthN and AuthZ, ACM, AKS, API Management, AppService, AWS IAM, Beanstalk, BILLING, BLOCK STORAGE, Cloud SQL Database Services, CloudFront, COMPUTE, DASHBOARD, Data Streaming, Database Services, DNS, EKS, GKE, IAM, Identity, Initial Setup, IoT, Logging, Logging and Auditing, Master Node (API Server), Master Node (Config Files), Master Node (Controller Manager), Master Node (etcd), Master Node (Pod Security Policies), Master Node (Scheduler), Master Node (security primitives), MONITORING, Network Configuration, Networking, NETWORKING (Security Group), PROJECT, Redshift, SECURITY, SECURITY GROUP, SQL DATABASE, SQL SERVER, STORAGE, System Maintenance, VM, Worker Node (Config Files), Worker Node (Kubelet)
Check Action
Definition: Filter compliance checks based on the action taken: Run or Remediate.
Type: Named Values
Values: Run or Remediate
Check ID
Definition: unique identification value of a compliance check.
Type: Alphanumeric
Values: User Input
Example: aws-100-070
Cloudvisory User
Definition: Cloudvisory username.
Type: Alphanumeric or Email address
Compliance Standard
Definition: Available compliance standards in Cloudvisory.
Type: Text
Events
Definition: Filter compliance checks based on the event that occurred: CheckError, CheckException, CheckFailed, CheckInfo, CheckPassed and CheckWarning.
Type: Named Values
Values: CheckError, CheckException, CheckFailed, CheckInfo, CheckPassed and CheckWarning
Remediable
Copyright © 2021 Cloudvisory Documentation, Fireeye Inc.
Definition: Whether in-line remediation is supported for a compliance check.
Type: Boolean
Values: True or False
VM
Definition: The name of a virtual machine (VM).
Type: Text
Values: User Input
Attribute
Definition: Contextual properties of an asset.
Type: Text
Values: User Input
Collection
Definition: Collection name. The names differ depending on cloud provider. for AWS the collection means VPC. For Azure the collection means Resource Group. For GCP & OpenStack the collection means Project.
Type: Text
Values: User Input
IP address
Definition: Filter by IP address.
Type: IP Address format
Values: User Input
Status
Definition: The status of an asset: Active, Inactive or Deleted.
Type: Named Values
Values: Active or Inactive
NOTE
In Infrastructure Inspector, enable the deleted assets value by selecting the top right deleted checkbox.
VM Tag
NOTE
In OpenStack, "tag" refers to metadata.
Definition: Tag name and tag value associated with a VM.
Type: Text
Values: User Input
Integrate SSO using OPENID/SAML
Configure CV using OPENID
CV requires following information from SSO provider for CV project.
openid_client_id
openid_client_secret
openid_accesstoken_uri
openid_userauthorization_uri
openid_jwks_uri
openid_username_attr: 'email'
openid_provider_scopes: 'openid,email,profile,groups,address'
openid_userinfo_uri
SSO provider will require the CV app URL as redirect URL
Configure CV using SAML
This documentation is created after Okta SAML integration. It should be similar for any other SSO provider if they support SAML.
CV requires following from SSO provider:
entityId
metadata file
certificate file
SSO provider will require the following from CV:
CV entityId: cloudvisory-fireeye
CV app URL: https://{{CV FQDN}}/saml/SSO
Additionally, for CV role and SAML group mapping, please provide the group name attribute. This will be configured in saml.attribute.group. The default value is groups; groups is assumed to be an attribute name on the IdP side. The value must be a CSP role name (e.g. appadmin)
Splunk Integration
Configure Splunk
CV requires following information from Splunk:
index name
HEC URI
HEC token
1.1 Create custom indexes
For example
csp_compliance_failures
csp_threat_flows
NOTE
Make sure default source type is _json.
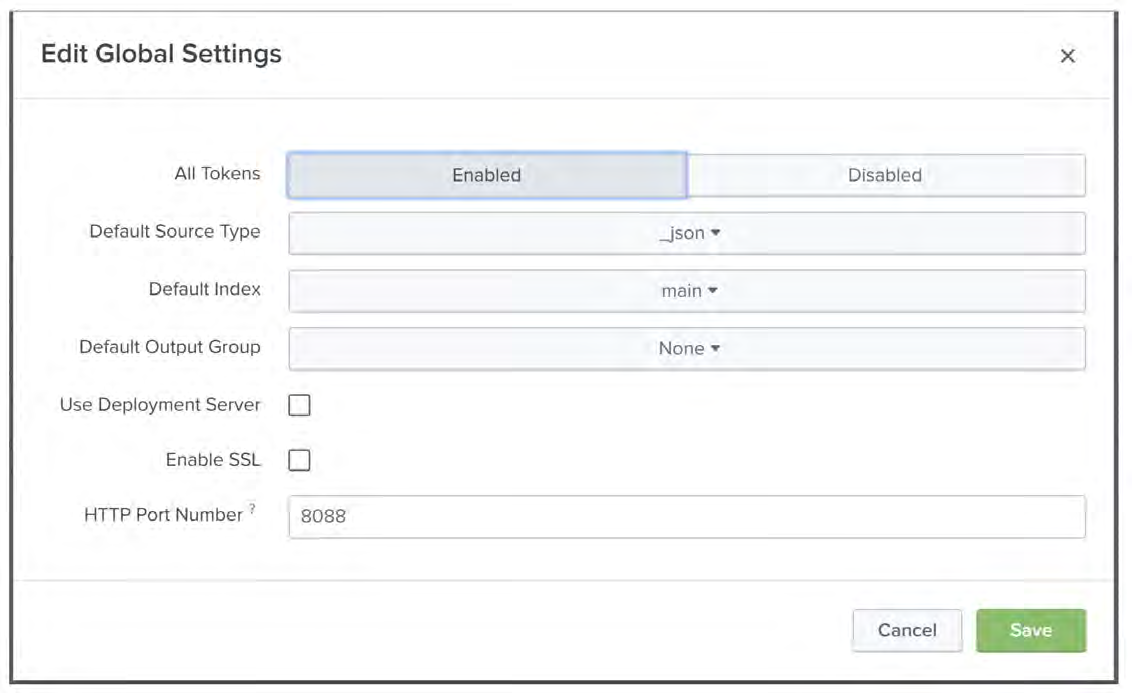
1.2 Create HEC tokens for the indexes

Copyright © 2021 Cloudvisory Documentation, Fireeye Inc.
159