The File Info chart displays a bar graph of all document transfers that occurred on the source IP or the destination IP for the current search query along with the event timestamp. Each host IP graphed displays the number of documents transferred. Hover over this number to view additional metadata, attachments, the JSON file, and download or reconstruct the PCAP associated with the host connection.
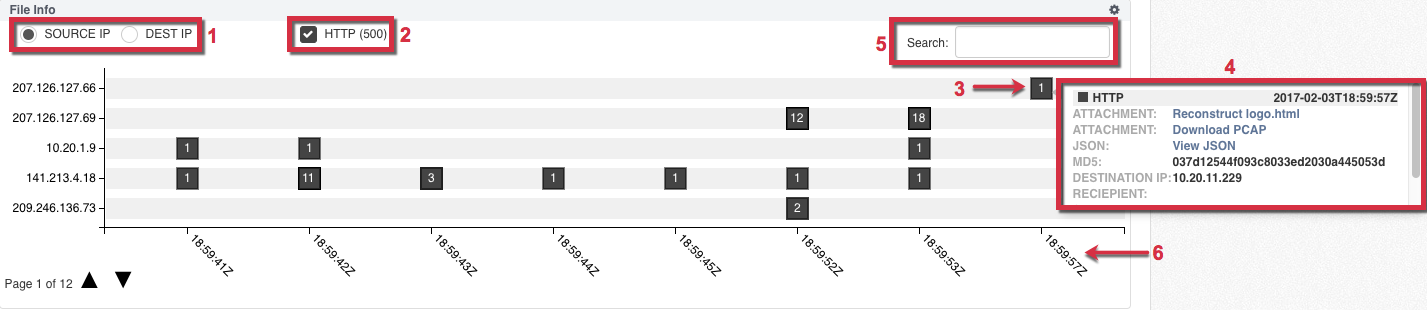
1) Source IP and Destination IP Selector | 4) Event Metadata |
2) Filters based on the protocol | 5) Search Field |
3) Count of the documents transferred | 6) Event Timestamp |
To add a File Info chart to your dashboard:
From the selected dashboard, click the Add Component button and select File Info.
Name the widget and click Add Component to save the File Info widget to your dashboard.
Click the search icon in the Query Bar to run your query and display the results.
(Optional) Use the Settings icon in the File Info chart panel to configure your chart size. You can display 1-5000 connection events in the chart.
Note
Graphical views that exceed 500 records may slow down your browser performance.
For more details on using the File Info chart to filter your search results see Filtering with the file info chart. See Performing forensic analysis with NDR for more information on reconstructing PCAP with the File Info chart.