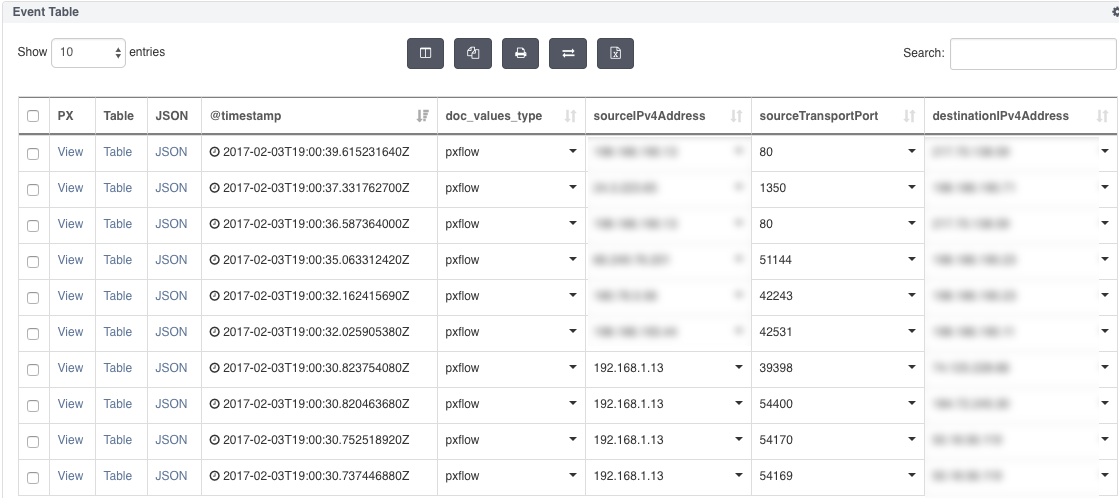
The Event Table summarizes and displays all session results relevant to the current search query in a table view. The default view summarizes the following information:
Event's data in a structured format (JSON), a tabular format displaying a summary of all session results and and NDR view
The precise timestamp for each event that indicates when the event occurred.
The event type, the nature of the event.
The IPv4 addresses of source and destination.
The source and destination transport port.
The button panel at the top of the Event Table allows you to add and remove table columns from view, copy and print search results, reconstruct packet captures, and export table contents in CSV format. You can also use the search field to filter the session results and the Show Entries drop-down list to configure the size of the table by adjusting the number of events displayed.
Show Entries Count | Reconstruct PCAP |
Edit Columns | Export table content in CSV format |
Copy Event Table data to the clipboard | Search Bar |
Print Event Table |
Viewing search results
The Event Table provides column sorting and format options for viewing and analyzing your search results. For example, you can view all the metadata for a particular document by clicking on the Table link associated with the document row. You can also view the search results in JSON format. Modify the default view by using the Edit Column button in the Event Table panel to quickly add or remove field columns.
View the data results at a connection, packet, and payload level by using the Reconstruct button to reconstruct the PCAP for selected events. You can also view reconstructed websites and emails for selected events captured in your session using the Reconstruct button. See Performing forensic analysis tools with NDR Console for more details on packet view, website reconstruction, and email reconstruction.
Filtering search results
Use the field filter drop-down menu to filter your search results by applying the field term or value to a new search or the current search or exclude the term or value from the current search. See the Filtering with the Event table section for instructions on using this feature. The field filter drop-down menu also allows you to find IPv4 and IPv6 addresses and Whois information for selected events using Reverse DNS Lookup and Whois Lookup. For more information, see Reverse DNS lookup and Whois lookup.
To add an Event table to your dashboard:
From the selected dashboard, click the Add Component button and select Event Table.
Configure your table size. You can display 1-5000 connection events in the chart.
Click Add Component to save the widget to your dashboard.
Click the search icon in the Query Bar to run your query and display the results.
Note
Graphical views that exceed 500 records may slow down your browser performance.