2021 / Software Release 9.0.2 / Revision 2
Preface
This guide is intended for security and forensics analysts. It describes how to use FireEye's real-time Multi-Vector Virtual Execution (MVX) engine to scan remote network file shares to seek out resting malware that invaded the corporate network through means such as FTP access, dropboxes, and collaboration tools.
The File Protect System Administration Guide describes how to configure and manage the appliance. It is intended for system administrators responsible for deploying, operating, and maintaining the appliance.
These guides are also intended for security and information technology (IT) managers and personnel interested in learning more about FireEye technologies.
Before You Begin
Before you use the File Protect software:
Read the FireEye File Protect Release Notes for the current release.
Familiarize yourself with the File Protect appliance.
NOTE: Some screenshots and examples of CLI command output in this guide may differ slightly from the current Web UI and CLI.
Configuring the Appliance Using the Web UI
The File Protect Web UI uses HTTPS to provide a secure connection for configuring the appliance. The Web UI functions you have access to depend on the privileges granted by your role.
Browser Support
The File Protect appliance Web UI supports recent versions of the following browsers:
Internet Explorer and Microsoft Edge on supported versions of Windows
Firefox
Google Chrome
Screen Resolution Requirements
The Web UI supports the following screen resolutions:
1152 x 864 pixels | 1440 x 900 pixels |
1280 x 800 pixels | 1600 x 900 pixels |
1280 x 1024 pixels | 1680 x 1050 pixels |
1360 x 768 pixels | 1920 x 1080 pixels |
1366 x 768 pixels | 1920 x 1200 pixels |
Logging in to the Web UI

The username for the default administrator is admin. The default password (admin) must be changed to a password of 8 to 32 characters before this user can log in to the Web UI and create other users. If this has not been done, see the System Administration Guide for instructions.
To log in to the Web UI:
Go to
https://appliancein the browser, whereapplianceis the IP address or hostname of the appliance. For example, if the configured IP address of the appliance is 10.1.0.1, enterhttps://10.1.0.1.On the login page, enter the username and password your administrator provided.
About the Web UI Background Theme

This feature is available only on CM managed appliances.
When you log in to the Web UI dashboard, the default background display theme is dark. The dark theme makes it easier to read in low light.
During your session, you can change the background theme from dark to light by clicking the toggle theme button to switch from a DARK or LIGHT background.

When you toggle the theme button to a light background, your setting will persist for your Web UI session until you log out.
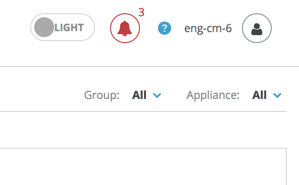
When you log back in to the Web UI, your display will default to a dark background.
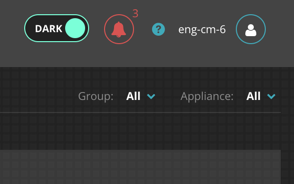
To set your Web UI theme preference to a light background every time you log in and out of the Web UI, configure theme preference using the CLI.
Go to CLI configuration mode.
hostname > enable hostname # configure terminalConfigure the Web UI background theme.
hostname (config) # web preferences global theme {dark | light}
Web UI Tabs
The File Protect Web UI contains the following tabs.
Tab | Description |
|---|---|
Dashboard | Overview of malware analysis and file scan information. See “The Appliance Dashboard” in the File Protect System Administration Guide. |
Storage | Use this tab to add, edit, refresh, or modify files storage, quarantine storage, or good/whitelist/unknown storage. You can also view already configured storage. For a files storage, click on Show n scans to open the Scans page for that storage or click on No Scans Configured to start the scan configuration wizard to set up a scan. |
Scans | Use this tab to set up scans and to view completed scans and an overview of results for each share. |
Tab | Description |
|---|---|
Settings | Tabs used to configure appliance and threat management settings:
|
Reports | Filters used to generate and download or schedule consolidated alert details reports, and links to download the schema for operating system changes and alerts. |
About | Network administration information and controls:
|
PDF Generation
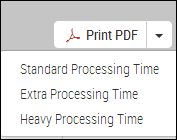
The amount of time needed to generate the PDF depends on the current load on the system. By default, the system will try to generate the PDF using Standard Processing Time, the fastest way possible. If the PDF generation times out, you can try again using other options by clicking the arrow on the button and then selecting Extra Processing Time or Heavy Processing Time, where heavy processing time takes the longest.
Configuring the Appliance Using the CLI
The CLI provides a complete set of commands for configuring the FireEye appliance. The CLI commands you can enter depend on the CLI command mode and the privileges granted by your role.
To log in to the appliance CLI:
To connect using SSH, open a terminal program or an SSH client in the remote system.
From a terminal program:
Enter the
ssh username@ipAddresscommand, where ipAddress is the appliance IP address.When prompted, enter your password.
From an SSH client:
Enter the appliance IP address and make sure port 22 is specified.
When prompted, enter your username and password.
To connect over a terminal server, open a Telnet program in the remote system.
Enter the address and port of the terminal server.
Enter your username.
When prompted, enter your password.
The hostname > prompt is displayed after you are logged in.
Threat Management Overview
The File Protect platform scans network file shares to detect and quarantine malware. File scans can be performed at any time (on-demand), or scheduled to run continuously, daily, or weekly. Preliminary scans allow you to gather initial statistics about a share, which you can use to adjust scan criteria before you schedule or start the scan.
Scan results provide details about the status and outcome of scans. Analysis results provide detailed MVX engine observations about malware behavior and operating system changes that were detected during deep analysis of the file object. With full integration with the CM Series platform, the threat indicators are shared with other FireEye products for immediate action. Additionally, CnC callback events detected by the MVX engine can be sent to the File Protect platform for additional forensic analysis.
Filters allow you to tailor scans so they provide the right amount of coverage without overloading the system. You can filter scans by file type, location, modification date, and so on. For example, a scan could analyze only .doc and .exe files in the Training directory that were changed or added within the last two weeks. You can also define specific file types to whitelist when they are encountered.
Shares with the Files share type will be scanned; shares with the Quarantine and Good/Whitelist/Unknown share types will not be scanned. If configured, the appliance will move malicious files to a Quarantine share when they are encountered. This isolates malware from network assets, reducing its potential to cause harm to the file system in use. If a Good/Whitelist/Unknown share is configured, non-malicious, whitelisted, and unknown files can be moved to that share to reduce the amount of time and resources used by the next scan.
If your forensic analysis determines that a quarantined file is safe, you can release it from quarantine, which returns the original file to its original location on the share and puts it on an internal whitelist. You can also delete a malicious file permanently. If you believe the event that caused the file to be marked malicious is a false positive, you can suppress it so it will not be marked malicious the next time files with matching MD5 checksums are analyzed.
File Protect alerts are retained in the appliance database until event and malware record thresholds are reached. These thresholds specify the number of event and malware records that can be stored in the appliance database. They are set using the fedb events archival himark and fedb malware archival himark CLI commands. For most appliances, the defaults are 500,000 event records and two million malware records. For 10G appliances, the defaults are two million event records and eight million malware records. See the CLI Reference Guide for more information about these commands.
System Configuration
This section describes how to manage system configuration for threat management. The following topics are addressed:
Managing Guest Images
YARA Rules
Static Analysis Tools
AV-Suite
Configuring the Maximum File Size for Analysis Using the CLI
Configuring Analysis Settings
Configuring EML Parsing Settings
For details about enabling Dynamic Threat Intelligence (DTI) network access and the configuration tasks, refer to the File Protect System Administration Guide.
Managing Guest Images
Guest images are virtual machine snapshots used to evaluate suspicious traffic for a variety of environments, applications, and files. They let you test traffic and software, analyze results, and detonate malware in a controlled environment where they cannot damage your assets. The number of virtual environments you can run depends on the appliance model you have.
Guest images are factory installed and tested on the File Protect appliance. You can update guest images when updates become available, or you can set up automatic updates so you are always using the most recent guest images.
FireEye provides an updated set of guest images with each new release and strongly recommends you use the full set of guest images provided in each release without modifying the set.

Refer to the CLI Command Reference for information about how to enable or disable guest images.
Managing Guest Images Using the Web UI
This topic describes how to manage guest images using the Web UI on your File Protect appliance.
Prerequisites
An established connection to the Internet
A connection to the DTI Cloud or a CM server
Admin or Operator access to the File Protect appliance
A CONTENT_UPDATES license
A FIREEYE_SUPPORT license
Viewing Guest Images Using the Web UI
The Guest Images page in the File Protect Web UI lists the guest images that are available to the File Protect appliance. This information is only for viewing.
For information about how to view update status, check for the latest updates, download, and install guest images, see Managing Guest Images Using the Web UI above.
To view the current guest images:
Log in to the Web UI using a valid Admin or Operator user name and password.
In the Web UI, choose Settings > Guest Images.
Go to the Analysis Images table to view the current guest images.
NOTE: The Guest Images list is dynamic: new guest images and version updates for the current guest images are automatically made available to your appliance from the DTI cloud through security content updates.
Managing Guest Images Using the Web UI
Use the Appliance Update page in the File Protect Web UI to check for updates and to download or install new guest image profiles that are available for the File Protect appliance.
The information in this section explains how to:
View the current update status for guest images
Check for guest images updates
Download guest images updates
Install guest images updates
To view the current update status for guest images:
Log in to the Web UI using a valid Admin or Operator user name and password.
Choose About > Update to open the Appliance Update page.
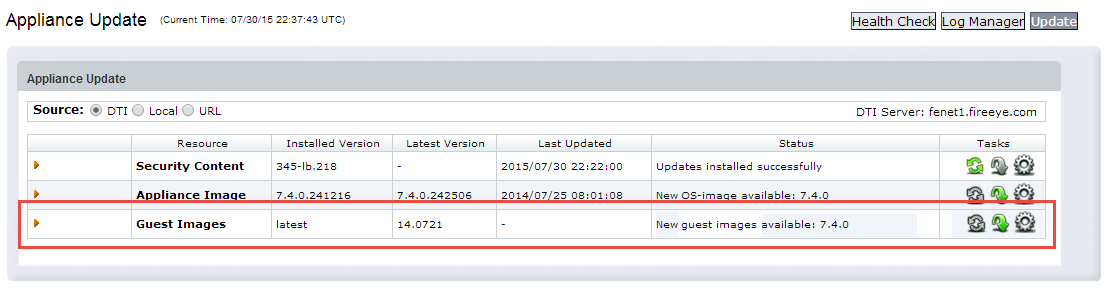
Guest image status and options are available in the Appliance Update table.
© 2021 FireEye
25
To check for guest images updates:
Log in to the Web UI using a valid Admin or Operator user name and password.
Choose About > Update to open the Appliance Update page.
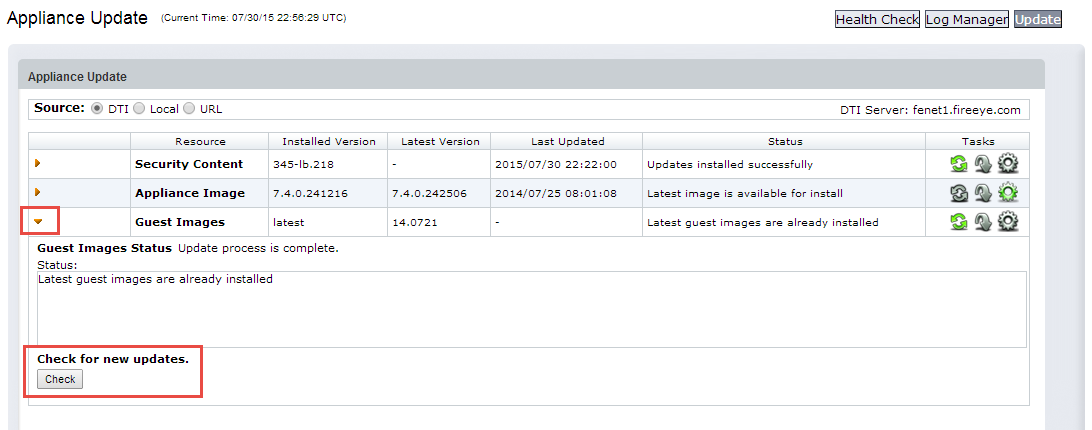
Click the red triangle in the Guest Images row to expand guest images details.
Click Check to check for any available updates.
You can also click the check button in the Guest Images row to check for updates.

To download guest images updates:
Log in to the Web UI using a valid Admin or Operator user name and password.
Choose About > Update to open the Appliance Update page.
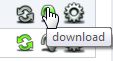
Click the download button on the Guest Images row.
If no guest images update is available to download, this button is disabled.
To install guest images updates:
Log in to the Web UI using a valid Admin or Operator user name and password.
Choose About > Update to open the Appliance Update page.
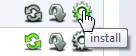
3. Click the install button on the Guest Images row.
If no guest images update is available to install, this button is disabled.
Viewing Guest Images Using the CLI
This topic describes how to view guest images using CLI commands on an File Protect appliance.
[IMAGE PLACEHOLDER: Blue circular note icon]
You cannot manage guest image updates from the CLI. For information about how to manage guest images, refer to Managing Guest Images Using the Web UI.
Prerequisites
To view guest images on your File Protect appliance, ensure you have:
An established connection to the Internet
A connection to the DTI Cloud or a CM server
Admin or Operator access to the File Protect appliance
A CONTENT_UPDATES license
A FIREEYE_SUPPORT license
Viewing Guest Images Using the CLI
The File Protect CLI commands allow you to view the following information about guest images:
Available guest images
Guest images configurations
Downloaded and installed guest images
NOTE: The Guest Images list is dynamic: new guest images and version updates for the current guest images are automatically made available to your appliance from the DTI cloud through security content updates.

To show guest images:
Enable the CLI configuration mode.
hostname > enablehostname # configure terminalShow the available bundles, defaults, or profiles for guest images.
hostname (config) # show guest-images [available {bundles | defaults | profiles}]Show the configuration for current guest images.
hostname (config) # show guest-images configShow downloaded and installed guest images.
hostname (config) # show guest-images download
Output Examples for show guest images Commands
The following examples show output for the show guest images commands.
To show available default guest images:
Enable the CLI configuration mode.
hostname > enablehostname # configure terminalShow the available default guest images.
hostname (config) # show guest-images available defaultsThe default bundle contains the following profiles:
winxp-sp3m - Windows XP sp3 English 32-bit (Intel).winxp-sp2m - Windows XP sp2 English 32-bit (Intel).win7x64-sp1m - Windows 7 sp1 English 64-bit (Intel).win7-sp1m - Windows 7 SP1 English 32-bit (Intel).
To show available profiles for guest images:
Enable the CLI configuration mode.
hostname > enablehostname # configure terminal
Show the available profiles for guest images.
hostname (config) # show guest-images available profilesThe following profiles are available:
[0] winxp-sp3m - Windows XP sp3 English 32-bit (Intel).
[1] winxp-sp2m - Windows XP sp2 English 32-bit (Intel).
[2] win7x64-sp1m - Windows 7 sp1 English 64-bit (Intel).
[3] win7-sp1m - Windows 7 SP1 English 32-bit (Intel).
To show the configuration for current guest images:
Enable the CLI configuration mode.
hostname > enable hostname # configure terminalShow the configuration for current guest images.
hostname (config) # show guest-images configGuest-image configuration is set to default:
winxp-sp3m - Windows XP sp3 English 32-bit (Intel).
winxp-sp2m - Windows XP sp2 English 32-bit (Intel).
win7x64-sp1m - Windows 7 sp1 English 64-bit (Intel).
win7-sp1m - Windows 7 SP1 English 32-bit (Intel).
To show downloaded and installed guest image updates:
Enable the CLI configuration mode:
hostname > enable hostname # configure terminalShow downloaded and installed guest images.
hostname (config) # show guest-images downloadThe following Guest-image profiles are installed:
winxp-sp3m (Version 14.0528): Windows XP sp3 English 32-bit (Intel).
winxp-sp2m (Version 14.0528): Windows XP sp2 English 32-bit (Intel).
win7x64-sp1m (Version 14.0528): Windows 7 sp1 English 64-bit (Intel).
win7-sp1m (Version 14.0528): Windows 7 SP1 English 32-bit (Intel).
YARA Rules
This section covers the following information:
About YARA Rules
About Creating Custom YARA Rules
Uploading YARA Rules Using the Web UI
Enabling or Disabling FireEye YARA Rules Using the CLI
Enabling or Disabling Custom YARA Rules Using the CLI
Enabling or Disabling FireEye and Custom YARA Rules Using the CLI
Configuring Limit Matches for YARA Rules Using the CLI
Configuring the YARA Rule Weight Default Using the CLI
About YARA Rules
YARA is an open-source malware analytic tool that the FireEye File Protect appliances support. YARA rules help analysts identify and classify malware samples by creating groups of malware families based on byte-level rules to quickly analyze large quantities of files for matches. If the analysts identify a suspicious byte pattern, they can create a new YARA rule to identify likely malicious files. YARA integration results report whether an unknown file has been previously classified as malicious.
YARA rules are written and uploaded to the File Protect appliance as ASCII text files. The use of YARA rules is enabled by default.
For information about the supported YARA version for your release, see the Release Notes.
FireEye appliances identify the file type of a suspicious sample file and then apply YARA rules to a collection of files in the following order:
YARA rules that apply to common (all supported) file types
FireEye YARA rules specific to a selected file type
Custom YARA rules that apply to common (all supported) file types
Custom YARA rules specific to a selected file type
You can create your own YARA rules or use the rules that FireEye provides. By default, every custom YARA rule has an integer weight associated with it, ranging from 0 to 100. During static analysis, when a YARA rule match is made, the weight of the matched rule is added to the overall score of the file deemed malicious. As more YARA rules are matched, the rule with the highest weight is used. If no weight is provided for a YARA rule, the default YARA weight is used.
About Creating Custom YARA Rules
You can upload and configure YARA rules, but you must create them outside FireEye appliances. This section contains a brief overview of creatig custom YARA rules.
YARA Rule Guidelines
When creating custom YARA rules, follow these guidelines.
YARA rules must conform to the supported version of YARA. See the Release Notes for the YARA version supported by this release of the appliance. For details about YARA, see yara Documentation by Victor Alvarez.
YARA rule names cannot contain spaces.
Each YARA rule must include the
weight=option. When the cumulative weight assigned to a file reaches 100, an alert will be generated. If theweight=option is omitted, the rule will not be triggered. You can set the weight to 100 to generate an alert immediately when one rule is matched.YARA rule names cannot begin with
FE_. If you attempt to upload a rule that begins withFE_, the upload fails and an error occurs.The total number of YARA rules uploaded across all files uploaded cannot exceed 5,000.
Multiple YARA rules can be specified in a single file. However, all rule names must be unique across all uploaded files.
YARA Rule Files
Each YARA file you upload to your File Protect appliance must have a unique file name.
File names can include the following values: letters (a-z, A-Z), numbers (0-9), underscores (_), periods ( . ), plus and minus signs ( +, - ), single quotes ( ' ), and left and right parentheses.
Any other characters are replaced with the minus sign ( - ). For example, if you upload a file named hello%hello.doc, the file is renamed and stored on the appliance as hello-hello.doc.
Before you upload a file of YARA rules, test the file.
Maintain copies of your custom YARA rules files on your local system or in another storage area that is not on the appliance.
IMPORTANT! The reset factory keep-all-config CLI command does not preserve uploaded YARA rules.
YARA Rule Format
YARA rules typically contain the following sections, although variations are allowed:
Strings definition: This section is optional and can be omitted if the rule does not rely on any string.
Condition: This section is always required.
Each string has an identifier consisting of a '$' character followed by one or more alphanumeric characters and underscores. These identifiers can be used in the condition section to refer to the corresponding string. Strings can be defined in text or hexadecimal form.
Example 1
The following example shows a rule called SilentBanker. The rule instructs YARA that files containing the string "win.exe" and any of the two URLs belong to the SilentBanker family and are reported as SilentBanker. If two of these URLs are detected, the cummulative weight of 100 will be reached and a YARA alert will be triggered.
rule SilentBanker
{
meta:
Author = "Author Name"
Description ="yara triggering on 1MB size"
weight = 50
strings:
$a = "win.exe"
$b = "http://foo.com/badfile1.exe"
$c = "http://bar.com/badfile2.exe"
condition:
$a and ($b or $c)
}
Example 2
The following example shows a rule called block_all_1mb_plus_files. The rule instructs YARA that files larger than 1000 KB should trigger a YARA alert.
rule block_all_1mb_plus_files
{
meta:
Author = "Author Name"
Description ="yara triggering on 1MB size"
weight = 100
strings:
// there are no strings in this example
condition:
// use the "filesize" keyword
filesize > 1000KB
}
Uploading YARA Rules Using the Web UI
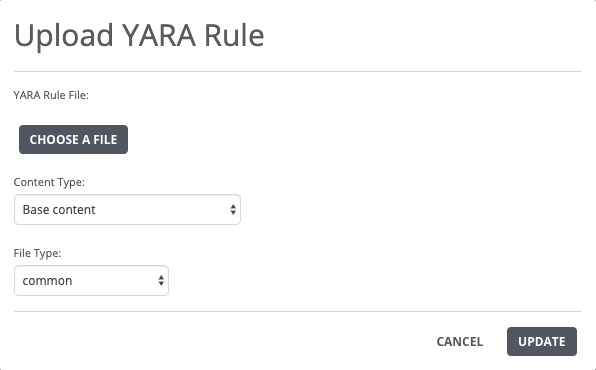
Use the Settings > YARA Rules page to manage your YARA rules. On this page you can search your local machine for custom YARA rules files and upload them to the appliance. Before you search, you can specify the file type. Additionally, you can view your files and the associated content types in a custom YARA rules table.
YARA Rule File:
Content Type:
Base content
File Type:
common
If you use a CM Series platform to upload a YARA rules file to an File Protect appliance running Release 7.8.0 or newer, the CM Series platform uploads the YARA rules file to other managed File Protectappliances in the same appliance group.
Prerequisites
An established connection between the File Protect appliance and the Internet.
You are logged in to the Web UI as an Admin or Operator access.
To upload a YARA rules file:
Go to the Settings > YARA Rules page.
Click Upload YARA File.
Click Choose a File, then select the local YARA rule file you want to upload.
In the Content Type drop-down list, select the content type to which you want to apply the YARA rule:
Base content
Active content
Both (Base content + Active content)
In the File Type drop-down list, select the file type to which you want to apply the YARA rule, or select Common if the rule applies to all file types.
Click Update to upload the YARA rule file.
If an invalid rule file is uploaded, or the selected file type does not match the contents of the YARA file, the Download File and the Download Error Log buttons appear. Use these buttons to download the invalid file and the error log.
To delete a YARA rule file:
Go to the Settings > YARA Rules page.
In the custom YARA rules table, locate the rule you want to delete.
Select the box in the Delete column.
Click Delete File.
Enabling or Disabling FireEye YARA Rules Using the CLI
Use the commands in this procedure to enable or disable FireEye YARA rules on your File Protect appliance. You cannot use the Web UI to configure YARA rules.
Prerequisites
An established connection between the File Protect appliance and the Internet.
Administrator or Operator access to the File Protect appliance.
To enable FireEye YARA rules:
Go to CLI configuration mode.
hostname > enable hostname # configure terminalEnable the FireEye YARA rules.
hostname (config) # yara policy feVerify your configuration.
hostname (config) # show static-analysis config ..... Yara Configuration Yara policy : fe .....Save your changes.
hostname (config) # write memory
To disable FireEye YARA rules:
Go to CLI configuration mode.
hostname > enable hostname # configure terminalDisable the FireEye YARA rules.
hostname (config) # yara policy disableVerify your configuration.
hostname (config) # show static-analysis config ..... Yara Configuration Yara policy : disable .....Save your changes.
hostname (config) # write memory
Enabling or Disabling Custom YARA Rules Using the CLI
Use the commands in this procedure to enable or disable custom YARA rules on your File Protect appliance. You cannot use the Web UI to configure YARA rules.
Prerequisites
An established connection between the File Protect appliance and the Internet.
Administrator or Operator access to the File Protect appliance.
To enable custom YARA rules:
Go to CLI configuration mode.
hostname > enablehostname # configure terminalEnable the custom YARA rules.
hostname (config) # yara policy custVerify your configuration.
hostname (config) # show static-analysis config ..... Yara Configuration Yara policy : cust .....Save your changes.
hostname (config) # write memory
To disable custom YARA rules:
Go to CLI configuration mode.
hostname > enablehostname # configure terminalDisable the custom YARA rules.
hostname (config) # yara policy disableVerify your configuration.
hostname (config) # show static-analysis config ..... Yara Configuration Yara policy : disableSave your changes.
hostname (config) # write memory
Enabling or Disabling FireEye and Custom YARA Rules Using the CLI
Use the commands in this procedure to enable or disable FireEye and custom YARA rules on your File Protect appliance. You cannot use the Web UI to configure YARA rules.
Prerequisites
An established connection between the File Protect appliance and the Internet.
Administrator or Operator access to the File Protect appliance.
To enable FireEye and custom YARA rules:
Go to CLI configuration mode.
hostname > enable hostname # configure terminalEnable FireEye and custom YARA rules.
hostname (config) # yara policy bothVerify your configuration.
hostname (config) # show static-analysis config ..... Yara Configuration Yara policy : both .....Save your changes.
hostname (config) # write memory
To disable FireEye and custom YARA rules:
Go to CLI configuration mode.
hostname > enable hostname # configure terminalDisable FireEye and custom YARA rules.
hostname (config) # yara policy disableVerify your configuration.
hostname (config) # show static-analysis config ..... Yara Configuration Yara policy : disable .....Save your changes.
hostname (config) # write memory
Configuring Limit Matches for YARA Rules Using the CLI
During YARA static analysis, FireEye identifies and reports on the first five matching YARA rules. YARA rules are specific enough that only one or two rules will match malicious samples at a time; therefore, more than five matches are rare.
Note: You cannot configure YARA rules using the sensor CLI.
Prerequisites
An established connection between the File Protect appliance and the Internet.
Administrator or Operator access to the File Protect appliance.
To configure the limit for matching YARA rules:
Go to CLI configuration mode.
hostname > enable hostname # configure terminalSpecify the limit for YARA matches.
hostname (config) # yara match limit <number>where:
<number> is an integer between 0 and 100 for customer YARA rules. Any number larger than 100 is truncated to 100.
Verify your configuration.
hostname (config) # show static-analysis config ..... Yara Configuration ..... Yara customer match limit : 5Save your changes.
hostname (config) # write memory
Configuring the YARA Rule Weight Default Using the CLI
By default, every custom YARA rule has an integer weight associated with it, ranging from 0 to 100. During static analysis, when a YARA rule match is made, the corresponding weight of the matched rule is added to the overall score of the file deemed malicious. As more YARA rules are matched, the rule with the highest weight is used. If no weight is provided for a YARA rule, the default YARA weight is used.
Note: You cannot configure YARA rules using the sensor CLI.
Prerequisites
An established connection between the File Protect appliance and the Internet.
Administrator or Operator access to the File Protect appliance.
To configure the YARA rule weight default:
Go to CLI configuration mode.
hostname > enable hostname # configure terminalSpecify the limit for YARA matches.
hostname (config) # yara weight default <100 +/->where:
<100 +/-> is an integer between 0 and 100.
The following example configures a YARA weight of 75:
hostname (config) # yara weight default 75
Static Analysis Tools
You can configure the File Protect appliance to perform static analysis on submitted malware samples by using AV-Suite integration, AV-Check, Malware Intrinsic Analysis, and Python-based tools. You can enable or disable each static analysis tool individually or all of the static analysis tools at one time.
This section describes the following information used to configure each static analysis tool:
Enabling or Disabling Static Analysis
AV-Suite Integration
Enabling or Disabling AV-Check
Enabling or Disabling Dropper Detection
Enabling or Disabling the Python-Based Tool
Enabling or Disabling Static Analysis
Use the CLI commands to enable or disable static analysis on the File Protect appliance.
Note: Static analysis is enabled by default.
Prerequisites
Administrator or Operator access to the File Protect appliance.
Enabling or Disabling Static Analysis Using the CLI
Follow these steps to enable or disable static analysis on the File Protect appliance.
To enable static analysis:
Enter the CLI configuration mode:
hostname > enable hostname # configure terminalEnable static analysis on the appliance.
hostname (config) # static-analysis enableVerify the status that static analysis is enabled on the appliance.
hostname (config) # show static-analysis configStatic Analysis enabled : yes AV-suite enabled : yes AV-suite version : 6 SA on AV-suite whitelist enabled : no AV-check enabled : yes Dropper enabled : yes YARA enabled : yes .....
To disable static analysis:
Enter the CLI configuration mode:
hostname > enable hostname # configure terminalDisable static analysis on the appliance.
hostname (config) # no static-analysis enableVerify the status that static analysis is disabled on the appliance.
hostname (config) # show static-analysis configStatic Analysis enabled : no AV-suite enabled : yes AV-suite version : 6 SA on AV-suite whitelist enabled : no AV-check enabled : yes Dropper enabled : yes YARA enabled : yes .....
AV-Suite Integration
FireEye’s AV-Suite Integration feature is a DTI cloud solution that provides intelligent analysis of complete, incomplete, or corrupted network files. This feature turns on the connection between the AV client (which is embedded in the File Protect appliance) and the DTI cloud.
When this connection is enabled, the AV client looks up the unique hash of each file on the DTI cloud. The DTI cloud analyzes the file and returns its analysis to the appliance. The results of this analysis are displayed in the expanded malware information on the File Analysis page in the Web UI.
AV-Suite integration is enabled by default and is used under all normal circumstances. After it has been enabled, no other configuration steps are necessary to run or use this feature. Use the disable command to disconnect the AV client from the DTI cloud for troubleshooting.
Task List for Managing AV-Suite Integration
Complete the steps for managing AV-Suite integration in the following order:
In the CLI, specify the settings for AV-Suite integration.
Verify that AV-Suite integration is enabled on the appliance. Use the
show static-analysis configcommand.View the results on the File Analysis page in the Web UI.
Enabling or Disabling AV-Suite Integration Using the CLI
Use the CLI commands to enable or disable AV-Suite integration between the appliance and the DTI cloud.
Note: AV-suite version 6 must be configured for AV-Suite to receive suspicious object hashes through the DTI network to determine whether the object hashes have been seen before. You can view the results of this integration only using the Web UI.
Prerequisites
Administrator or Operator access to the File Protect appliance
An established connection to the Internet
A connection to the DTI Cloud
A FIREEYE_SUPPORT license
To enable AV-Suite integration:
Enable the CLI configuration mode.
hostname > enable hostname # configure terminalEnable AV-Suite integration on the appliance.
hostname (config) # static-analysis av-suite enableVerify the status of AV-Suite integration.
hostname (config) # show static-analysis configStatic Analysis enabled : yes AV-suite enabled : yes AV-suite version : 6 SA on AV-suite whitelist enabled : no AV-check enabled : yes Dropper enabled : yes YARA enabled : yes .....
To disable AV-Suite integration:
Enable the CLI configuration mode.
hostname > enable hostname # configure terminalDisable AV-Suite integration on the appliance.
hostname (config) # no static-analysis av-suite enableVerify the status of AV-Suite integration.
hostname (config) # show static-analysis configStatic Analysis enabled : yes AV-suite enabled : no AV-suite version : 6 SA on AV-suite whitelist enabled : no AV-check enabled : yes Dropper enabled : yes YARA enabled : yes .....
Enabling or Disabling AV-Suite Integration on Whitelist Submissions Using the CLI
Use the CLI commands to enable or disable AV-Suite integration between the appliance and the DTI Cloud on whitelist submissions. When static analysis and AV-Suite integration on whitelist submissions are enabled on the appliance, the submitted malware samples that are marked with the verdict "Clean" by the AV-Suite service will be included in static analysis. For details about AV-Suite, see AV-Suite .
Note: AV-Suite integration on whitelist submissions is disabled by default.
Prerequisites
Administrator or Operator access to the File Protect appliance
An established connection to the Internet
A connection to the DTI Cloud
A two-way sharing CONTENT_UPDATES license
A FIREEYE_SUPPORT license
Verify that static analysis is enabled on the appliance. Use the
show static-analysis configcommand.Verify that AV-Suite integration is enabled on the appliance. Use the
show static-analysis configcommand.
To enable AV-Suite integration on whitelist submissions:
Enable the CLI configuration mode.
hostname > enable hostname # configure terminalEnable AV-Suite integration on whitelist submissions on the appliance.
hostname (config) # static-analysis av-suite whitelist enableSave your changes.
hostname (config) # write memoryVerify the status of AV-Suite integration on whitelist submissions.
hostname (config) # show static-analysis configStatic Analysis enabled : yes AV-suite enabled : yes AV-suite version : 6 SA on AV-suite whitelist enabled : yes AV-check enabled : yes Dropper enabled : yes YARA enabled : yes .....
The "SA on AV-suite whitelist enabled" line displays "yes" if AV-Suite integration on whitelist submissions is enabled.
To disable AV-Suite integration on whitelist submissions:
Enable the CLI configuration mode.
hostname > enable hostname # configure terminalDisable AV-Suite integration on whitelist submissions on the appliance.
hostname (config) # no static-analysis av-suite whitelist enableSave your changes.
hostname (config) # write memoryVerify the status of AV-Suite integration on whitelist submissions.
hostname (config) # show static-analysis config Static Analysis enabled : yes AV-suite enabled : yes AV-suite version : 6 SA on AV-suite whitelist enabled : no AV-check enabled : yes Dropper enabled : yes YARA enabled : yes .....
The "SA on AV-suite whitelist enabled" line displays "no" if AV-Suite integration on whitelist submissions is disabled.
Viewing AV-Suite Integration Using the Web UI
After you have configured the AV-Suite integration feature using the CLI, you can view the results of these interactions using the File Protect Web UI.
Prerequisites
An established connection to the Internet
A connection to the DTI Cloud
Administrator or Operator access to the File Protect appliance
AV-Suite integration has been enabled

You can configure this feature only using the CLI.
To view results from AV-Suite integration:
Navigate to the File Analysis page.
Only events that contain a malicious alert display AV-Suite information.
2. Locate an event with Yes in the IM column, which stands for Is Malicious.
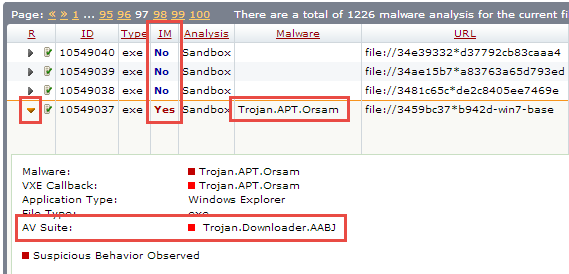
The event includes all components that the DTI cloud flagged in the malicious file, including the name of the malware.
Enabling or Disabling AV-Check
Use the CLI commands to enable or disable AV-Check, which provides another type of static analysis on the File Protect appliance. AV-Check allows the appliance to use antivirus tools, such as Sophos and ClamWin, to scan malware samples. After you have configured AV-Check using the CLI, you can view the analysis of the results on the File Analysis page in the Web UI.
After AV-Check is enabled, no other configuration is required.
Prerequisites
Administrator or Operator access to the File Protect appliance
An AV_ENGINE_SOPHOS license
Enabling or Disabling AV-Check Using the CLI
Follow these steps to enable or disable AV-Check to perform static analysis on the File Protect appliance.
To enable AV-Check:
Enable the CLI configuration mode.
hostname > enablehostname # configure terminalEnable AV-Check to perform static analysis on the appliance.
hostname (config) # static-analysis av-check enableVerify that AV-Check is enabled to perform static analysis on the appliance.
hostname (config) # show static-analysis configStatic Analysis enabled : yes AV-suite enabled : no AV-suite version : 6 SA on AV-suite whitelist enabled : no AV-check enabled : yes Dropper enabled : yes YARA enabled : yes .....
To disable AV-Check:
Enable the CLI configuration mode.
hostname > enablehostname # configure terminalDisable AV-Check.
hostname (config) # no static-analysis av-check enableVerify that AV-Check is disabled.
hostname (config) # show static-analysis configStatic Analysis enabled : yes AV-suite enabled : no AV-suite version : 6 SA on AV-suite whitelist enabled : no AV-check enabled : no Dropper enabled : yes YARA enabled : yes .....
Enabling or Disabling Dropper Detection
Use the CLI commands to enable or disable the dropper detection component, which provides another type of static analysis on the File Protect appliance. This component allows the File Protect appliance to identify malicious files that might have installed additional types of malware on your system. A dropper is not associated with any file extensions, and it is often part of a spearphishing attempt. The File Protect appliance sends the dropper files that matched the first ten MD5 checksums to the Dynamic Threat Intelligence (DTI) Cloud for further analysis. When the dropper detection component is disabled, the File Protect appliance does not send the dropper files to the DTI Cloud. After you have configured the File Protect appliance to detect dropper files using the CLI, you can view the analysis of the results on the Alerts > Alerts page in the Web UI.
You can enable or disable dropper detection only using the CLI. This component is enabled by default.

Prerequisites
Administrator or Operator access to the File Protect appliance
A connection to the DTI Cloud
Verify that static analysis is enabled on the appliance. Use the
show static-analysis configcommand.Verify that AV-Suite integration is enabled on the appliance. Use the
show static-analysis configcommand.
Enabling or Disabling Dropper Detection Using the CLI
Follow these steps to enable or disable the dropper detection component to perform static analysis on the File Protect appliance.
To enable dropper detection:
Enable the CLI configuration mode.
hostname > enable hostname # configure terminalEnable the dropper detection component to perform static analysis on the appliance.
hostname (config) # static-analysis dropper enableVerify that the dropper detection component can perform static analysis on the appliance.
hostname (config) # show static-analysis configStatic Analysis enabled : yes AV-suite enabled : yes AV-suite version : 6 SA on AV-suite whitelist enabled : no AV-check enabled : yes Dropper enabled : yes YARA enabled : yes .....
To disable dropper detection:
Enable the CLI configuration mode.
hostname > enable hostname # configure terminalDisable dropper detection.
hostname (config) # no static-analysis dropper enableVerify that dropper detection is disabled.
hostname (config) # show static-analysis config
Static Analysis enabled : yes
AV-suite enabled : yes
AV-suite version : 6
SA on AV-suite whitelist enabled : no
AV-check enabled : yes
Dropper enabled : no
YARA enabled : yes
.....Enabling or Disabling the Python-Based Tool
Use the CLI commands to enable or disable the Python-based static analysis tool on the File Protect appliance. This tool allows the File Protect appliance to perform static analysis on submitted malware samples based on defined YARA rules and based on other file type analysis techniques. After you have configured the File Protect appliance to perform YARA analysis using the CLI, you can view the analysis of the results on the File Analysis page in the Web UI.

You can enable or disable the Python-based tool only using the CLI. This tool is enabled by default.
Prerequisites
Administrator or Operator access to the File Protect appliance
Enabling or Disabling the Python-Based Tool Using the CLI
Follow these steps to enable or disable the Python-based tool to perform static analysis on malware samples based on YARA rules and based on other file type analysis techniques.
To enable the Python-based tool:
Enable the CLI configuration mode.
hostname > enable hostname # configure terminalEnable the Python-based tool to perform static analysis on the appliance.
hostname (config) # static-analysis sa-python enable
Verify that the Python-based tool can perform static analysis based on YARA rules and based on other file type analysis techniques on the appliance.
hostname (config) # show static-analysis config Static Analysis enabled : yes AV-suite enabled : yes AV-suite version : 6 SA on AV-suite whitelist enabled : no AV-check enabled : yes Dropper enabled : yes YARA enabled : yes .....
To disable the Python-based tool:
Enable the CLI configuration mode.
hostname > enable hostname # configure terminalDisable the Python-based tool.
hostname (config) # no static-analysis sa-python enableVerify that the Python-based tool is disabled.
hostname (config) # show static-analysis config
Static Analysis enabled : yes AV-suite enabled : yes AV-suite version : 6 SA on AV-suite whitelist enabled : no AV-check enabled : yes Dropper enabled : yes YARA enabled : no .....
AV-Suite
AV-Suite is a cloud-based detection service that stores verdicts for both malicious (blacklist) and nonmalicious (whitelist) objects. Information about a sample is sent to AV-Suite by the File Protect appliance. This service is accessed by the File Protect appliance using the AV-Suite Integration feature to provide verdicts based on advanced detection analytics in the cloud. Because dynamic analysis can be slow, AV-Suite helps to ensure the optimal appliance and analysis engine performance by not submitting samples that were whitelisted by AV-Suite to dynamic analysis.
Before an object is submitted to the File Protect appliance for dynamic analysis, the appliance queries the AV-Suite server for a verdict. If a clean verdict is returned from AV-Suite for the file, the File Protect appliance will not analyze the file for malicious content and the appliance will not perform dynamic analysis for this sample. If a malicious or riskware verdict is returned from AV-Suite, the File Protect appliance will still perform dynamic analysis to generate an OS Change report.
When retroactive detection is enabled on the appliance, the appliance can alert on previously undetected objects. The File Protect appliance can alert on previously undetected objects when a new verdict is generated for that object within the DTI Cloud.
Task List for Managing AV-Suite
Complete the steps for managing AV-Suite in the following order:
Log in to the CLI.
Validate DTI access on the File Protect appliance by using the
show fenet statuscommand. For details about how to validate DTI access, refer to the File Protect System Administration Guide.Verify that
unity.fireeye.comis the DTI server address for AV-Suite to store both blacklist and whitelist object hashes and analysis results. Use theshow fenet dti configurationcommand. For details about how to set the DTI server destination for AV-Suite, refer to the File Protect System Administration Guide.
IMPORTANT: By default, this address for managed appliances is the address of the managing Central Management appliance. For more effective detection and remediation, FireEye recommends a direct connection to
unity.fireeye.com.
Verify that AV-Suite integration is enabled and that AV-suite version 6 is configured. Use the
show static-analysis configcommand. For details about AV-Suite integration, see Enabling or Disabling AV-Suite Integration Using the CLI.Enable static analysis and AV-Suite integration on whitelist submissions. For details about how to enable AV-Suite Integration on whitelist submissions, see Enabling or Disabling AV-Suite Integration on Whitelist Submissions Using the CLI.
Enable retroactive detection from AV-Suite. Use the
analysis retro-hunt enablecommand. For details about how to enable retroactive detection from AV-Suite, see Enabling or Disabling Retroactive Detection From AV-Suite below.Configure the settings for retroactive detection from AV-Suite. For details about how to configure the settings for retroactive detection from AV-Suite, see Configuring Retroactive Detection From AV-Suite.
Enabling or Disabling Retroactive Detection From AV-Suite
When you enable retroactive detection from AV-Suite, the File Protect appliance queries the AV-Suite server for previous retroactive verdicts based on the submitted malware samples.
When retroactive detection from AV-Suite is disabled, the File Protect appliance does not query the AV-Suite server for previous retroactive verdicts based on submitted samples.
Note: Retroactive detection from AV-Suite is enabled by default.
Prerequisites
Administrator or Operator access to the File Protect appliance
A two-way sharing
CONTENT_UPDATESlicenseVerify that AV-Suite integration is enabled and that AV-suite version 6 is configured. Use the
show static-analysis configcommand.
Enabling or Disabling Retroactive Detection From AV-Suite Using the CLI
Follow these steps to enable or disable retroactive detection from AV-Suite using the CLI.
To enable retroactive detection from AV-Suite:
Go to CLI configuration mode:
hostname > enable hostname # configure terminalEnable retroactive detection.
hostname (config) analysis retro-hunt enableSave your changes.
hostname (config) # write memoryVerify the status for retroactive detection.
hostname (config) show analysis config ..... Retroactive hunting : Enabled .....
The "Retroactive hunting" line displays "Enabled" to indicate that the File Protect appliance can access the previous results of the analysis that were stored in AV‑Suite.
To disable retroactive detection from AV-Suite:
Go to CLI configuration mode:
hostname > enable hostname # configure terminal
Disable retroactive detection.
hostname (config) # no analysis retro-hunt enableSave your changes.
hostname (config) # write memoryVerify the status for retroactive detection.
hostname (config) show analysis config ...... Retroactive hunting : Disabled .....
The "Retroactive hunting" line displays "Disabled" to indicate that the File Protect appliance cannot access the previous results of the analysis that were stored in AV-Suite.
Configuring Retroactive Detection From AV-Suite
You can configure the settings for retroactive detection from AV-Suite by using the File Protect appliance CLI:
You can configure how often the File Protect appliance queries the AV-Suite server for previous retroactive verdicts. You can also configure how long you want to store information (filename, file type, engine type, MD5 checksum, and SHA-256 hash file) in AV-Suite for the malicious and nonmalicious objects and to check for a particular object to update. The verdict remains in AV-Suite but other information about the object is removed.
Prerequisites
Administrator or Operator access to the File Protect appliance
A two-way sharing CONTENT_UPDATES license
Verify that AV-Suite integration is enabled. Verify that AV-suite version 6 is configured. Use the
show static-analysis configcommand.Enable retroactive detection from AV-Suite. Use the
analysis retro-hunt enablecommand.
Configuring AV-Suite to Store the Objects Using the CLI
Follow these steps to configure how long you want to store information (filename, file type, engine type, MD5 checksum, and SHA-256 hash file) in AV-Suite for malicious and nonmalicious objects using the CLI.
To configure the length of time to store the objects:
Go to CLI configuration mode:
hostname > enable hostname # configure terminalSpecify how long you want to store the objects.
hostname (config) # analysis retro-hunt time <hours>The range is from 1 to 720 hours. The default value is 0 hours, which means an unlimited time period.
Save your changes.
hostname (config) # write memoryVerify the setting for how long the objects are stored in AV-Suite.
hostname (config) # show analysis config ..... Analysis reset duplicate since : 2018/04/19 10:41:23 Retroactive hunting : Enabled Retroactive hunting time : 0 hours Retroactive update interval : 300 seconds VM throttling : AUTO Riskware detection : Disabled .....
Configuring Retroactive Detection Updates From AV-Suite Using the CLI
Follow these steps to configure retroactive detection updates from AV-Suite using the CLI.
To configure the retroactive detection updates from AV-Suite:
Go to CLI configuration mode:
hostname > enable hostname # configure terminalSpecify the update time interval.
hostname (config) # analysis retro-hunt update interval <seconds>The range is from 10 to 86400 seconds. The default value is 300 seconds.
Save your changes.
hostname (config) # write memoryVerify the setting for how often the File Protect appliance queries the AV‑Suite server for previous retroactive verdicts.
hostname (config) # show analysis config
.....
Analysis reset duplicate since : 2018/04/19 10:41:23
Retroactive hunting : Enabled
Retroactive hunting time : 0 hours
Retroactive update interval : 300 seconds
VM throttling : AUTO
Riskware detection : Disabled
.....Configuring the Maximum File Size for Analysis Using the CLI
Use the CLI commands in this topic to configure the maximum size of the file to be analyzed on the File Protect appliance. If the submitted file is larger than the configured maximum size, the File Protect appliance will not perform dynamic analysis or static analysis on the submitted malware sample. If the file is equal to or smaller than the configured maximum size but larger than the maximum size for dynamic analysis, the File Protect appliance will perform static analysis only. If the file is equal to the configured maximum size for dynamic analysis, the File Protect appliance will perform dynamic analysis and static analysis on submitted malware samples.
Prerequisites
Administrator or Operator access to the File Protect appliance.
To configure the maximum size of the file for analysis:
Go to CLI configuration mode.
hostname > enable hostname # configure terminalSpecify the maximum size of the file.
hostname (config) # analysis file max-size <MB>where <MB> is the maximum size of the file to be analyzed. The maximum size of the file can range from 1 MB to 10 GB (10000 MB). By default, the maximum size of the file is 100 MB.
Verify the configuration of the maximum size of the file.
hostname (config) # show analysis config
.....
Retroactive hunting : Enabled
Retroactive hunting time : 0 hours
Retroactive update interval : 300 seconds
VM throttling : AUTO
Riskware detection : Enabled
Max overall file size : 1000
Max DA file size : 32
The "Max overall file size:" line displays the maximum size of the file for analysis.
To configure the maximum size of the file for dynamic analysis:
Go to CLI configuration mode.
hostname > enable hostname # configure terminalSpecify the maximum size of the file for dynamic analysis.
hostname (config) # analysis file max-size da <MB>where <MB> is the maximum size of the file to be analyzed for dynamic analysis. The maximum size of the file for dynamic analysis can range from 1 MB to 100 MB. By default, the maximum size of the file for dynamic analysis is 32 MB.
Verify the configuration of the maximum size of the file for dynamic analysis.
hostname (config) # show analysis config .....Retroactive hunting : Enabled Retroactive hunting time : 0 hours Retroactive update interval : 300 seconds VM throttling : AUTO Riskware detection : Enabled Max overall file size : 100 Max DA file size : 32The "Max DA file size:" line displays the maximum size of the file for dynamic analysis.
Configuring Analysis Settings
You can configure the following system settings for file analysis.
Maximum File Size—This is the maximum file size to be analyzed. The default size is 5 MB; the maximum is 512 MB.
Analysis Timeout—The MVX engine will stop dynamic analysis of a single file after this amount of time elapses, and classify the file as "unknown." The default is 240 seconds (4 minutes).
Scan Delay—This is the interval at which the File Protect appliance checks file shares for newly added or modified files, in minutes. The default is 3 minutes; the minimum is .02 minutes (1 second).
Note: FireEye strongly recommends that you configure a scan delay that is at least one minute to accommodate network latency issues with file system operations. Otherwise, a continuous scan could check files that are in the process of being modified.
WINS Server IP Address—If you are using Distributed File System (DFS) shares, you need to configure the IP address of the Windows Internet Name Service (WINS) server used to resolve link targets using NetBIOS. You can configure the IP address using the CLI as described in Configuring File Analysis Settings Using the CLI below or on the Settings>Network page of the File Protect Web UI.
Share Timeout—A share can be inaccessible for this amount of time before a running scan is aborted. The default is 300 seconds (5 minutes).
Prerequisites
Operator or Administrator access
Configuring File Analysis Settings Using the CLI
Use the commands in this section to configure file analysis settings using the CLI.
To configure file analysis settings:
Enable the CLI configuration mode:
hostname > enable hostname # configure terminalTo specify the maximum file size:
hostname (config) # fmps file config maxsize MB
To specify the scan delay:
hostname (config) # fmps file config scan_delay minutesTo specify the WINS server:
hostname (config) # fmps file config wins_server ipAddressTo specify the share timeout:
hostname (config) # fmps file config share-timeout secondsVerify the values:
hostname (config) # show fmps file configSave your changes:
hostname (config) # write memory
Example
The following example changes the maximum file size to 200 MB and the share timeout to 350 seconds, and then shows the updated file analysis settings.
hostname (config) # fmps file config maxsize 200
hostname (config) # fmps file config share-timeout 350
hostname (config) # show fmps file config
Max File Size (MB): 200
Analysis Timeout (sec): 240
Scan Delay: 3 min 0 sec
Wins Server:
Share Timeout (sec): 350Configuring EML Parsing Settings
By default, the File Protect appliance analyzes saved email (.eml) files for malware issues. Use the commands in this section to configure the maximum number of attachments that can be analyzed for each .eml file and the maximum recursive depth of the .eml file to be analyzed.
EML parsing is configured using the CLI only.
To configure EML parsing settings:
Enable the CLI configuration mode:
hostname > enable hostname # configure terminal
Set the number of attachments:
hostname (config) # eml attachment limit countwhere count is the number of attachments to analyze for each
.emlfile. The default value is 5; the range of values is 0-20.Set the maximum recursive depth of the
.emlfile:hostname (config) # eml recursive limit countwhere count is the maximum recursive depth of the
.emlfile to be analyzed. The default value is 3. The range of values is 0-3.Verify the configuration:
hostname (config) # show eml EML attachments limit: 5 EML extraction recursive limit: 3
Changing the Time-To-Live for Local Signature Rules
You can change the default behavior and time-to-live (TTL) value for locally generated signature rules.
The default behavior for local generated signature rules is:
If the rule receives no hit within 24 hours from the time it was generated, then the rule expires after 24 hours.
If the rule receives a hit within 24 hours, then its TTL is extended for another 24 hours.
NOTE: This functionality applies to only local feed FireEye appliances. A local feed is a system-generated feed that is managed by the CM Series appliance and not a third-party feed or a DTI cloud feed.
The CM Series appliance controls the TTL settings for managed appliances.
The standalone appliance controls the TTL value for local signature rules.
To automatically extend local signature rules:
Go to CLI configuration mode.
hostname > enable hostname # configure terminalConfigure the local signature TTL rule to automatically extend for local signature rules.
Release 9.0Changing the Time-To-Live for Local Signature Rules
hostname (config) # localsig ttl auto-extend enable
Save your changes.
hostname (config)# write memory
To change the TTL value for local signature rules:
Go to CLI configuration mode.
hostname > enablehostname # configure terminalChange the local signature TTL rule value to 100 hours.
hostname (config) # localsig ttl hours 100Save your changes.
hostname (config)# write memory
Microsoft Office 365 Integration
Microsoft Office 365 integration on the File Protect appliance provides cloud-based portals for OneDrive and SharePoint Online secure file creation, file storage, and file collaboration.
Users can log on to their OneDrive and SharePoint Online business accounts and create, edit, and share files across their organization.
All files stored on the File Protect appliance are scanned and files classified as malicious are moved into quarantine folders.
Follow these instructions to register and get authorization for a Microsoft Office 365 app:
Registering an App
Configuring Application Permissions for a Microsoft Office 365 App
Configuring App Communication and Authorization
Configuring App Communication Using the CLI
Authorizing and Connecting Your App Using the CLI
or
Configuring App Communication and Authorization Using the Web UI
Follow these instructions to configure Microsoft Office OneDrive:
Microsoft OneDrive Integration
Follow these instructions to configure Microsoft Office SharePoint Online:
Microsoft SharePoint Online Integration
Follow these instructions to configure a proxy connection with the cloud services:
Configuring a Proxy Connection to Cloud Services
Registering an App
On the File Protect appliance, the admin creates a Microsoft Office 365 app and registers it for an Azure AD v2.0 endpoint through the Microsoft App Registration Portal.
During app registration, the following unique properties are generated and used to authenticate with Azure AD for access tokens:
An application ID
A secret password
A redirect URL

NOTE: Just one app instance is created to initiate integration on the File Protect appliance.
For more information about Microsoft Application registration, go to Register Your App With Azure AD v2.0.
Prerequisites:
Administrator or Operator access to the File Protect appliance.
A Microsoft account for the File Protect appliance administrator.
A connection to the File Protect appliance.
To register an app:
Go to the Microsoft Application Registration Portal from a Web browser.
Sign in using a Microsoft account for the File Protect appliance administrator.
Find App registrations and click + New registration.
Enter the name for the app.
Under Supported account types, select Accounts in this organizational directory only.
Under Redirect URI, enter the platform location that the Azure AD v2.0 endpoint calls for authentication responses.
Click Register. A message confirms the creation of the app and the Overview page appears.
In the Overview page, copy the Application (client) ID for use during app authorization.
After you register your app, you must configure certain settings in the Overview page.
To configure app settings:
Setting | Instructions |
|---|---|
Certificates | Under Manage, select Certificates & secrets.
IMPORTANT: The secret key is used to authorize app communication in the File Protect Web UI. After the dialog closes, you cannot return to retrieve the password. |
API | The OneDrive and Sharepoint apps use application permissions. Application permissions are provisioned by the File Protect admin.
|

Configuring Application Permissions for a Microsoft Office 365 App
To configure application permissions on the Microsoft Application Registration Portal:
In the API permissions page, click + Add a permission.
Select the Microsoft Graph API.
Select Application permissions.
Select permissions that give explicit authorization to access resources on behalf of the resource owner. For example, you as admin can authorize permission to read user application files but not read calendars.
Select the following permissions:
Files.Read.All
Files.ReadWrite.All
Sites.Read.All
Sites.ReadWrite.All
User.Read.All
User.ReadWrite.All
Click Add permissions.
In the API permissions page, click Grant admin consent for the permissions added.
When prompted, select Yes to grant consent for requested permissions.
A message appears affirming the successful granting of requested permissions.
Configuring App Communication Using the CLI
After you create and register your app, you must configure the app to communicate with either OneDrive or Sharepoint using the property values that were generated from the registration process.
Prerequisites
Administrator or Operator access to the File Protect appliance.
A connection to the File Protect appliance.
App property values: application ID, secret password, and redirect URL.
To configure the app using the CLI:
Enable the CLI configuration mode:
hostname > enable hostname # configure terminalEnter your Office 365 app ID.
hostname (config) # fmps o365 config app-id <MicrosoftOfficeAppID>Enter your Office 365 secret password.
hostname (config) # fmps o365 config secret <MicrosoftOfficeSecretPassword>Enter your Office 365 redirect URL.
hostname (config) # fmps o365 config redirect-url <MicrosoftOfficeRedirectURL>View your Office 365 configuration. Below is an example of a OneDrive configuration.
hostname (config) # show fmps o365OneDrive Configuration:
App ID: 49b9606f-50dd-4ee1-b080-70e10cb855d0
Secret: ********
Redirect URL: https://www.fireeye.com
Is Configured: Yes
Tenant ID: 0abd131d-43f7-4689-8be9-6a89e1f8d117
IS Connected: Yes
If your app is not connected, make sure that you have established the prerequisites and configured your app ID, secret, and redirect URL.
Save your changes.
hostname (config) # write memoryAuthorizing and Connecting Your App Using the CLI
To authorize and connect your app on the File Protect appliance using the CLI:
Enable the CLI configuration mode:
hostname > enable hostname # configure terminalGenerate an app admin consent authorization and paste the URL generated from the authorize command into a Web browser. Copy the tenant ID value for Step 3.
hostname (config) # fmps o365 authorizePaste the following URL in your browser and approve the app's access. Copy the value of 'tenant=' and use with cli: fmps o365 cvonnect tenant-id* https://login.microsoftonline.com/common/adminconsent?redirect_ uri=https%3A%2F%2F Fwww.fireeye.com&client_id=49b9606f-50dd-4ee1-b080-70e10cb855d0
Below is a sample of an admin consent containing a tenant retrieved from the redirect URL in the Web browser.

Get access token for API communication for tenant-id retrieved from Step 2.
hostname (config)# fmps o365 connect tenant-id <MicrosoftOfficeTenantID>Save your changes.
hostname (config) # write memory
Configuring App Communication and Authorization Using the Web UI
After you create and register your app, you must configure the app to communicate with either OneDrive or Sharepoint using the property values that were generated from the registration process. In the File Protect Web UI, you can set authorization on this settings page.
Prerequisites
Administrator or Operator access to the File Protect appliance.
A connection to the File Protect appliance.
App property values: application ID, secret password, and redirect URL.
To configure the app using the Web UI:
Log in to the File Protect appliance Web UI.
Go to the Settings > Storage page.
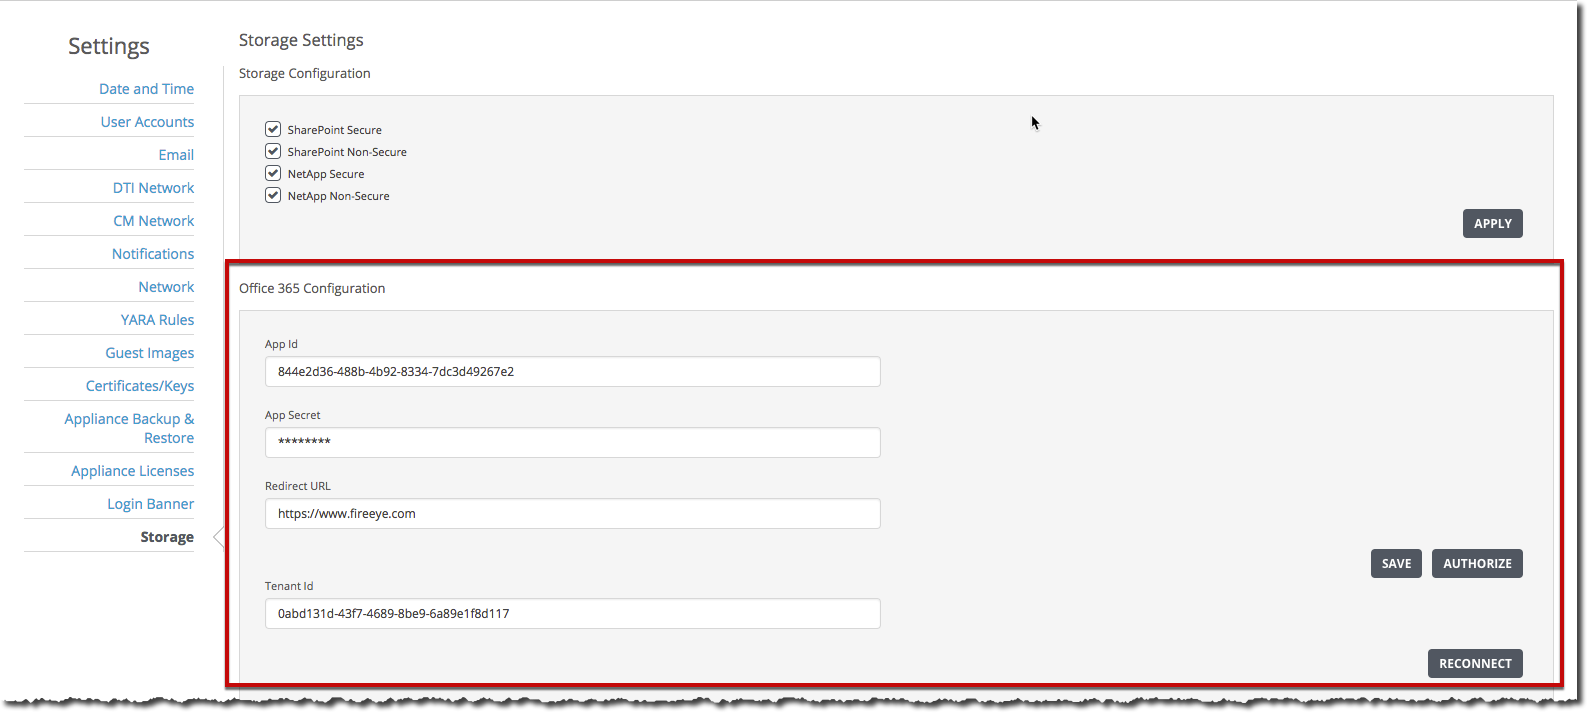
In the Office 365 Configuration section, enter the app property values for the following:
App ID
App Secret
Redirect URL
Click Save, then Authorize.
IMPORTANT: If you are not authorized and authenticated to connect your app, you will be asked to complete registration before you are allowed to continue.

Enter the tenant ID app property value.
Click Connect.
Microsoft OneDrive Integration
Microsoft OneDrive for Business is secure file storage in the Microsoft 365 cloud for an organization. It allows users to log in to their accounts using their business credentials and connect to all their files, and edit and share them. Local file changes made on all devices are automatically synced so that others can access them securely.
OneDrive is configured on the File Protect appliance using the Web UI and the CLI.
Feature Requirements
Microsoft OneDrive integration requires:
The File Protect appliance is running software release 8.2.0 or later.
The latest security content and latest guest images are installed.
You have Administrator or Operator access to the appliance CLI and Web UI.
You are familiar with OneDrive file storage management for an organization.
You have explicit access to OneDrive storage files for an organization.
IMPORTANT: After an upgrade to File Protect 8.2.1, the existing OneDrive configuration is preserved but the administrator must reauthorize and reconnect the OneDrive app before OneDrive storage scans can be resumed. See Authorizing and Connecting Your App Using the CLI or Configuring App Communication and Authorization Using the Web UI on the previous page for information.
Task List for Microsoft OneDrive Integration
To integrate Microsoft OneDrive for your File Protect appliance, you need to complete these tasks in the following order:
Registering an App
Configuring Application Permissions for a Microsoft Office 365 App
Configuring App Communication Using the CLI
Authorizing and Connecting Your App Using the CLI
Creating OneDrive Storage.
Creating OneDrive Storage Using the CLI
Creating OneDrive Storage Using the Web UI
Configuring a OneDrive Scan
Configuring a OneDrive Scan Using the Web UI
Configuring a OneDrive Scan Using the CLI
OneDrive Storage
OneDrive storage is a Microsoft file storage in the cloud from which the File Protect appliance admin can perform malware analysis, scans, and view and manage results.
OneDrive file storage can be created on the File Protect appliance using the Web UI or CLI.
Prerequisites
Administrator access to the File Protect appliance.
Configure your app to communicate with OneDrive.
Connect the File Protect appliance to Microsoft Office 365.
You can create OneDrive storage using the File Protect Web UI or CLI.
Creating OneDrive Storage Using the Web UI
To create OneDrive storage using the Web UI:
Log in to the File Protect appliance Web UI.
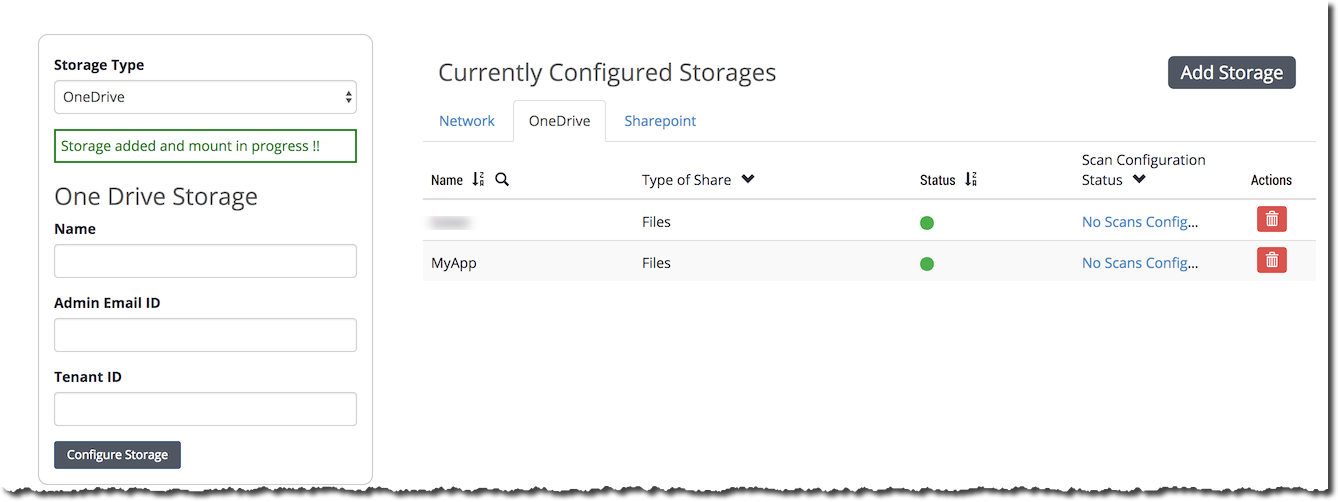
Click the Storage tab. All configured shares are displayed in the Currently Configured Storages section.
Click the Office 365 tab.
Click Add Storage.
Select Office 365 for Storage Type.
Select Microsoft OneDrive for Application Type.
Enter the Name and Admin Email ID for OneDrive Storage.
If your scans are configured to use the local_QF as a quarantine folder, then all malicious files will be sent to the aAdmin email address that you enter in this step.
Click Configure Storage.
Configured storage is displayed in the Currently Configured Storages section. The icon in the Status column is yellow while the storage is being added, and turns green after it is added successfully.
Creating OneDrive Storage Using the CLI
To create OneDrive storage for the File Protect appliance using the CLI:
Enable the CLI configuration mode:
hostname > enable hostname # configure terminalGenerate OneDrive admin consent authorization and paste the URL generated from the authorize command into a Web browser. Copy the tenant ID value for Step 3.
hostname (config) # fmps o365 authorizePaste the following URL in your browser and approve the app's access. Copy the value of 'tenant=' and use with cli: fmps o365 cvonnect tenant-id*
https://login.microsoftonline.com/common/adminconsent?redirect_uri=https%3A%2F%2Fwww.fireeye.com&client_id=49b9606f-50dd-4ee1-b080-70e10cb855d0Below is a sample of an admin consent containing a tenant= property value retrieved from the redirect URL in the Web browser.

Get an access token for API communication for the tenant ID retrieved from Step 2.
hostname (config)# fmps o365 connect tenant-id <OneDriveTenantID>Enter a unique name for the OneDrive storage and the OneDrive quarantine folder location.
hostname (config) # fmps storage create o365 name <OneDriveStorageName> app onedrive email <AdminEmail>OneDrivestorage connected successfully.
View your OneDrive storage configuration.
hostname (config) # show fmps storage name MyOneDriveStorage Storage type: o365Name: MyOneDriveStorage App: onedrive Quarantine Email: admin@fireeye.com Status: Office 365 configured and connectedSave your changes.
hostname (config) # write memory
Deleting Microsoft Office 365 Storage
To delete Microsoft Office 365 OneDrive or SharePoint Online storage using the CLI:
Enable the CLI configuration mode.
hostname > enable hostname # configure terminalView all configured storage.
hostname # show fmps storage all Storage type: o365 Name: MySharePointStorage Share Type: Source App: sharepoint Quarantine Site: quarantine_site Status: Office 365 configured and connected
Name: MyOneDriveStorage
Share Type: Source
App: onedrive
Quarantine Email: admin@acme.com
Status: Office 365 configured and connected
Specify the storage to delete. In this example, MyOneDriveStorage is deleted.
hostnmae (config) # fmps storage delete name MyOneDriveStorage
Storage operation completed successfullyVerify former configured storage was deleted.
hostnmae (config) # show fmps storage MyOneDriveStorage
hostnmae (config) #hostnmae (config) # show fmps storage all
Storage type: o365
Name: MySharePointStorage
Share Type: Source
App: sharepoint
Quarantine Site: quarantine_site
Status: Office 365 configured and connectedSave your changes.
hostnmae (config) # write memoryTo delete a Microsoft Office 365 OneDrive or SharePoint Online storage using the Web UI:
Log in to the File Protect appliance Web UI.
Click the Storage tab. All configured shares are displayed in the Currently Configured Storages section.
Click the Office 365 tab.
Click the
 icon in the Actions column.

When prompted, confirm that you want to delete the storage.
OneDrive Scans
After you have created OneDrive storage, you can scan the storage for malicious files.
OneDrive supports only a continuous scan. The File Protect appliance checks OneDrive for new file changes every three minutes. The changed files are analyzed by the MVX analysis engine and malicious files are quarantined either locally on the admin OneDrive (local_QF) or on a designated quarantine share (CIFS or NFS).
You can perform OneDrive Scans using the Web UI or the CLI.
Prerequisites
Administrator access to the File Protect appliance.
A OneDrive storage has been created and configured.
Configuring a OneDrive Scan Using the Web UI
You can configure a OneDrive scan using the Scan Wizard in the Web UI.
 To navigate through the wizard steps, use Next and Previous or click the target step button.
To configure a scan on the appliance:
Log in to the File Protect appliance Web UI.
Go to the Scans tab.
Click Configured & Recent Scans.
Click Configure a Scan.
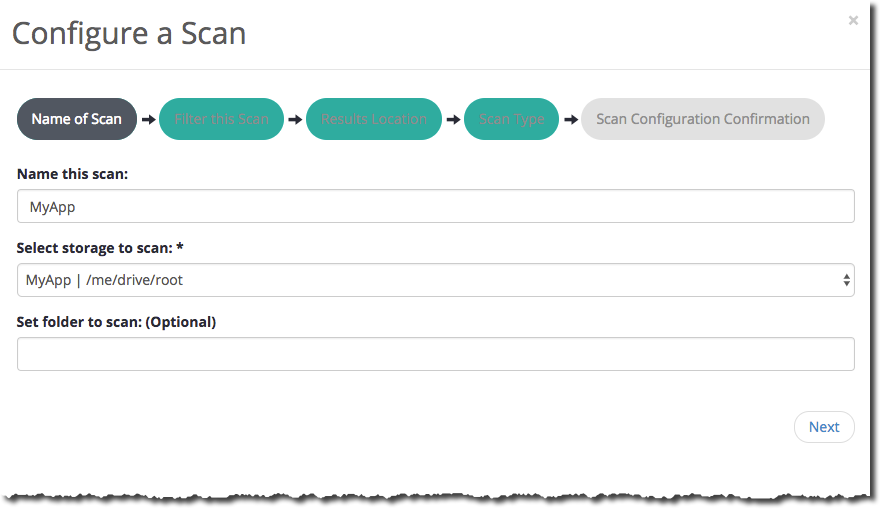
Scan Settings
Field | Description |
|---|---|
Name | (Optional) Name of scan. The name does not have to be unique. |
Select storage to scan | A OneDrive storage to scan. Each option includes the storage name, server, name or IP address, and share name. |
Set folder to scan: | (Optional) To scan only a specific folder and its subfolders, enter the folder name. The default scan is all folders on OneDrive. |
Click Next to continue to control the scope of the scan and set up filters, scan the results location, and the scan type, and then view a summary of your scan configuration parameters. See Filters, Results Folders, and Types.
Below is an example of the continuous scan configuration for MyOneDriveStorage.

To start a scan:
Click the Scans tab.
The Scans page shows the tools for managing scans.
Click the Start Scan button in the Status and Actions column.
The confirmation dialog box shows the OK button.
Click OK to confirm that you want the scan to start.
Other scan actions include restarting, pausing, resuming, and aborting scans. See Managing Scans Using the Web UI.
Configuring a OneDrive Scan Using the CLI
Configure and start a continuous OneDrive scan using the CLI.
Prerequisites
Administrator access to the File Protect appliance.
A OneDrive storage.
To configure a scan for OneDrive storage:
Enable the CLI configuration mode:
hostname > enable hostname # configure terminalCreate a OneDrive scan.
hostname (config) # fmps scan create from share <MyOneDriveStorage>MyOneDriveStorage is the OneDrive storage on which the scan will run.
The scan ID is displayed.
<scanID> configuredSave your changes.
hostname (config) # write memory
To start a scan from an existing scan:
Enable the CLI configuration mode:
hostname > enable hostname # configure terminalStart a OneDrive continuous scan from an existing scan.
hostname (config) # fmps scan start <scanID> continuous<scanID> is the ID of the existing scan.
Save your changes.
hostname (config) # write memory
Microsoft SharePoint Online Integration
Microsoft SharePoint Online for Business is a browser-based collaboration and document management platform that provides secure file storage and file sharing in the Microsoft 365 cloud for an organization. Similar to OneDrive for Business, SharePoint Online users can log on to their accounts using their business credentials and connect to all their files, edit, and share them. The primary benefit of SharePoint Online is that it is a collaboration tool. Users can create various Web services and then upload them to a SharePoint Online team location.
Local changes made on all devices are automatically synced so that others can access them securely.
Microsoft SharePoint Online is configured on the File Protect appliance using the Web UI and the CLI.
Feature Requirements
Microsoft SharePoint Online integration requires:
The File Protect appliance is running software release 8.2.1 or later.
The latest security content and latest guest images are installed.
You have Administrator or Operator access to the appliance CLI and Web UI.
You are familiar with SharePoint Online file storage management for an organization.
You have explicit access to SharePoint Online storage files for an organization.
IMPORTANT: After an upgrade to File Protect 8.2.1, the existing SharePoint Online configuration is preserved but the administrator must reauthorize and reconnect the OneDrive Online app before SharePoint Online storage scans can be resumed.
Task List for Microsoft SharePoint Online Integration
To integrate SharePoint Online for your File Protect appliance, you need to complete these tasks in the following order:
Registering an App
Configuring Application Permissions for a Microsoft Office 365 App
Configuring App Communication Using the CLI
Authorizing and Connecting Your App Using the CLI
Creating SharePoint Online Storage.
Creating SharePoint Online Storage Using the CLI
Creating SharePoint Online Storage Using the Web UI
Configuring a SharePoint Online Scan.
Configuring a SharePoint Online Scan Using the CLI
Configuring a SharePoint Online Scan Using the Web UI
SharePoint Online Storage
SharePoint Online storage is a Microsoft file storage and collaborate file sharing portal in the cloud from which the File Protect appliance admin can perform malware analysis, scans, and view and manage results.
SharePoint Online file storage can be created on the File Protect appliance using the Web UI or CLI.
Prerequisites
Administrator access to the File Protect appliance.
Configure your app to communicate with SharePoint Online.
Connect the File Protect appliance to Microsoft Office 365.
You can create SharePoint Online storage using the File Protect Web UI or CLI.
Creating SharePoint Online Storage Using the CLI on the facing page
Creating SharePoint Online Storage Using the Web UI
To create a SharePoint Online storage using the Web UI:
Log in to the File Protect appliance Web UI.
Click the Storage tab. All configured shares are displayed in the Currently Configured Storages section.
Click the Office 365 tab.
Click Add Storage.
Select Office 365 for Storage Type.
Select Microsoft SharePoint for Application Type.
Enter the Name and Admin Email ID for SharePoint Online Storage.
Click Configure Storage.
Configured storage is displayed in the Currently Configured Storages section. The icon in the Status column is yellow while the storage is being added, and turns
green after it is added successfully.
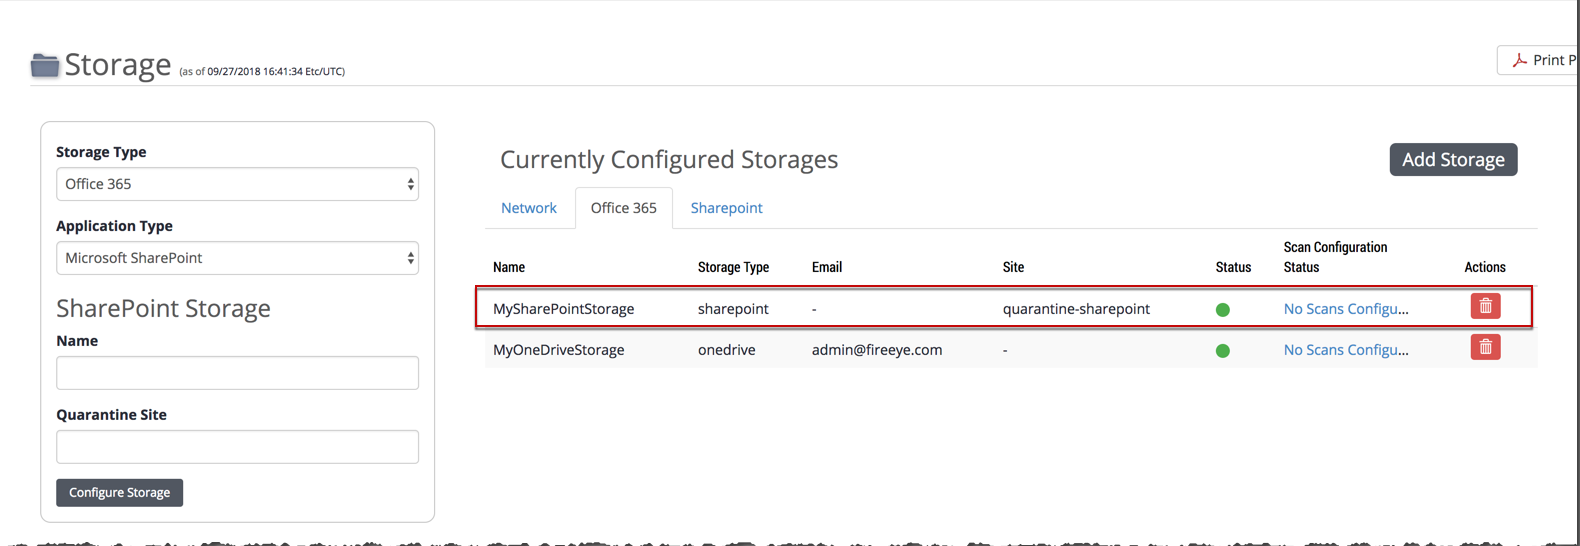
Creating SharePoint Online Storage Using the CLI
To create SharePoint Online storage on the File Protect appliance using the CLI:
Enable the CLI configuration mode:
hostname > enable hostname # configure terminalEnter a unique name for the SharePoint Online storage and the SharePoint Online quarantine folder location.
hostname (config) # fmps storage create o365 name <SharePointStorageName> app sharepoint site <SharePointSiteName>SharePoint Online storage connected successfully.
View your SharePoint Online storage configuration.
hostname (config) # show fmps storage name MySharePointStorageStorage type: o365 Name: MySharePointStorage Type: sharepoint Quarantine Site: SharePoint-Quarantine Status: Office 365 configured and connectedSave your changes.
hostname (config) # write memory
Deleting Microsoft Office 365 Storage
To delete Microsoft Office 365 OneDrive or SharePoint Online storage using the CLI:
Enable the CLI configuration mode.
hostname > enable hostname # configure terminalView all configured storage.
hostname # show fmps storage allStorage type: o365 Name: MySharePointStorage Share Type: Source App: sharepoint Quarantine Site: quarantine_site Status: Office 365 configured and connectedName: MyOneDriveStorage Share Type: Source App: onedrive Quarantine Email: admin@acme.com Status: Office 365 configured and connectedSpecify the storage to delete. In this example, MyOneDriveStorage is deleted.
hostnmae (config) # fmps storage delete name MyOneDriveStorage Storage operation completed successfullyVerify former configured storage was deleted.
hostname (config) # show fmps storage MyOneDriveStorage hostname (config) #hostname (config) # show fmps storage allStorage type: o365 Name: MySharePointStorage Share Type: Source App: sharepoint Quarantine Site: quarantine_site Status: Office 365 configured and connectedSave your changes.
hostname (config) # write memory
To delete a Microsoft Office 365 OneDrive or SharePoint Online storage using the Web UI:
Log in to the File Protect appliance Web UI.
Click the Storage tab. All configured shares are displayed in the Currently Configured Storages section.
Click the Office 365 tab.
Click the
 icon in the Actions column.
5. When prompted, confirm that you want to delete the storage.

SharePoint Online Scans
After you have created SharePoint Online storage, you can scan the storage for malicious files.
For optimal results during scans, FireEye recommends that you configure scan filters and scan results folders as described in Filters, Results Folders, and Types .
SharePoint Online supports only a continuous scan. The File Protect appliance checks SharePoint Online for new file changes every three minutes. The changed files are analyzed by the MVX analysis engine and malicious files are quarantined either locally on the admin SharePoint Online (local_QF) or on a designated quarantine share (CIFS or NFS).
You can perform SharePoint Online Scans using the Web UI or the CLI.
Prerequisites
Administrator access to the File Protect appliance.
A SharePoint Online storage has been created and configured.
Configuring a SharePoint Online Scan Using the Web UI
You can configure a SharePoint Online scan using the Scan Wizard in the Web UI.
To navigate through the wizard steps, use Next and Previous or click the target step button.
To configure a scan on the appliance:
Log in to the File Protect appliance Web UI.
Go to the Scans tab.
Click Configured & Recent Scans.
Click Configure a Scan.
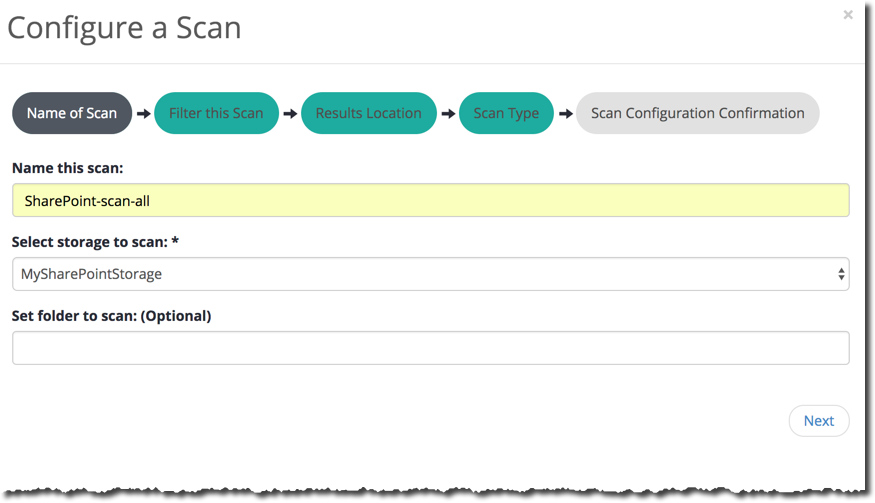
Scan Settings
Field | Description |
|---|---|
Name | (Optional) Name of scan. The name does not have to be unique. |
Select storage to scan | A SharePoint Online storage to scan. Each option includes the storage name, server, name or IP address, and share name. |
Set folder to scan: | (Optional) To scan only a specific folder and its subfolders, enter the folder name. The default scan is all folders on SharePoint Online. |
5. Click Next to continue to control the scope of the scan and set up filters, the results location, and the scan type, and then view a summary of your scan configuration parameters. See Filters, Results Folders, and Types.
6. Below is an example of the continuous scan configuration and results for MySharePointStorage.

To start a scan:
Click the Scans tab.
The Scans page shows the tools for managing scans.
Click the Start Scan button in the Status and Actions column.
The confirmation dialog box shows the OK button.
Click OK to confirm that you want the scan to start.
Other scan actions include restarting, pausing, resuming, and aborting scans. See Managing Scans Using the Web UI.
Configuring a SharePoint Online Scan Using the CLI
Configure and start a continuous SharePoint Online scan using the CLI.
Prerequisites
Administrator access to the File Protect appliance.
A SharePoint Online storage.
To configure a scan for SharePoint Online storage:
Enable the CLI configuration mode:
hostname > enable hostname # configure terminalCreate a SharePoint Online scan.
hostname (config) # fmps scan create from share <MySharePointStorge>MySharePointStorge is the SharePoint Online storage on which the scan will run.
Confirmation is displayed.
<scanID> configuredSave your changes.
hostname (config) # write memory
To start a scan from an existing scan:
Enable the CLI configuration mode:
hostname > enable hostname # configure terminalStart a SharePoint Online continuous scan from an existing scan.
hostname (config) # fmps scan start <scanID> continuous<scanID> is the ID of the existing scan.
Save your changes.
hostname (config) # write memory
Configuring a Proxy Connection to Cloud Services
You can use a fully qualified domain name (FQDN) proxy address when you connect your File Protect appliance to a third-party cloud storage service. This proxy address provides a layer of security when connecting your appliance to the cloud. You can use the proxy connection with Microsoft OneDrive and AWS S3 servers.
Configure the following specifications related to the proxy connection.
FQDN—The fully qualified domain name (IP address) of the proxy connection.
Port—The port number used for the proxy connection.
Username—The name of the user authorizing the proxy connection. This is an optional entry.
Password—The password of the user authorizing the proxy connection. This is an optional entry.
After you configure the proxy connection, you need to enable the connection. You can disable it when it is not needed.
Use the CLI commands specified in these sections to configure and enable the proxy connection.
Configuring a Proxy Connection Using the CLI
Use the commands in this section to configure a proxy connection using the CLI.
Prerequisites
An established connection between the File Protect appliance and the Internet.
Administrator or Operator access to the File Protect appliance.
To configure a proxy configuration:
Enable the CLI configuration mode:
hostname > enable hostname # configure terminal
Specify the FQDN IP Address:
hostname (config) # fmps proxy fqdn <IPAddress>Specify the port number:
hostname (config) # fmps proxy port <PortNumber>Specify the username:
hostname (config) # fmps proxy username <UserName>Specify the password:
hostname (config) # fmps proxy password <Password>Verify the values:
hostname (config) # show fmps proxy
Example
This example sets the FQDN and port number for the proxy connection and displays the result.
hostname (config) # fmps proxy fqdn 1.2.3.4
hostname (config) # fmps proxy port 80
hostname (config) # show fmps proxyProxy Config:
Enabled : no
FQDN : 1.2.3.4
Port : 80
Username :
Password : ********Enabling or Disabling the Proxy Connection to Cloud Storage Using the CLI
Use the commands in this procedure to enable or disable the proxy connection configured on your File Protect appliance to connect to cloud storage.
Prerequisites
An established connection between the File Protect appliance and the Internet.
Administrator or Operator access to the File Protect appliance.
To enable the proxy connection:
Go to CLI configuration mode.
hostname > enable hostname # configure terminalEnable the proxy connection.
hostname (config) # fmps proxy enable3. Verify your configuration.
hostname (config) # show fmps proxy
Proxy Config:
Enabled : yes
FQDN : 1.2.3.4
Port : 80
Username :
Password : ********To disable the proxy connection:
Go to CLI configuration mode.
hostname > enable hostname # configure terminalDisable the proxy connection.
hostname (config) # no fmps proxy enableVerify your configuration.
hostname (config) # show fmps proxy Proxy Config: Enabled : no FQDN : 1.2.3.4 Port : 80 Username : Password : ********
Amazon S3 Integration
Amazon Simple Storage Service (Amazon S3) integration on the File Protect appliance secures the files stored on the cloud storage platform. The File Protect appliance scans files in the Amazon S3 storage for malware. The files marked as malicious are quarantined. You can configure the location to quarantine these files.
In Amazon S3 storage, files are stored in buckets. File Protect creates a queue using Amazon Simple Queue Service (SQS) to scan buckets. A bucket to be scanned will send notifications to the queue created when a file is added or modified in the storage server. The appliance periodically queries the queue. It retrieves notifications and downloads files to scan. If a file is found to be malicious, it is moved to the quarantine location.
Perform the following steps to use the Amazon S3 Integration feature:
Task | Instructions |
|---|---|
1. Configure credentials to connect to an Amazon S3 Storage. | See Authenticating the Connection to an Amazon S3 Storage |
2. Add and edit the connected Amazon S3 Storage buckets. | See Managing Amazon S3 Storage |
3. Scan the configured Amazon S3 storages. | See Scanning Amazon S3 Storage |
Authenticating the Connection to an Amazon S3 Storage
To integrate File Protect with Amazon S3, authenticate the connection with the access credentials set up on the storage.

NOTE: The credentials are set by the storage administrator in the host platform - Amazon S3. Enter these credentials in the File Protect Web UI or CLI to connect to Amazon S3 before you scan a storage.
Amazon S3 creates a user specific to the File Protect appliance in its host. The storage administrator runs the Cloud Formation configuration file on the host. This file contains an access key and secret key. The File Protect appliance has access to S3 and SQS services after the authentication with these keys.
NOTE: A storage administrator can download the template of the Cloud Formation JSON file from the File Protect Web UI or from your company's public Amazon S3 bucket. Along with the credentials, this file has the configurations that define the File Protect appliance's interaction with the storage buckets.
You can verify the status of the connection to an Amazon S3 storage on the Status column found on the Storage menu of the File Protect Web UI.
NOTE: If there are no Amazon S3 storages available on the Storage menu, you can add a storage to verify your connection. Refer to Adding an Amazon S3 Storage.
Authenticate the connection between the File Protect and the Amazon S3 storage using the Web UI or CLI.
Adding File Protect User Credentials in the CLI on the facing page
Adding File Protect User Credentials in the Web UI
NOTE: The Access Key and Secret Access Key are set in the Amazon S3 storage host. You can obtain these values from the storage administrator who has the permission to set these keys in the host platform.
To configure the File Protect user details in the Web UI:
Log in to the File Protect appliance Web UI.
Click the Settings tab.
Click Storage on the side bar.
In the AWS Configuration section, enter the Access Key ID.
Enter the Secret Access Key.
Click Save to apply the changes.
Adding File Protect User Credentials in the CLI
To configure the File Protect user details in the CLI:
Enable the CLI configuration mode:
hostname > enable hostname # configure terminalEnter the access ID key.
hostname (config) # fmps aws config access-id <AccessIDKey>Enter the secret key.
hostname (config) # fmps aws config secret <SecretKey>Save your changes.
hostname (config) # write memory
NOTE: The Access Key and Secret Access Key are set in the Amazon S3 storage host. The storage administrator has the permission to set these keys in the host platform.
Managing Amazon S3 Storage
You can add, delete and edit Amazon S3 storages in the File Protect appliance. You can perform these actions in the Web UI or the CLI.
Follow the steps below to manage Amazon S3 storages:
Task | Instructions |
|---|---|
1. Add Amazon S3 storages and configure the details of the storage. | |
2. Edit the connected Amazon S3 storage details. | |
3. Delete a configured Amazon S3 storage if it is not required. |
Adding an Amazon S3 Storage
You can add Amazon S3 storages to scan from the Storage menu in the File Protect Web UI and in the File Protect CLI.
A Simple Queue Service (SQS) queue is created with the storage, bucket, queue, and region details you specify. The same queue is used for any subsequent Amazon S3 storage added.
In Amazon S3, each storage is specific to a single bucket. A new storage in the File Protect can correspond only with a bucket that has not added yet.
Follow the topics below to add an Amazon S3 storage:
Adding an Amazon S3 Storage in the CLI on the facing page
Adding an Amazon S3 Storage in the Web UI
To create an Amazon S3 storage using the Web UI:
Log in to the File Protect appliance Web UI.
Click the Storage tab. All configured shares are displayed in the Currently Configured Storages section.
Click Add Storage.
Select AWS for Storage Type.
Click Download CloudFormation Template to download a template JSON file if the storage administrator is yet to set the Cloud Formation configuration.
NOTE: The Cloud Formation Template contains the format in which the configuration and authentication details are specified. You can download this file to share it with the storage administrator if it is not yet run. The administrator runs this file with authentication keys in the platform to set it. To enter these credentials in the File Protect appliance, refer Authenticating the Connection to an Amazon S3 Storage.
Enter the Storage Name of the Amazon S3 storage.
Select S3 for App.
Enter the Bucket Name. This signifies the bucket to scan.
Enter the Queue Name. This signifies the SQS queue.
Enter the Region of the Amazon storage bucket.
Select the Type of Share.
Click Configure Storage.
The storage is displayed in the Currently Configured Storages section. The icon in the Status column is yellow while the storage is being added, and turns green after it is added successfully.
Adding an Amazon S3 Storage in the CLI
To create an Amazon S3 storage on the File Protect appliance using the CLI:
Enable the CLI configuration mode:
hostname > enable hostname # configure terminalEnter a unique name for the Amazon S3 storage along with the bucket, queue and region of the storage.
hostname (config) # fmps storage create aws name <AmazonS3StorageName> app s3 bucket <BucketName> queue <QueueName> region <RegionName>AWS storage connected successfully.
View your Amazon S3 storage configuration.
hostname (config) # show fmps storage name <AmazonS3StorageName> Storage type: aws Name: <AmazonS3StorageName> Share Type: Source App: s3 Status: AWS configured and connected Bucket Name: <BucketName> Queue Name: <QueueName> Region: <RegionName>Save your changes.
hostname (config) # write memory
Deleting an Amazon S3 Storage
To delete an Amazon S3 storage using the CLI:
Enable the CLI configuration mode.
hostname > enable hostname # configure terminalView all configured storage.
hostname # show fmps storage all Storage type: aws
Name: MyAWSStorage
Share Type: Source
App: s3
Status: AWS configured and connect
Bucket Name: aws-bucket-name
Queue Name: aws-queue-name
Region: aws-region-nameStorage type: o365
Name: MySharePointStorage
Share Type: Source
App: sharepoint
Quarantine Site: quarantine_site
Status: Office 365 configured and connectedSpecify the storage to delete. In this example, MyAWSStorage is deleted.
hostname (config) # fmps storage delete name MyAWSStorage Storage operation completed successfullyVerify that the former configured storage was deleted.
hostname (config) # show fmps storage name MyAWSStorage hostname (config) #hostname (config) # show fmps storage all Storage type: o365 Name: MySharePointStorage Share Type: Source App: sharepoint Quarantine Site: quarantine_site Status: Office 365 configured and connectedSave your changes.
hostname (config) # write memory
To delete an Amazon S3 storage using the Web UI:
Log in to the File Protect appliance Web UI.
Click the Storage tab. All configured shares are displayed in the Currently Configured Storages section.
Click the AWS tab.
Click the
 icon in the Actions column.
When prompted, confirm that you want to delete the storage.
Editing an Amazon S3 Storage
You can edit the Bucket, Queue, and Region of an existing Amazon S3 storage in the File Protect appliance.
To edit an Amazon S3 storage using the Web UI:
90 © 2021 FireEye
Release 9.0
Scanning Amazon S3 Storage
Log in to the File Protect appliance Web UI.
Click the Storage tab. All configured shares are displayed in the Currently Configured Storages section.
Click the AWS tab.
Click the
 icon in the Actions column.
Edit the Bucket Name, Queue Name, and Region fields as required.
Click Edit AWS Storage to save your changes.
Scanning Amazon S3 Storage
After you have created an Amazon S3 storage, you can scan it for malicious files.
Use the File Protect appliance to create, configure, and run scans on Amazon S3 storages. You can configure filters to scans and scan results to optimize scanning.
NOTE: Amazon S3 supports only a listen scan.
The File Protect appliance creates a queue using the Amazon SQS (Simple Queue System) when a scan is configured on a particular bucket. The bucket sends notifications to the SQS queue when a file is created or modified. The File Protect appliance checks the queues periodically. It downloads files for listen scans based on changes made. If a file is found to be malicious, it will be quarantined.
NOTE: If there are no Amazon S3 storages available on the Storage menu, you can add a storage to verify your connection. Refer to Adding an Amazon S3 Storage
You can perform Amazon S3 storage scans using the Web UI or the CLI.
Prerequisites
Administrator access to the File Protect appliance.
An Amazon S3 storage has been created and configured.
Scanning Amazon S3 Storage in the Web UI
You can configure a Amazon S3 scan using the Scan Wizard in the Web UI.

To navigate through the wizard steps, use Next and Previous or click the target step button.
To configure a scan on the appliance:
Log in to the File Protect appliance Web UI.
Go to the Scans tab.
Click Configured & Recent Scans.
Click Configure a Scan.
Enter the scan configuration details specified below.
Scan Settings
Field | Description |
|---|---|
Name | (Optional) Name of scan. The name does not have to be unique. |
Select storage to scan | An Amazon S3 storage to scan. Each option includes the storage name, server, name or IP address, and share name. |
Set folder to scan: | (Optional) To scan only a specific folder and its subfolders, enter the folder name. The default scan is all folders. |
Click Next to continue to control the scope of the scan and set up filters, the scan results location, and the scan type, and then view a summary of your scan configuration parameters. See Filters, Results Folders, and Types.
Click Save Scan to save the scan for later, or click Start Scan Now to run the scan.
To start a scan:
Click the Scans tab.
The Scans page shows the tools for managing scans.
Click the Start Scan button in the Status and Actions column.
Click OK to confirm that you want the scan to start.
Scanning Amazon S3 Storage in the CLI
Configure and start an Amazon S3 storage listen scan using the CLI.
Prerequisites
Administrator access to the File Protect appliance.
An Amazon S3 storage.
To create a scan for Amazon S3 storage:
Enable the CLI configuration mode:
hostname > enable hostname # configure terminalCreate an Amazon S3 listen scan.
hostname (config) # fmps scan create from share <MyAmazonS3Storage>MyAmazonS3Storage is the storage on which the scan will run.
The scan is created and a scan ID is displayed <scanID> configured.
Save your changes.
hostname (config) # write memory
To configure an Amazon S3 scan:
Enable the CLI configuration mode:
hostname > enable hostname # configure terminalConfigure the scan name:
hostname (config) # fmps scan configure <scanId> scan-name <ScanName>Configure the filetype to scan:
hostname (config) # fmps scan configure <scanId> filetypes <FileType>
Configure the start from time:
hostname (config) # fmps scan configure <scanId> start-time
<StartFromTime>Configure the list of subdirectories to scan :
hostname (config) # fmps scan configure <scanId> subdirectories
<ListOfSubdirectories>Configure the target repositories:
hostname (config) # fmps scan configure <scanId> target-shares
<ListOfTargets>Save your changes.
hostname (config) # write memory
To start a scan:
Enable the CLI configuration mode:
hostname > enable
hostname # configure terminalStart a scan by specifying its scan ID.
hostname (config) # fmps scan start <scanID> listen<scanID> is the ID of the scan.
Save your changes.
hostname (config) # write memory
Event Notifications
This section describes the commands for configuring event notifications. Event notifications inform you when malware objects (file attachments with a malicious executable payload) are detected so that you can protect the security of your network.
FireEye threat prevention platforms notify you of events by any combination of the following methods:
Email—Notifications are sent by email to one or more addresses using Simple Mail Transfer Protocol (SMTP).
HTTP—Notifications are posted to one or more Web servers.
Rsyslog—Notifications are sent to one or more remote syslog servers.
SNMP—Notifications are sent to one or more Simple Network Management Protocol (SNMP) servers.
You can specify the notification format (such as XML, JSON, or text) and the level of detail for each notification method.
Note: System email notifications are covered in the File Protect System Administration Guide.
Configuring Event Notifications Using the Web UI
Prerequisites
The File Protect appliance must have an established connection to the Internet.
You must have Admin or Operator access to the File Protect appliance.
Configuring Event Notifications
Use the Notification Settings page to configure event notifications.
To configure event notifications:
Click the Settings tab.
Click the Notifications on the side bar.
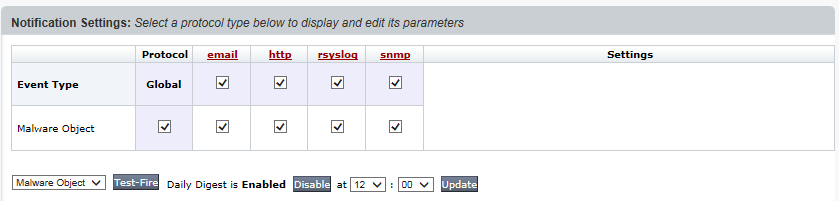
In the Global column, select Malware Object.
Selections in the Global column ensure notifications are sent for this event type. This selection does not affect the display of events in the Web UI.
Select the appropriate protocols in the Global row or Malware Object row.
To configure each selected protocol, click the applicable column heading:
Click Test-Fire to send a test notification to verify your settings for all enabled protocols. Recipients are specified in the Email Settings page. See the File Protect System Administration Guide for details.
To turn off daily digest notifications for all enabled protocols, click Disable. To turn on daily digest notifications, click Enable.
FireEye recommends using Per Event notifications instead of Daily Digest notifications.

To change the time for the daily notification, specify the hour and minutes in the drop-down list box.
To apply your notification settings, click Update.
Configuring Email Notifications Using the Web UI
Use the Notifications Settings page to select who is sent email notifications when malware objects are detected.
Prerequisites
The File Protect appliance must have an established connection to the Internet.
You must have Admin or Operator access to the File Protect appliance.
Configuring SMTP Settings
To configure the SMTP settings, perform the following subtasks:
Specify the SMTP server
Set the default SMTP notification settings
To specify which SMTP server to use:
On the Web UI, select the Settings tab.
Select Notifications on the side bar.
Click the email column heading to display the SMTP Settings area in the Settings column.
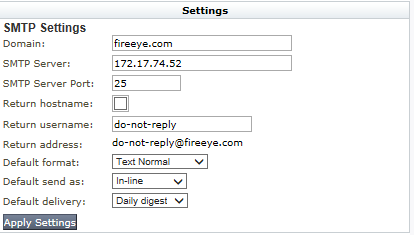
Enter the SMTP server that is used for mail delivery in the SMTP Server box.
Enter the SMTP server port that is used for mail delivery in the SMTP Server Port box.
To apply the SMTP settings, click Apply Settings.
Note: If you do not click Apply Settings, your changes are lost.
To configure the default settings for SMTP notifications:
On the Web UI, select the Settings tab.
Select Notifications on the side bar.
Click the email column heading to display the SMTP Settings area in the Settings column.
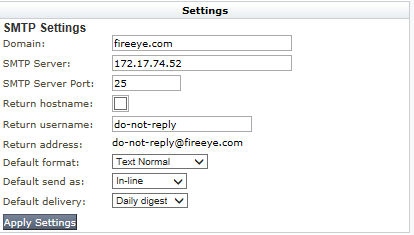
Enter the domain that is used for email in the Domain box.
(Optional) Select the Return hostname checkbox to use the local domain name. Clear this checkbox to use the value in the Return Username box and the value in the Domain box.
Enter the user who is specified as the “from” user in the Return username box.
Verify that the value in the Return address box is correct. If it is not, change the values in the Domain box and the Return username box.
Select XML, JSON, or Text as the default format and select which level of detail is provided in the Default format drop-down list box:
Normal—This format contains detailed information and abstracts, such as alert type, ID, source IP, malware name, hostname, and alert URL without redundant information
Concise—This format contains basic information, such as alert type, ID, source IP, malware name, hostname, and alert URL.
Extended—This format contains detailed information and abstracts, including data-theft information (if any) and static-analysis details. This format provides all details about files and objects modified during analysis.
Select whether to send the notification as an inline message or an attachment in the Default send as drop-down list box.
Select the delivery frequency in the Default delivery drop-down list box:
[IMAGE PLACEHOLDER: Blue circular clipboard icon with a document graphic indicating a recommendation]
FireEye recommends using Per Event notifications.
Per Event—Send a notification each time a malware object is detected.
Daily Digest—Send a daily notification of all malware objects detected the past 24 hours in the selected format and level of detail (default is Concise).
To apply the SMTP settings, click Apply Settings.
[IMAGE PLACEHOLDER: Blue circular clipboard icon with a document graphic indicating an important note]
If you do not click Apply Settings, your changes are lost.
Setting Up the SMTP Recipients
To set up the SMTP recipients, perform the following subtasks:
Add the SMTP recipients
Configure the SMTP recipient listing for email notifications
To add an SMTP recipient:
On the Web UI, select the Settings tab.
Select Notifications on the side bar.
Click the email column heading to display the SMTP Recipient Listing area.
Enter the name of the person to receive the email notification in the Name box and click Add SMTP Recipient. For example, name@company.com.
Select the Enabled checkbox to choose which recipients receive email notifications. Select the Enable All checkbox to ensure that all of the listed recipients receive email notifications.

6. Enter the email address to receive the notification in the Email Address box.
7. To apply the SMTP recipient listing changes, click Update.
To configure the SMTP recipient listing for email notifications:
On the Web UI, select the Settings tab.
Select Notifications on the side bar.
Click the email column heading to display the SMTP Recipient Listing area.
4. Select XML, JSON, or Text as the email notification format and select which level of detail is provided in the Format drop-down list box. Select Default to use the format specified in the Default format box in the SMTP Settings area.
Normal—This format contains detailed information and abstracts, such as alert type, ID, source IP, malware name, hostname, and alert URL without redundant information
Concise—This format contains basic information, such as alert type, ID, source IP, malware name, hostname, and alert URL.
Extended—This format contains detailed information and abstracts, including data-theft information (if any) and static-analysis details. This format provides all details about files and objects modified during analysis.
5. Select whether to send the notification as an inline message or an attachment in the Send as drop-down list box. Select Default to use the method specified in the Default send as box in the SMTP Settings area.
6. Select Malware Object or All Events in the Notification drop-down list box to be notified when malware objects are detected.
Select the delivery frequency in the Delivery drop-down list box:
Note: FireEye recommends selecting Per Event notifications.
Per Event—Send a notification each time a malware object is detected.
Daily Digest—Send a daily notification of all malware objects detected the past 24 hours in the selected format and level of details (default is Concise).
To apply the SMTP recipient listing changes, click Update.
Configuring HTTP Notifications Using the Web UI
Use the Notification Settings page to post HTTP notifications to one or more Web servers.
Prerequisites
The File Protect appliance must have an established connection to the Internet.
You must have Admin or Operator access to the File Protect appliance.
Configuring HTTP Settings
Use the HTTP Settings area to set up the default configuration for HTTP notifications.
To configure HTTP settings:
On the Web UI, select the Settings tab.
Select Notifications on the side bar.
Click the http column heading to display the HTTP Settings area in the Settings column.
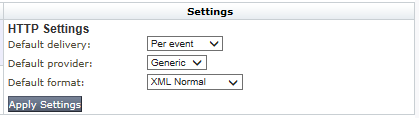
Select the delivery frequency in the Default delivery drop-down list box:

FireEye recommends using Per Event notifications.
Per Event—Send a notification each time a malware object is detected.
Daily Digest—Send a daily notification of all malware objects detected the past 24 hours in the selected format and level of details (default is Concise).
Select a service provider in the Default provider drop-down list box. The default service provider is Generic.
Select XML, JSON, or Text as the default format and select which level of detail is provided in the Default format drop-down list box:
Normal—This format contains detailed information and abstracts, such as alert type, ID, source IP, malware name, hostname, and alert URL without redundant information
Concise—This format contains basic information, such as alert type, ID, source IP, malware name, hostname, and alert URL.
Extended—This format contains detailed information and abstracts, including data-theft information (if any) and static-analysis details. This format provides all details about files and objects modified during analysis.
To apply the HTTP settings, click Apply Settings.
Note: If you do not click Apply Settings, your changes are lost.
Setting Up HTTP Servers
To set up HTTP servers, perform the following subtasks:
Add the HTTP servers
Configure the HTTP server listing
To add an HTTP server:
On the Web UI, select the Settings tab.
Select Notifications on the side bar.
Click the http column heading to display the HTTP Server Listing area.
Enter the name of the HTTP server that will post the notification (for example, AX5400) in the Name box and click Add HTTP Server.
HTTP Server Listing Add HTTP Server: Name:
5. Select the Enabled checkbox to choose which servers will post HTTP notifications. Select the Enable All checkbox to ensure that all listed servers post HTTP notifications.

6. Enter the URL of the server to post the HTTP notification in the Server URL box.
7. To apply the HTTP server listing changes, click Update.
To configure the HTTP server listing:
On the Web UI, select the Settings tab.
Select Notifications on the side bar.
Click the http column heading to display the HTTP Server Listing area.

(Optional) If authentication is required for the server, select the Auth checkbox, enter the user name for HTTP authentication in the Username box, and enter the password for HTTP authentication in the Password box.
Select Malware Object or All Events in the Notification drop-down list box to post HTTP notifications when malware objects are detected.
Select the delivery frequency in the Delivery drop-down list box:

FireEye recommends using Per Event notifications.
Default—Use the delivery frequency specified in the Default delivery box in the HTTP Settings area.
Per Event—Send a notification each time a malware object is detected.
Daily Digest—Send a daily notification of all malware objects detected the past 24 hours in the selected format and level of details (default is Concise).
(Optional) If you want to use SSL for notifications, select the SSL Enable checkbox and the SSL Verify checkbox.
Select a service provider in the Default provider drop-down list box. The default service provider is Generic.
FireEye recommends using the generic service provider.
Select XML, JSON, or Text as the notification format and select which level of detail is provided in the Message Format drop-down list box. Select Default to use the format specified in the Default format box in the HTTP Settings area.
Normal—This format contains detailed information and abstracts, such as alert type, ID, source IP, malware name, hostname, and alert URL without redundant information
Concise—This format contains basic information, such as alert type, ID, source IP, malware name, hostname, and alert URL.
Extended—This format contains detailed information and abstracts, including data-theft information (if any) and static-analysis details. This format provides all details about files and objects modified during analysis.
To apply the HTTP server listing changes, click Update.
Configuring Rsyslog Notifications Using the Web UI
Use the Notification Settings page to send notifications to one or more remote syslog servers.
Prerequisites
The File Protect appliance must have an established connection to the Internet.
You must have Admin or Operator access to the File Protect appliance.
Configuring Rsyslog Settings
Use the Rsyslog Settings area to set up the default configuration for rsyslog notifications.
To configure rsyslog notifications:
On the Web UI, select the Settings tab.
Select Notifications on the side bar.
Click the rsyslog column heading to display the Rsyslog Settings area in the Settings column.
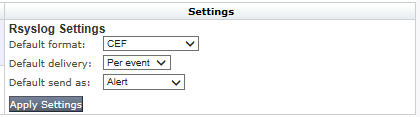
Select Common Event Format (CEF), Log Event Enhanced Format (LEEF), Comma-Separated Values (CSV), XML, JSON, or Text as the default format and select which level of detail (only for XML, JSON, or text) is provided in the Default format drop-down list box:
Normal—This format contains detailed information and abstracts, such as alert type, ID, source IP, malware name, hostname, and alert URL without redundant information.
Concise—This format contains basic information, such as alert type, ID, source IP, malware name, hostname, and alert URL.
Extended—This format contains detailed information and abstracts, including data-theft information (if any) and static-analysis details. This format provides all details about files and objects modified during analysis.
Select the default severity classification for the rsyslog notification:
Alert—Action must be taken immediately (severity 1).
Critical—Critical conditions (severity 2).
Debug—Debug-level messages (severity 7).
Emergency—Emergency: system is unusable (severity 0).
Error—Error conditions (severity 3).
Informational—Informational messages (severity 6).
Notice—Normal but significant conditions (severity 5).
Warning—Warning conditions (severity 4).
6. To apply the rsyslog settings, click Apply Settings.
If you do not click Apply Settings, your changes are lost.
Setting Up Rsyslog Servers
To set up rsyslog servers, perform the following subtasks:
Add the rsyslog servers
Configure the rsyslog servers
To add an rsyslog server:
On the Web UI, select the Settings tab.
Select Notifications on the side bar.
Click the rsyslog column heading to display the Rsyslog Server Listing area.
Enter the name of the rsyslog server to receive the notifications (for example, AX5400) in the Name box and click Add Rsyslog Server.
5. Select the Enabled checkbox to choose which servers will receive rsyslog notifications. Select the Enable All checkbox to ensure that all listed servers receive rsyslog notifications.

Enter the IP address of the rsyslog server in the IP Address box.
To apply the rsyslog server listing changes, click Update.
To configure the rsyslog servers:
On the Web UI, select the Settings tab.
Select Notifications on the side bar.
106 © 2021 FireEye
Click the rsyslog column heading to display the Rsyslog Server Listing area.

Select the delivery frequency in the Delivery drop-down list box:
Default—Use the delivery frequency specified in the Default delivery box in the Rsyslog Settings area.
Per Event—Send a notification each time a malware object is detected.
Select Malware Object or All Events in the Notification drop-down list box to send rsyslog notifications when malware objects are detected.
Select CEF, LEEF, CSV, XML, JSON, or Text as the default format and select which level of detail (only for XML, JSON, or text) is provided in the Format drop-down list box. Select Default to use the format specified in the Default format box in the Rsyslog Settings area.
Normal—This format contains detailed information and abstracts, such as alert type, ID, source IP, malware name, hostname, and alert URL without redundant information.
Concise—This format contains basic information, such as alert type, ID, source IP, malware name, hostname, and alert URL.
Extended—This format contains detailed information and abstracts, including data-theft information (if any) and static-analysis details. This format provides all details about files and objects modified during analysis.
Select the severity classification for the rsyslog notification in the Send as box:
Default—Use the value specified in the Default send as field in the Rsyslog Settings area.
Alert—Action must be taken immediately (severity 1).
Critical—Critical conditions (severity 2).
Debug—Debug-level messages (severity 7).
Emergency—Emergency: system is unusable (severity 0).
Error—Error conditions (severity 3).
Informational—Informational messages (severity 6).
Notice—Normal but significant conditions (severity 5).
Warning—Warning conditions (severity 4).
Select UDP or TCP in the Protocol drop-down list box.
To apply the rsyslog server listing changes, click Update.
Configuring SNMP Notifications Using the Web UI
SNMP notifications are not management information notifications. For more information about management information notifications, refer to the “Network Administration” section of the File Protect System Administration Guide.
Use the Notification Settings page to send notifications to one or more Simple Network Management Protocol (SNMP) servers.
Prerequisites
The File Protect appliance must have an established connection to the Internet.
You must have Admin or Operator access to the File Protect appliance.
Configuring SNMP Settings
Use the SNMP Settings area to set up the default configuration for SNMP notifications.
To configure SNMP notifications:
On the Web UI, select the Settings tab.
Select Notifications on the side bar.
Click the snmp column heading to display the SNMP Settings area in the Settings column.
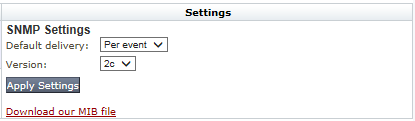
Select the SNMP version (1 or 2c) to use for the notification in the Version drop-down list box.
If you need the MIB file, click Download our MIB file. If you are prompted for confirmation, click Save.
To apply the SNMP settings, click Apply Settings.

If you do not click Apply Settings, your changes are lost.
Setting Up SNMP Servers
To set up the SNMP servers, perform the following subtasks:
Add the SNMP servers
Configure the SNMP servers
To add an SNMP server:
On the Web UI, select the Settings tab.
Select Notifications on the side bar.
Click the snmp column heading to display the SNMP Trap Sink Listing area.
Enter the name of the SNMP server to receive the notifications (for example, AX5400) in the Name box and click Add SNMP Trap Sink.

Select the Enabled checkbox to choose which servers will receive SNMP notifications. Select the Enable All checkbox to ensure that all listed servers receive SNMP notifications.
Enter the IP address of the SNMP server in the IP Address box.
To apply the SNMP server listing changes, click Update.
To configure the SNMP servers:
On the Web UI, select the Settings tab.
Select Notifications on the side bar.
Click the snmp column heading to display the SNMP Trap Sink Listing area.

Enter the SNMP community string in the Community box.
Select the SNMP version (1 or 2c) to use for the notification in the Version drop-down list box. Select Default to use the version specified in the Version field in the SNMP Settings area.
Select the delivery frequency in the Delivery drop-down list box:
Default—Use the delivery frequency specified in the Default delivery box in the SNMP Settings area.
Per Event—Send a notification each time a malware object occurs.
Select Malware Object or All Events in the Notification drop-down list box to send SNMP notifications when malware objects are detected.
To apply the SNMP server listing changes, click Update.
Configuring Event Notifications Using the CLI
Prerequisites
The File Protect appliance must have an established connection to the Internet.
You must have Admin or Operator access to the File Protect appliance.
Configuring Event Notifications
Use the CLI commands in this topic to configure event notifications.
To configure event notifications using the CLI:
Enable the CLI configuration mode:
hostname > enable hostname # configure terminalCheck which protocols are already enabled:
hostname (config) # show fenotify email hostname (config) # show fenotify http hostname (config) # show fenotify rsyslog hostname (config) # show fenotify snmpConfigure the protocols that you want to use:
Confirm that the protocols are configured correctly:
hostname (config) # show fenotify email hostname (config) # show fenotify http hostname (config) # show fenotify rsyslog hostname (config) # show fenotify snmpEnable the notifications. By default, notifications are enabled. This command only affects notifications for enabled protocols. If a protocol has been disabled, you must enable the protocol before enabling notifications.
hostname (config) # fenotify enableSend a test email message to all enabled recipients:
hostname (config) # fenotify email send-testSave the configuration:
hostname (config) # write memory
Configuring Email Notifications Using the CLI
Use the CLI commands in this section to select who is notified by email when malware objects are detected.
Prerequisites
The File Protect appliance must have an established connection to the Internet.
You must have Admin or Operator access to the File Protect appliance.
If the email notifications are not being received, check that the following items are specified:
Mail port used to send the email notifications (mailhub port port-number)
Mail relay address used to send the email notifications (mailhub address ip_address)
Email notification recipient (recipient rname)
Mail relay address used to send the email notifications (recipient rname email-address email_addresss)
Configuring SMTP Settings
To configure the SMTP settings, perform the following subtasks:
Specify the SMTP server
Set the default SMTP notification settings
To specify which SMTP server to use:
Enable the CLI configuration mode:
hostname > enable hostname # configure terminalEnable email notifications:
hostname (config) # fenotify email enableSet the mail relay address used to send the email notifications:
hostname (config) # fenotify email mailhub address ip_addressSet the mail port used to send the email notifications.
hostname (config) # fenotify email mailhub port port-numberSave the configuration:
hostname (config) # write memory
To configure the default settings for SMTP notifications:
Enable the CLI configuration mode:
hostname > enable hostname # configure terminalEnable email notifications:
hostname (config) # fenotify email enableSet the domain from which emails appear to come:
hostname (config) # fenotify email domain email-domain(Optional) To include the hostname in the return address for email notifications:
hostname (config) # fenotify email return host-name host_nameSet the user name in the return address for email notifications (the default is do-not-reply):
hostname (config) # fenotify email return user-name user_name
6. Select one of the XML, JavaScript Object Notation (JSON), or Text options for the default format of the notification:

The json_legacy-concise, json_legacy-extended, and json_legacy-normal formats are deprecated.
To send notifications in XML Concise format containing basic information such as alert type, ID, source IP, malware name, hostname, and alert URL, enter:
hostname (config) # fenotify email default format xml-conciseTo send notifications in XML Extended format containing detailed information and abstracts including data-theft information (if any) and static-analysis details (XML Extended provides all details about files and objects modified during analysis.), enter:
hostname (config) # fenotify email default format xml-extendedTo send notifications in XML Normal format containing detailed information and abstracts such as alert type, ID, source IP, malware name, hostname, and alert URL without any redundant information, enter:
hostname (config) # fenotify email default format xml-normalTo send notifications in JSON Concise format containing basic information such as alert type, ID, source IP, malware name, hostname, and alert URL, enter:
hostname (config) # fenotify email default format json-conciseTo send notifications in JSON Extended format containing detailed information and abstracts including data-theft information (if any) and static-analysis details (JSON Extended provides all details about files and objects modified during analysis.), enter:
hostname (config) # fenotify email default format json-extendedTo send notifications in JSON Normal format containing detailed information and abstracts such as alert type, ID, source IP, malware name, hostname, and alert URL without any redundant information, enter:
hostname (config) # fenotify email default format json-normalTo send notifications in Text Concise format containing basic information such as alert type, ID, source IP, malware name, hostname, and alert URL, enter:
hostname (config) # fenotify email default format text-conciseTo send notifications in Text Extended format containing detailed information and abstracts including data-theft information (if any) and static-analysis details (Text Extended provides all details about files and objects modified during analysis.), enter:
hostname (config) # fenotify email default format text-extendedTo send notifications in Text Normal format containing detailed information and abstracts such as alert type, ID, source IP, malware name, hostname, and alert URL without any redundant information, enter:
hostname (config) # fenotify email default format text-normal
alert URL without any redundant information, enter:
hostname (config) # fenotify email default format text-normalSpecify how the notification is delivered by default:
To deliver the notification as an email attachment, enter:
hostname (config) # notify email default send-as attachmentTo deliver the notification in the email body (the default), enter:
hostname (config) # notify email default send-as in-line
Specify the default delivery schedule for email notifications:

FireEye recommends using per-event notifications.
To receive information about all events detected in the past 24 hours, enter:
hostname (config) # notify email default delivery daily-digestTo receive information about each event, sent when the event is triggered, enter:
hostname (config) # notify email default delivery per-event
Save the configuration:
hostname (config) # write memory
Setting Up the SMTP Recipients
To set up the SMTP recipients, perform the following subtasks:
Add the SMTP recipients
Configure the SMTP recipient listing for email notifications
To add an SMTP recipient:
Enable the CLI configuration mode:
hostname > enable hostname # configure terminalEnable email notifications:
hostname (config) # fenotify email enableAdd a recipient for email notifications:
hostname (config) # fenotify email recipient rnameSelect a recipient to receive email notifications (one recipient per command):
hostname (config) # fenotify email recipient rname enableSpecify the email address for a recipient who will receive email notifications:
hostname (config) # fenotify email recipient rname email-address email1_addressSave the configuration:
hostname (config) # write memory
To configure the SMTP recipient listing for email notifications:
Enable the CLI configuration mode:
hostname > enable hostname # configure terminalEnable email notifications:
hostname (config) # fenotify email enable
3. Select one of the XML, JavaScript Object Notation (JSON), or Text options for the format of the notifications received by a specified recipient:

The json_legacy-concise, json_legacy-extended, and json_legacy-normal formats are deprecated.
To send notifications in XML Concise format containing basic information such as alert type, ID, source IP, malware name, hostname, and alert URL, enter:
hostname (config) # fenotify email recipient rname prefer message
format xml-conciseTo send notifications in XML Extended format containing detailed information and abstracts including data-theft information (if any) and static-analysis details (XML Extended provides all details about files and objects modified during analysis.), enter:
hostname (config) # fenotify email recipient rname prefer message
format xml-extendedTo send notifications in XML Normal format containing detailed information and abstracts such as alert type, ID, source IP, malware name, hostname, and alert URL without any redundant information, enter:
hostname (config) # fenotify email recipient rname prefer message
format xml-normalTo send notifications in JSON Concise format containing basic information such as alert type, ID, source IP, malware name, hostname, and alert URL, enter:
hostname (config) # fenotify email recipient rname prefer message
format json-conciseTo send notifications in JSON Extended format containing detailed information and abstracts including data-theft information (if any) and static-analysis details (JSON Extended provides all details about files and objects modified during analysis.), enter:
hostname (config) # fenotify email recipient rname prefer message
format json-extendedTo send notifications in JSON Normal format containing detailed information and abstracts such as alert type, ID, source IP, malware name, hostname, and alert URL without any redundant information, enter:
hostname (config) # fenotify email recipient rname prefer message
format json-normalTo send notifications in Text Concise format containing basic information such as alert type, ID, source IP, malware name, hostname, and alert URL, enter:
hostname (config) # fenotify email recipient rname prefer message
format text-conciseTo send notifications in Text Extended format containing detailed information and abstracts including data-theft information (if any) and static-analysis details (Text Extended provides all details about files and objects modified during analysis.), enter:
hostname (config) # fenotify email recipient rname prefer message format text-extendedTo send notifications in Text Normal format containing detailed information and abstracts such as alert type, ID, source IP, malware name, hostname, and alert URL without any redundant information, enter:
hostname (config) # fenotify email recipient rname prefer message format text-normal
Specify how email notifications are delivered to the specified recipient:
To deliver the notification as an email attachment, enter:
hostname (config) # fenotify email recipient rname prefer message send-as attachmentTo deliver the notification in the email body (the default), enter:
hostname (config) # fenotify email recipient rname prefer message send-as in-line
Specify the delivery schedule for email notifications to a specific recipient:

FireEye recommends using per-event notifications.
To receive information about all malware objects detected in the past 24 hours, enter:
hostname (config) # fenotify email recipient rname prefer message delivery daily-digestTo send a notification each time a malware object is detected, sent when the event is triggered, enter:
hostname (config) # fenotify email recipient rname prefer message delivery per-event
Save the configuration:
hostname (config) # write memory
Configuring HTTP Notifications Using the CLI
Use the CLI commands in this section to post HTTP notifications to one or more Web servers.
Prerequisites
The File Protect appliance must have an established connection to the Internet.
You must have Admin or Operator access to the File Protect appliance.
© 2021 FireEye
Configuring HTTP Settings
Use the CLI commands in this topic to set up the default configuration for HTTP notifications.
To configure HTTP settings:
Enable the CLI configuration mode:
hostname > enable hostname # configure terminalEnable HTTP notifications:
hostname (config) # fenotify http enableSpecify the default delivery schedule for HTTP notifications:

FireEye recommends using per-event notifications.
To send a daily notification of all malware objects detected the past 24 hours in the selected format and level of details (default is Concise), enter:
hostname (config) # fenotify http default delivery daily-digestTo send a notification each time a malware object is detected, enter:
hostname (config) # fenotify http default delivery per-event
Specify the default service provider. The default service provider is generic.
FireEye recommends using the generic service provider.
To select Aruba as the provider, enter:
hostname (config) # fenotify http default provider arubaTo select the generic provider, enter:
hostname (config) # fenotify http default provider generic
Release 9.0 — Configuring Event Notifications Using the CLI
5. Select one of the XML, JavaScript Object Notation (JSON), or Text options for the default format of the notification where service_name is the name of the HTTP server that posts the notification:

The json_legacy-concise, json_legacy-extended, and json_legacy-normal formats are deprecated.
To post notifications in JSON Concise format containing basic information such as alert type, ID, source IP, malware name, hostname, and alert URL, enter:
hostname (config) # fenotify http service service_name provider generic message format json-conciseTo post notifications in JSON Extended format containing detailed information and abstracts including data-theft information (if any) and static-analysis details (JSON Extended provides all details about files and objects modified during analysis.), enter:
hostname (config) # fenotify http service service_name provider generic message format json-extendedTo post notifications in JSON Normal format containing detailed information and abstracts such as alert type, ID, source IP, malware name, hostname, and alert URL without any redundant information, enter:
hostname (config) # fenotify http service service_name provider generic message format json-normalTo post notifications in Text Concise format containing basic information such as alert type, ID, source IP, malware name, hostname, and alert URL, enter:
hostname (config) # fenotify http service service_name provider generic message format text-conciseTo post notifications in Text Extended format containing detailed information and abstracts including data-theft information (if any) and static-analysis details (Text Extended provides all details about files and objects modified during analysis.), enter:
hostname (config) # fenotify http service service_name provider generic message format text-extendedTo post notifications in Text Normal format containing detailed information and abstracts such as alert type, ID, source IP, malware name, hostname, and alert URL without any redundant information, enter:
hostname (config) # fenotify http service service_name provider generic message format text-normalTo post notifications in XML Concise format containing basic information such as alert type, ID, source IP, malware name, hostname, and alert URL, enter:
hostname (config) # fenotify http service service_name provider generic message format xml-concise
To post notifications in XML Extended format containing detailed information and abstracts including data-theft information (if any) and static-analysis details (XML Extended provides all details about files and objects modified during analysis.), enter:
hostname (config) # fenotify http service service_name provider generic message format xml-extendedTo post notifications in XML Normal format containing detailed information and abstracts such as alert type, ID, source IP, malware name, hostname, and alert URL without any redundant information, enter:
hostname (config) # fenotify http service service_name provider generic message format xml-normal
6. Select one of the XML, JavaScript Object Notation (JSON), or Text options for the default format of the notification where service_name is the name of the HTTP server that posts the notification:
The
json_legacy-concise,json_legacy-extended, andjson_legacy-normalformats are deprecated.
To post notifications in XML Concise format containing basic information such as alert type, ID, source IP, malware name, hostname, and alert URL, enter:
hostname (config) # fenotify http service service_name provider generic message format xml-conciseTo post notifications in XML Extended format containing detailed information and abstracts including data-theft information (if any) and static-analysis details (XML Extended provides all details about files and objects modified during analysis.), enter:
hostname (config) # fenotify http service service_name provider generic message format xml-extendedTo post notifications in XML Normal format containing detailed information and abstracts such as alert type, ID, source IP, malware name, hostname, and alert URL without any redundant information, enter:
hostname (config) # fenotify http service service_name provider generic message format xml-normalTo post notifications in JSON Concise format containing basic information such as alert type, ID, source IP, malware name, hostname, and alert URL, enter:
hostname (config) # fenotify http service service_name provider generic message format json-conciseTo post notifications in JSON Extended format containing detailed information and abstracts including data-theft information (if any) and static-analysis details (JSON Extended provides all details about files and objects modified during analysis.), enter:
hostname (config) # fenotify http service service_name provider generic message format json-extended
To post notifications in JSON Normal format containing detailed information and abstracts such as alert type, ID, source IP, malware name, hostname, and alert URL without any redundant information, enter:
hostname (config) # fenotify http service service_name provider generic message format json-normalTo post notifications in Text Concise format containing basic information such as alert type, ID, source IP, malware name, hostname, and alert URL, enter:
hostname (config) # fenotify http service service_name provider generic message format text-conciseTo post notifications in Text Extended format containing detailed information and abstracts including data-theft information (if any) and static-analysis details (Text Extended provides all details about files and objects modified during analysis.), enter:
hostname (config) # fenotify http service service_name provider generic message format text-extendedTo post notifications in Text Normal format containing detailed information and abstracts such as alert type, ID, source IP, malware name, hostname, and alert URL without any redundant information, enter:
hostname (config) # fenotify http service service_name provider generic message format text-normal
7. Save the configuration:
hostname (config) # write memory
Setting Up HTTP Servers
To set up HTTP servers, perform the following subtasks:
Add the HTTP servers
Configure the HTTP server listing
To add an HTTP server:
Enable the CLI configuration mode:
hostname > enablehostname # configure terminalEnable HTTP notifications:
hostname (config) # fenotify http enableSpecify the name of the HTTP server (for example, AX5400) to receive the notification. URLs and email addresses are not allowed.
hostname (config) # fenotify http service service-nameSpecify which servers will post HTTP notifications (one server per command):
hostname (config) # fenotify http service service_name enableSpecify the URL for each HTTP server to receive the notification:
hostname (config) # fenotify http service service_name server-url url
Save the configuration:
hostname (config) # write memory
To configure the HTTP server listing:
Enable the CLI configuration mode:
hostname > enablehostname # configure terminalEnable HTTP notifications:
hostname (config) # fenotify http enable(Optional) If authentication is required for the server, enable authentication and then specify the user name and password for HTTP authentication:
hostname (config) # fenotify http service service_name auth enablehostname (config) # fenotify http service service_name auth username user_namehostname (config) # fenotify http service service_name auth password passwordSpecify the delivery schedule for HTTP notifications:

FireEye recommends using per-event notifications.
To send a daily notification of all malware objects detected the past 24 hours in the selected format and level of details (default is Concise), enter:
hostname (config) # fenotify http service service_name prefer message delivery daily-digestTo send a notification each time a malware object is detected, enter:
hostname (config) # fenotify http service service_name prefer message delivery per-event
(Optional) If you want to use SSL for notifications:
hostname (config) # fenotify http service service_name ssl enablehostname (config) # fenotify http service service_name ssl verifySpecify the service provider. The default service provider is generic.
FireEye recommends using the generic service provider.
To select the currently active service provider, enter:
hostname (config) # fenotify http service service_name provider defaultTo select the generic provider, enter:
hostname (config) # fenotify http service service_name provider genericTo select Aruba as the provider, enter:
hostname (config) # fenotify http service service_name provider aruba
Select one of the XML, JavaScript Object Notation (JSON), or Text options for the format of the HTTP notifications:

The json_legacy-concise, json_legacy-extended, and json_legacy-normal formats are deprecated.
To post notifications in XML Concise format containing basic information such as alert type, ID, source IP, malware name, hostname, and alert URL, enter:
hostname (config) # fenotify http service service_name provider generic message format xml-conciseTo post notifications in XML Extended format containing detailed information and abstracts including data-theft information (if any) and static-analysis details (XML Extended provides all details about files and objects modified during analysis.), enter:
hostname (config) # fenotify http service service_name provider generic message format xml-extendedTo post notifications in XML Normal format containing detailed information and abstracts such as alert type, ID, source IP, malware name, hostname, and alert URL without any redundant information, enter:
hostname (config) # fenotify http service service_name provider generic message format xml-normalTo post notifications in JSON Concise format containing basic information such as alert type, ID, source IP, malware name, hostname, and alert URL, enter:
hostname (config) # fenotify http service service_name provider generic message format json-conciseTo post notifications in JSON Extended format containing detailed information and abstracts including data-theft information (if any) and static-analysis details (JSON Extended provides all details about files and objects modified during analysis.), enter:
hostname (config) # fenotify http service service_name provider generic message format json-extendedTo post notifications in JSON Normal format containing detailed information and abstracts such as alert type, ID, source IP, malware name, hostname, and alert URL without any redundant information, enter:
hostname (config) # fenotify http service service_name provider generic message format json-normalTo post notifications in Text Concise format containing basic information such as alert type, ID, source IP, malware name, hostname, and alert URL, enter:
hostname (config) # fenotify http service service_name provider generic message format text-concise
To post notifications in Text Extended format containing detailed information and abstracts including data-theft information (if any) and static-analysis details (Text Extended provides all details about files and objects modified during analysis.), enter:
hostname (config) # fenotify http service service_name provider generic message format text-extendedTo post notifications in Text Normal format containing detailed information and abstracts such as alert type, ID, source IP, malware name, hostname, and alert URL without any redundant information, enter:
hostname (config) # fenotify http service service_name provider generic message format text-normal
Save the configuration:
hostname (config) # write memory
Configuring Rsyslog Notifications Using the CLI
Use the CLI commands in this section to send notifications to a remote syslog server.
Prerequisites
The File Protect appliance must have an established connection to the Internet.
You must have Admin or Operator access to File Protect appliance.
Configuring Rsyslog Settings
Use the CLI commands in this topic to set up the default configuration for rsyslog notifications.
To configure rsyslog settings:
Enable the CLI configuration mode:
hostname > enable hostname # configure terminalEnable rsyslog notifications:
hostname (config) # fenotify rsyslog enable
3. Specify the default format for rsyslog notifications:

The json_legacy-concise, json_legacy-extended, and json_legacy-normal formats are deprecated.
To send notifications in the Common Export Format (CEF), enter:
hostname (config) # fenotify rsyslog default format cefTo send notifications in the comma-separated values (CSV) format, enter:
hostname (config) # fenotify rsyslog default format csvTo send notifications in the Log Extended Event Format (LEEF) (default), enter:
hostname (config) # fenotify rsyslog default format leefTo send notifications in XML Concise format containing basic information such as alert type, ID, source IP, malware name, hostname, and alert URL, enter:
hostname (config) # fenotify rsyslog default format xml-conciseTo send notifications in XML Extended format containing detailed information and abstracts including data-theft information (if any) and static-analysis details (XML Extended provides all details about files and objects modified during analysis.), enter:
hostname (config) # fenotify rsyslog default format xml-extendedTo send notifications in XML Normal format containing detailed information and abstracts such as alert type, ID, source IP, malware name, hostname, and alert URL without any redundant information, enter:
hostname (config) # fenotify rsyslog default format xml-normalTo send notifications in JSON Concise format containing basic information such as alert type, ID, source IP, malware name, hostname, and alert URL, enter:
hostname (config) # fenotify rsyslog default format json-conciseTo send notifications in JSON Extended format containing detailed information and abstracts including data-theft information (if any) and static-analysis details (JSON Extended provides all details about files and objects modified during analysis.), enter:
hostname (config) # fenotify rsyslog default format json-extendedTo send notifications in JSON Normal format containing detailed information and abstracts such as alert type, ID, source IP, malware name, hostname, and alert URL without any redundant information, enter:
hostname (config) # fenotify rsyslog default format json-normalTo send notifications in Text Concise format containing basic information such as alert type, ID, source IP, malware name, hostname, and alert URL, enter:
hostname (config) # fenotify rsyslog default format text-concise
To send notifications in Text Extended format containing detailed information and abstracts including data-theft information (if any) and static-analysis details (Text Extended provides all details about files and objects modified during analysis.), enter:
hostname (config) # fenotify rsyslog default format text-extendedTo send notifications in Text Normal format containing detailed information and abstracts such as alert type, ID, source IP, malware name, hostname, and alert URL without any redundant information, enter:
hostname (config) # fenotify rsyslog default format text-normal
Specify that a notification is sent by default each time a malware object is detected:
hostname (config) # fenotify rsyslog default delivery per-eventSpecify the default severity classification for the rsyslog notification:

FireEye recommends setting the severity classification to alert.
To indicate that action must be taken immediately (severity 1), enter:
hostname (config) # fenotify rsyslog default send-as alertTo indicate that the notification contains critical conditions (severity 2), enter:
hostname (config) # fenotify rsyslog default send-as critTo indicate that the notification contains debug-level messages (severity 7), enter:
hostname (config) # fenotify rsyslog default send-as debugTo indicate an emergency (the system is unusable) (severity 0), enter:
hostname (config) # fenotify rsyslog default send-as emergTo indicate that the notification contains error conditions (severity 3), enter:
hostname (config) # fenotify rsyslog default send-as errorTo indicate that the notification contains informational messages (severity 6), enter:
hostname (config) # fenotify rsyslog default send-as infoTo indicate normal but significant conditions (severity 5), enter:
hostname (config) # fenotify rsyslog default send-as noticeTo indicate that the notification contains warning conditions (severity 4), enter:
hostname (config) # fenotify rsyslog default send-as warning
Save the configuration:
hostname (config) # write memory
Setting Up Rsyslog Servers
To set up rsyslog servers, perform the following subtasks:
Add the rsyslog servers
Configure the rsyslog servers
To add an rsyslog server:
Enable the CLI configuration mode:
hostname > enable
hostname # configure terminalEnable rsyslog notifications:
hostname (config) # fenotify rsyslog enable
Specify the name of the rsyslog server (for example, AX5400) to receive the notification:
hostname (config) # fenotify rsyslog trap-sink sink_name
Specify which servers will receive rsyslog notifications (one server per command):
hostname (config) # fenotify rsyslog trap-sink sink_name enable
Specify the IP address or DNS address of the rsyslog server to send event logs to:
hostname (config) # fenotify rsyslog trap-sink sink_name address ip address
Save the configuration:
hostname (config) # write memory
To configure the rsyslog servers:
Enable the CLI configuration mode:
hostname > enable
hostname # configure terminalEnable rsyslog notifications:
hostname (config) # fenotify rsyslog enable
Specify that an rsyslog notification is sent each time a malware object is detected:
hostname (config) # fenotify rsyslog trap-sink sink_name prefer message delivery per-event
4. Specify the format for rsyslog notifications:

The json_legacy-concise, json_legacy-extended, and json_legacy-normal formats are deprecated.
To send notifications in the Common Export Format (CEF), enter:
hostname (config) # fenotify rsyslog trap-sink sink_name prefer message format cefTo send notifications in the comma-separated values (CSV) format, enter:
hostname (config) # fenotify rsyslog trap-sink sink_name prefer message format csvTo send notifications in the Log Extended Event Format (LEEF) (default), enter:
hostname (config) # fenotify rsyslog trap-sink sink_name prefer message format leefTo send notifications in XML Concise format containing basic information such as alert type, ID, source IP, malware name, hostname, and alert URL, enter:
hostname (config) # fenotify rsyslog trap-sink sink_name prefer message format xml-conciseTo send notifications in XML Extended format containing detailed information and abstracts including data-theft information (if any) and static-analysis details (XML Extended provides all details about files and objects modified during analysis.), enter:
hostname (config) # fenotify rsyslog trap-sink sink_name prefer message format xml-extendedTo send notifications in XML Normal format containing detailed information and abstracts such as alert type, ID, source IP, malware name, hostname, and alert URL without any redundant information, enter:
hostname (config) # fenotify rsyslog trap-sink sink_name prefer message format xml-normalTo send notifications in JSON Concise format containing basic information such as alert type, ID, source IP, malware name, hostname, and alert URL, enter:
hostname (config) # fenotify rsyslog trap-sink sink_name prefer message format json-conciseTo send notifications in JSON Extended format containing detailed information and abstracts including data-theft information (if any) and static-analysis details (JSON Extended provides all details about files and objects modified during analysis.), enter:
hostname (config) # fenotify rsyslog trap-sink sink_name prefer message format json-extended
To send notifications in JSON Normal format containing detailed information and abstracts such as alert type, ID, source IP, malware name, hostname, and alert URL without any redundant information, enter:
hostname (config) # fenotify rsyslog trap-sink sink_name prefer message format json-normalTo send notifications in Text Concise format containing basic information such as alert type, ID, source IP, malware name, hostname, and alert URL, enter:
hostname (config) # fenotify rsyslog trap-sink sink_name prefer message format text-conciseTo send notifications in Text Extended format containing detailed information and abstracts including data-theft information (if any) and static-analysis details (Text Extended provides all details about files and objects modified during analysis.), enter:
hostname (config) # fenotify rsyslog trap-sink sink_name prefer message format text-extendedTo send notifications in Text Normal format containing detailed information and abstracts such as alert type, ID, source IP, malware name, hostname, and alert URL without any redundant information, enter:
hostname (config) # fenotify rsyslog trap-sink sink_name prefer message format text-normal
5. Specify the severity classification for the rsyslog notification:

FireEye recommends setting the severity classification to a l e r t.
To indicate that action must be taken immediately (severity 1), enter:
hostname (config) # fenotify rsyslog trap-sink sink_name prefer message send-as alertTo indicate that the notification contains critical conditions (severity 2), enter:
hostname (config) # fenotify rsyslog trap-sink sink_name prefer message send-as critTo indicate that the notification contains debug-level messages (severity 7), enter:
hostname (config) # fenotify rsyslog trap-sink sink_name prefer message send-as debugTo indicate an emergency (the system is unusable) (severity 0), enter:
hostname (config) # fenotify rsyslog trap-sink sink_name prefer message send-as emergTo indicate that the notification contains error conditions (severity 3), enter:
hostname (config) # fenotify rsyslog trap-sink sink_name prefer message send-as errorTo indicate that the notification contains informational messages (severity 6), enter:
hostname (config) # fenotify rsyslog trap-sink sink_name prefer message send-as infoTo indicate normal but significant conditions (severity 5), enter:
hostname (config) # fenotify rsyslog trap-sink sink_name prefer message send-as noticeTo indicate that the notification contains warning conditions (severity 4), enter:
hostname (config) # fenotify rsyslog trap-sink sink_name prefer message send-as warning
6. Specify the protocol used to send rsyslog notifications (UDP is the default):
To select UDP, enter:
hostname (config) # fenotify rsyslog trap-sink sink_name protocol UDPTo select TCP, enter:
hostname (config) # fenotify rsyslog trap-sink sink_name protocol TCP
7. Save the configuration:
hostname (config) # write memoryConfiguring SNMP Notifications Using the CLI
SNMP notifications are not management information notifications. Refer to the “Network Administration” section of the File Protect System Administration Guide.
Configuring Event Notifications Using the CLI
Use the CLI commands in this section to send notifications to one or more Simple Network Management Protocol (SNMP) servers.
Prerequisites
The File Protect appliance must have an established connection to the Internet.
You must have Admin or Operator access to the File Protect appliance.
Configuring SNMP Settings
Use the CLI commands in this topic to set up the default configuration for SNMP notifications.
To configure SNMP settings:
Enable the CLI configuration mode:
hostname > enable hostname # configure terminalEnable SNMP notifications:
hostname (config) # fenotify snmp enableSpecify that a notification is sent by default each time a malware object is detected:
hostname (config) # fenotify snmp default delivery per-eventSpecify the SNMP version used for notifications:
To use SNMP version 1, enter:
hostname (config) # fenotify snmp default version 1To use SNMP version 2c, enter:
hostname (config) # fenotify snmp default version 2c
If you are going to download the MIB file, see the procedure for Microsoft Windows, Linux, or Apple devices. The MIB file is retrieved using a program that connects using port 22, which is normally used for tools like SSH, SCP, and PSCP. Because file-level access is denied by policy, the direct path to the MIB file needs to be specified.
Save the configuration:
hostname (config) # write memory
To download the FireEye MIB for SNMP on Windows:
Download the pscp.exe tool (available from PuTTY download page).
Navigate to a command prompt window.
Change to the directory in which you downloaded the pscp.exe tool:
cd DownloadsCopy the MIB file from the appliance:
pscp.exe -r -scp admin@<appliance_IP_address>:/usr/share/snmp/mibs \Temp\mibs\
When prompted for the password, enter admin.
The file is copied to the \Temp\mibs directory that resides on your desktop.
Change to the “mibs” directory:
cd C:\Temp\mibsLoad the MIB file into an SNMP browser or tool or open the MIB file with the following command:
FE-FIREEYE-MIB.txt
To download the FireEye MIB for SNMP on Linux:
Using the OpenSSH client, copy the MIB file from the appliance:
scp -r admin@<appliance_IP_address>:/usr/share/snmp/mibs /usr/<user_directory_name>/When prompted for the password, enter admin.
The files are copied to the “mibs” directory that resides in the /usr/user_directory_name directory.
Change to the “mibs” directory:
cd mibsLoad the MIB file into an SNMP browser or tool or open the MIB file with the following command:
vi FE-FIREEYE-MIB.txt
To download the FireEye MIB for SNMP on Mac OS X:
Navigate to the terminal emulator.
Copy the MIB file from the appliance:
scp -r admin@<appliance_IP_address>:/usr/share/snmp/mibs ~/When prompted for the password, enter admin.
The files are copied to the “mibs” directory that resides in the user directory.
Load the MIB file into an SNMP browser or tool or open the MIB file with the following command:
vi ~/mibs/FE-FIREEYE-MIB.txt
Setting Up SNMP Servers
To set up the SNMP servers, perform the following subtasks:
Add the SNMP servers
Configure the SNMP servers
To add an SNMP server:
Enable the CLI configuration mode:
hostname > enable
hostname # configure terminalEnable SNMP notifications:
hostname (config) # fenotify snmp enableSpecify the name of the SNMP server (for example, AX5400) for SNMP notifications:
hostname (config) # fenotify snmp trap-sink sink_nameSpecify which servers will receive SNMP notifications (one server per command):
hostname (config) # fenotify snmp trap-sink sink_name enableSpecify the IP address or DNS address of the SNMP server to receive the notifications:
hostname (config) # fenotify snmp trap-sink sink_name address ip addressSave the configuration:
hostname (config) # write memory
To configure the SNMP servers:
Enable the CLI configuration mode:
hostname > enable hostname # configure terminalEnable SNMP notifications:
hostname (config) # fenotify snmp enableSpecify the SNMP community string:
hostname (config) # fenotify snmp trap-sink sink_name community community_nameSpecify the SNMP version used for notifications:
To use SNMP version 1, enter:
hostname (config) # fenotify snmp trap-sink sink_name version 1To use SNMP version 2c, enter:
hostname (config) # fenotify snmp trap-sink sink_name version 2c
Specify that a notification is sent each time a malware object is detected:
hostname (config) # fenotify snmp trap-sink sink_name prefer message delivery per-eventSave the configuration:
hostname (config) # write memory
s
Appliance Service Health
The section covers the following information:
About Appliance Services
Viewing Appliance Services
Configuring Email Notifications for Appliance Services
About Appliance Services
Statistical data for appliance health services is collected, reported, and stored on the appliance. You can configure and monitor the health status of these services using CLI commands. When you are not logged in, you can be notified through email notification alerts if specific appliance services degrade or fail. You configure email notification thresholds using the CLI.
Viewing Appliance Services
Prerequisites
The File Protect appliance must have an established connection to the Internet.
You must have Admin or Operator access to the File Protect appliance.
Use the CLI commands in this procedure to view the health of
all appliance services
services in a specified category
only services in a specified category that are in critical or warning state
To view the health of all appliance services:
Go to CLI enable mode.
hostname > enable hostname # configure terminalView the health status of all appliance services.
hostname # show health allHealth Status:
Last Updated at: : 2020-01-30T11:42:00 Service: :FENET Cloud Services Health Status: :Warning Details :One or more security content uploads have failed to perform the security contents upload Service: :Disk Storage Heath Status :Healthy Details: :Healthy Service: :System Load Health Health Status :Healthy Details: :Healthy Service: :CMS Server Connectivity Health Status: :Disabled Details: :No CMS configured yet
To view the health of appliance services in a category:
hostname # show health <category>
The example displays appliance health for FEConnect services.
hostname# show health Cloud-DetectionHealth Status:
Last Updated at: : 2020-02-07T11:26:00 Service: FEConnect Health Status: Healthy Details: Healthy
To view the health status of appliance services in one category that are in critical or warning state:
hostname # show health <category> [critical | warning]
The example displays appliance health for DTI services in warning state.
Health Status:
Last Updated at: : 2020-02-07T10:55:00 Service: : FENET Cloud Services
Health Status: : Warning
Details: : One or more security content uploads have failed:
Failed to perform the security contents upload
Recovery Steps:
1. Check the fenet server connection
2. Check the fenet server username and password using CLI 'show fenet dti configuration'
3. Check proxy configuration using CLI 'show fenet'
4. Check if firewall is blocking the outbound connections
5. Call FireEye Customer Support if the failure persistsConfiguring Email Notifications for Appliance Services
You can configure email notifications so that you are informed whenever an ppliance service's health enters a critical or warning state.
By default, notifications are enabled for high-priority appliance services but you can configure notifications for any service by using the CLI.
For instance, you can have email notifications sent to you when the WSAPI service is in a warning or critical state. You can have email notifications sent daily at 14:00 (PST), and you can stop and restart notifications.
Category | Service Name | Priority |
|---|---|---|
DTI | Disk Storage | High |
Central Management Server Connectivity | High | |
System | Disk Storage | High |
System Load Health | High | |
Ethernet Interfaces | High | |
WSAPI Service | Low | |
Database Service | High |
Prerequisites
The File Protect appliance must have an established connection to the Internet.
You must have Admin or Operator access to the File Protect appliance.
Configure email recipients. For details, see the "Configuring Email Recipients" section of the Network Security System Administration Guide.
Configuring Appliance Health Service Email Notifications
Use the CLI commands in this topic to configure appliance health service email notifications.
To configure event notifications using the CLI:
Enable the CLI configuration mode:
hostname > enable hostname # configure terminalEnable email notifications about the health of an appliance service.
hostname (config) # health configuration service <service-name> notify enableConfigure the failure wait time threshold. The email notification is sent after the service has been in failed state for failed threshold number of minutes.
hostname (config) # health configuration service <service-name> notify failure-threshold <minutes>Configure the recovery time threshold. The email notification is sent after the service recovers from degraded state and stays in recovered or healthy state for recovery threshold number of minutes. This recovery threshold time prevents multiple notifications if the service changes state intermittently.
hostname (config) # health configuration service <service-name> notify recovery-threshold <minutes>Configure the time of day when the email notification is sent about the health of appliance services.
hostname (config) # health configuration digest notify daily at <hour:minute>Configure backoff time. If the service changes to a degraded state, then an email notification will not be sent until after the configured backoff time has been reached.
hostname # health configuration service <service-name> notify backoff <hours>View the configuration for appliance service email notifications.
hostname # show health configuration
Services Health Digest:
Email Notification at 12:15 (daily)
Service Health Configurations:
.
:
.
Service "CMS-Server-Connectivity" Health Configuration:
Notifications Enabled : yes
Notification Backoff Period : 24 hours
Recovery Threshold : 20 minutes
Failure Threshold : 20 minutes
Service "System-CPU-Memory-DiskIO-Health" Health Configuration:
Notifications Enabled : yes
Notification Backoff Period : 24 hours
Recovery Threshold : 5 minutes
Failure Threshold : 5 minutes
.
:
.
8. Save the configuration:
hostname (config) # write memoryStorage
Storage refers to the remote network file shares that contain the files the File Protect appliance scans for malware. The appliance can perform malware analysis scans on accessible files stored in network shares, collaboration servers, and remote hard drives.

By default, The File Protect appliance supports using the ether1 interface to access storage. When the ether2 interface is used to access storage, the ether1 and ether2 interfaces must be on different networks. You can use the following CLI command to configure a nondefault gateway to reach the storage server from the ether2 interface:
ip route <network prefix> <netmask or mask length> <next hop IP address or interface name> <interface name> (terminal)The following remote file access protocols are supported:
CIFS shares store files on Windows systems.
SMB shares store files, printers, and serial ports on Windows systems.
NOTE: The default in File Protect is SMB Version 2.
NFS shares store files on Linux systems.
WebDAV shares store files on Web servers.
Secure WebDAV shares store files on Web servers over HTTPS.
There are three share types. The File Protect appliance scans Files shares. Files are then moved from it as follows:
Malicious files are moved to a Quarantine share, if one is configured for a scan. You can select either a quarantine share you added or "local_QF." If you select "local_QF," the File Protect appliance will create a local_QF folder in the source file share the first time it encounters a malicious file, and will move all malicious files into it. FireEye recommends against using "local_QF," because malicious files will not be isolated from the source files.
Non-malicious files, whitelisted files, and files with disabled or unknown file types are moved to a Good/Whitelist/Unknown Files share, if one is configured. A single Good/Whitelist/Unknown Files share can store all three types of files, but you must define them separately when you configure a scan. For example, if you only define a "good" folder for a scan, non-malicious files will move into it, but "whitelist" and "unknown" files will remain in the Files share.
In the next scan, the malicious files remaining in the Files share will be reanalyzed. The non-malicious files remaining in the Files share will be marked as duplicates; they will be reanalyzed the next time the share is scanned after seven days has elapsed.

Files cannot be moved to shares with read-only access.
Storage Settings
Setting | Description |
|---|---|
Name | A unique name to identify the storage. The name can contain letters, numbers, hyphens (-), underscores (_), and periods (.). |
Protocol | CIFS, NFS, WebDAV, or Secure WebDAV |
Certificate | Certificate Authority (CA) certificate (Secure WebDAV shares only) |
Server | The URL or name of the file server that hosts the network share. |
Share to mount | The network share name or full export path. |
Username | A user with access to the remote file system (CIFS, WebDAV, and Secure WebDAV shares only). |
Password | The password used to authenticate the user (CIFS, WebDAV, and Secure WebDAV shares only). |
Type of share | Quarantine, Good/Whitelist/Unknown Files, or Files. |
Adding Storage
Use the File Protect Web UI to add storage.
Prerequisites
Operator or Administrator access
Adding Storage Using the Web UI
Use the Add Storage section of the Configure Storage page to add storage.

The settings in the Add Storage section vary depending on the remote file access protocol.
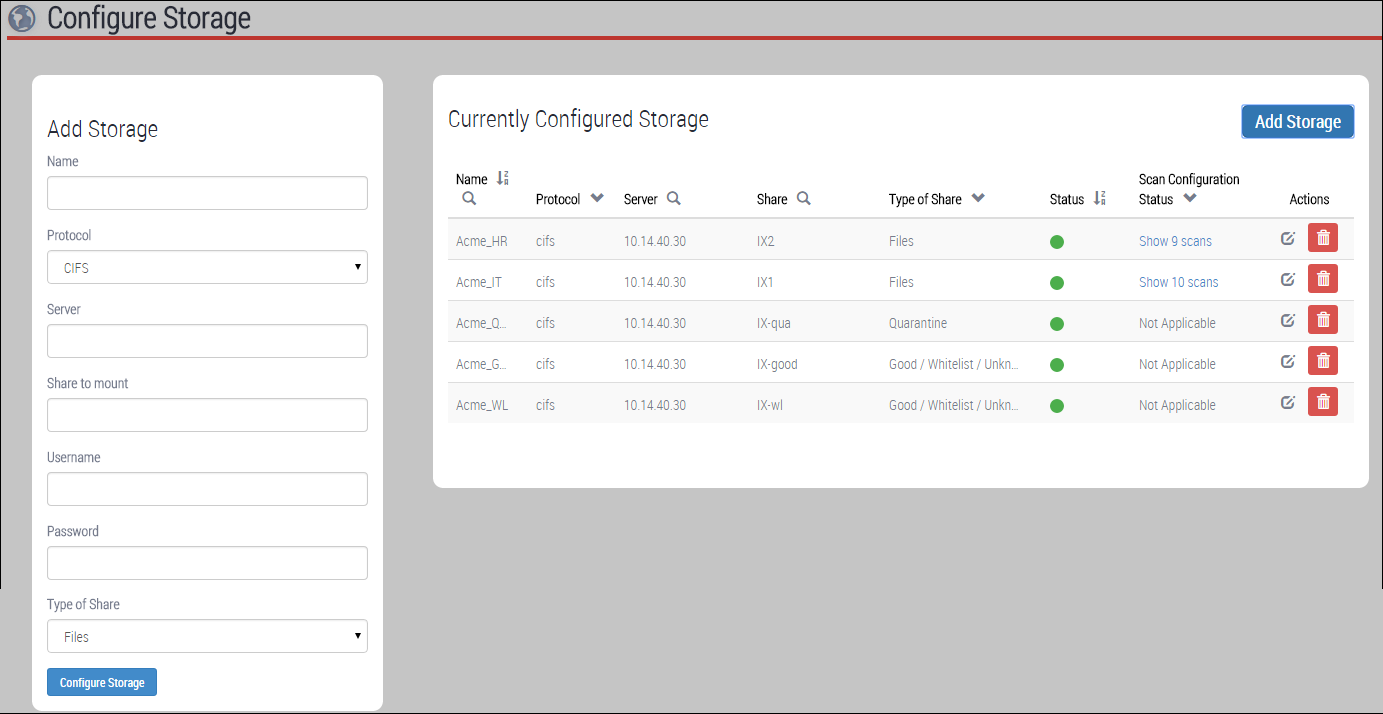

If you are using Distributed File System (DFS) shares, you must also configure the IP address of the Windows Internet Name Service (WINS) server used to resolve link targets, as described in Configuring Analysis Settings.
To add storage:
Click the Storage tab and then click Add Storage.
In the Add Storage section, complete the fields as described in Storage.
Click Configure Storage.
Locate the new storage in the Currently Configured Storage section. The icon in the Status column is yellow while the storage is being added, and turns green after it is added successfully.

If the icon is red, see Troubleshooting Storage Errors.
Viewing and Managing Storage
Storage management tasks you can perform from the File Protect Web UI include viewing configured storage and its status, modifying and deleting storage, and remounting storage that becomes inaccessible. You can view storage information from the CLI.
Prerequisites
Analyst, Operator, or Administrator access to view storage
Operator or Administrator access to modify, delete, and remount storage
Viewing and Managing Storage Using the Web UI
Use the Currently Configured Storage section of the Configure Storage page to view and manage configured shares.
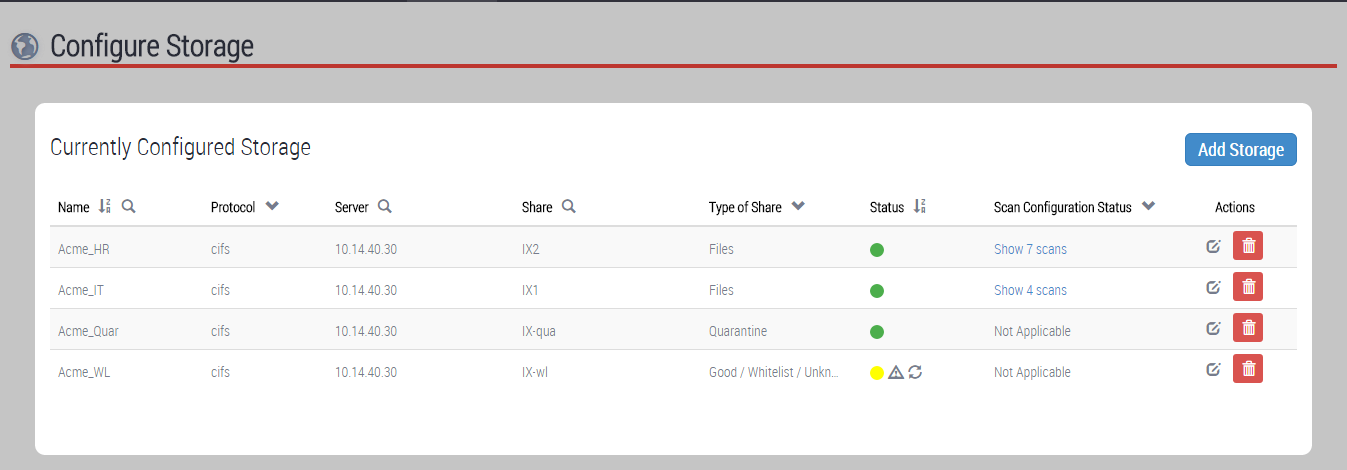
144
© 2021 FireEye
Release 9.0 Viewing and Managing Storage
 You can also add new shares from this page. For details, see Adding Storage Using the Web UI.
Click the Storage tab. All configured shares are displayed in the Currently Configured Storage section.
To filter the results, do any of the following:
Click the arrow in the Protocol column and select one or more protocols.
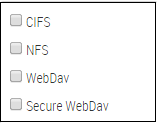
Click the arrow in the Type of Share column and select one or more share types.
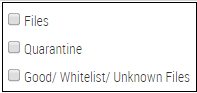
Click the arrow in the Share Configuration Status column and then select one or more statuses.
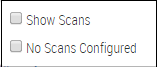
3. To search for or filter by share name, server, or network file share:
Click the search icon in the Name, Server, or Share column.
In the search box, type the characters you want to use as search criteria. For example, if you enter "10.14" for a server search, all shares configured on servers whose IP addresses start with "10.14" are displayed.
4. To sort storage names alphabetically or sort the share status by severity, click the arrow in the Name or Status column.
To view the scans that ran on a share:
Click a link in the Scan Configuration Status column in the row for the share.
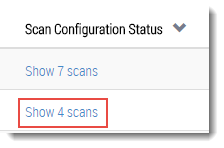
The Scans page opens and lists only those scans.
To change storage parameters:
Click the
 icon in the Actions column.
In the Edit Storage window, change parameters as needed.
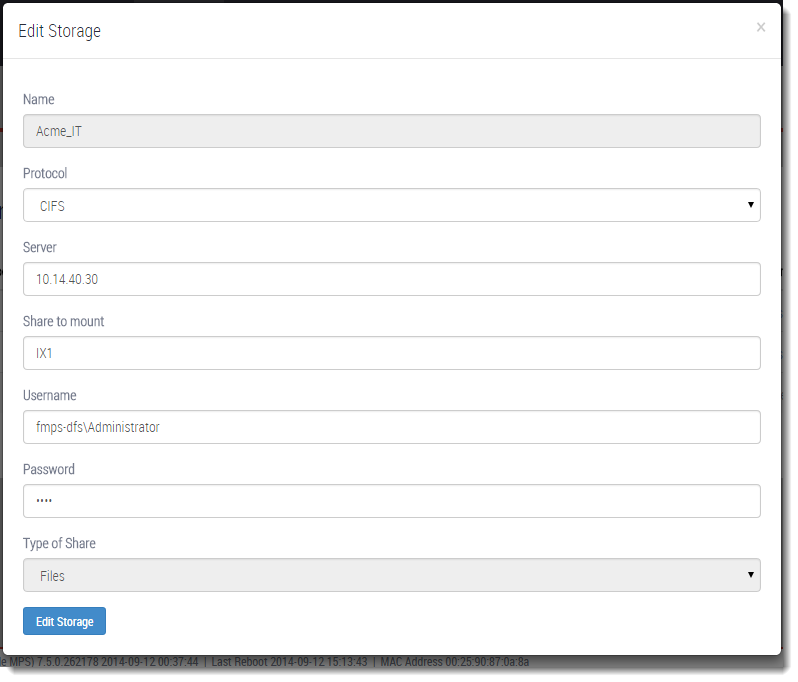
Click Edit Storage to save your changes.
Click the
 icon in the Actions column.
When prompted, confirm that you want to delete the share.
Viewing Storage Using the CLI
Use the command in this section to view information about a share using the CLI in standard mode.
View information about the file share:
hostname > show fmps file shares shareNameEnable the CLI configuration mode:
hostname > enable hostname # configure terminalView information about a specific share:
hostname # <config> show fmps share library1 Share Name: library1 Share Type: Source Status: Share is mounted and connected Share URL: //10.14.68.12/sites/site_ collection1/site1/library1 Protocol: webdav Share user: sharepointfarmadmin Mount command prefix: -t davfs CA File: - Server name: SharePoint - 443 hostname # (config)
Troubleshooting Storage Errors
You can view the status of storage in the Status column in the Currently Configured Storage section of the Configure Storage page.

If storage was added successfully, a green icon is shown.
While storage is being added, a yellow icon is shown.
If storage failed to be added, a red icon is shown.
To view information about storage with yellow or red status, hover over the  icon. If the storage is being added, a "Share is being mounted" message is displayed. If there is an error, a message that identifies the problem is displayed.
If storage becomes inaccessible, you can click the  icon to remount it.
The causes of errors include lack of permission to the file system, system errors, timeouts, and so on. These are standard file system mounting errors; refer to your file system documentation for troubleshooting information.
Scan Configuration
The following sections describe how to configure and manage scans.
Scanning Best Practices
Your File Protect file scanning performance will vary according to the appliance model you are using, the number of file types you enable for scanning, and the number of scans you run simultaneously. For optimal results, it is recommended that you configure scan filters, scan results folders, and the optimal scan type, as described in Filters, Results Folders, and Types.
Filters, Results Folders, and Types
For the most effective scans, use the configuration features described in this section.

For advanced scan configuration information, see Configuring Analysis Settings.
Scan Filters
You can tailor scans to focus on specific areas of interest, or to prevent scans from taking too much time and overloading the appliance. The following filters allow you to tailor a scan:
Folders—Scan only a specific folder instead of the whole share.
File types—Include or exclude specific file types.
Date range—Scan only those files that were added or modified recently.
Scan Results Locations
You can configure the File Protect appliance to automatically route scanned files to shares designated to store malicious, safe, whitelisted, and skipped files. The appliance does not scan these shares.
Quarantine shares store files that were analyzed and classified as malicious.
Good shares store files that were analyzed and classified as non-malicious.
Whitelist shares store files that were not analyzed because you designated their file types as safe.
Unknown shares stores files that were skipped because their file types are not enabled for scanning or are unrecognized, because the files are empty, and so on.
Only shares with the Good/Whitelist/Unknown Files share type can be associated with the Good, Whitelist, and Unknown share types. All three of these share types can be associated with the same share. If any of these share types is not configured for a scan, the applicable files are not moved.

Scan Types
There are four types of scans.
Pre-Scans
A preliminary scan, or pre-scan gathers initial statistics about a share. This allows you to define realistic scan criteria, so the File Protect appliance can complete the scan in a reasonable amount of time.
For example, a scan on a share that contains millions of files could overload the appliance or take an unacceptable amount of time to complete. Obtaining the share statistics ahead of time allows you to decide whether to filter the scan so it analyzes only files of a certain file type, files in a particular folder, files that are not whitelisted, and so on.
The pre-scan is based on the criteria defined for the scan, and includes the following statistics:
A list of the files to be skipped, the reason, and their file types
Number of files in the share
Number of preconfigured "whitelisted" folders in the share (for example, ~snapshot folders).
Number and types of files that will be analyzed, skipped, and whitelisted
To view the pre-scan statistics, click the Download Report button as described in Viewing Pre-Scan Results.
Scheduled Scans
Scheduled scans run automatically at the time you specify for each share. Scans can be configured to run daily or weekly.
Continuous Scans
When a scan is configured to be "continuous," the File Protect appliance checks the share for new files at an interval called the "scan delay." The default scan delay is every three minutes; the minimum scan delay is one second.
FireEye strongly recommends that you configure a scan delay that is at least one minute to accommodate network latency issues with file system operations. Otherwise, a continuous scan could check files that are in the process of being modified.

Scan Now Scans
Scan now is an instant scan that runs as soon as you start it. You can run this type of scan at any time, even if scheduled scans are already configured for the share.
Configuring Scans
The Configure a Scan wizard in the Web UI offers an easy way to configure a scan, and guides you through steps to fully configure one. To achieve the same results using the CLI, you use one command to create the scan, and then use additional commands to define the scan parameters and start or schedule the scan.
Prerequisites
Operator or Administrator access
Configured share from which to create the scan
Using the Configure a Scan Wizard
This topic demonstrates how to configure a scan using the Configure a Scan wizard. It uses the example of a scheduled scan that will run on the Laptops folder in the Assets
© 2021 FireEye151
File Protect User Guide
CHAPTER 8: Scan Configuration
share. Files with the .doc, .docx, .pdf, .ppt, and .xls file type that were added or modified since August 1, 2014 will be scanned every Sunday at 4:00 a.m. Files with the .apk type will be moved to a whitelist. Malicious, non-malicious, and whitelist files will be moved to the specified folders.
 To navigate through the wizard steps, use the Next and Previous buttons or click the target step button.
Open the Wizard
Click the Scans tab.
Click Configure a Scan.
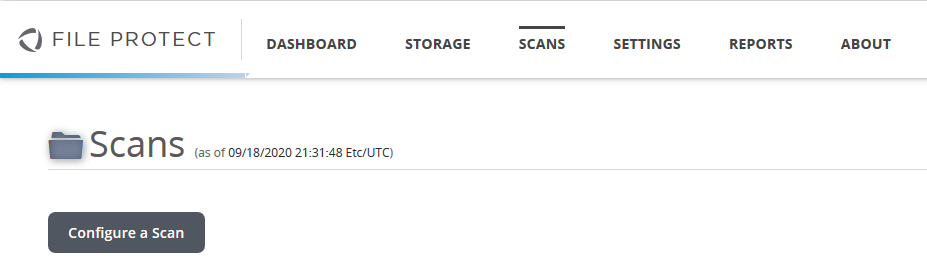
Name of Scan
This step names the scan and defines its initial scope.
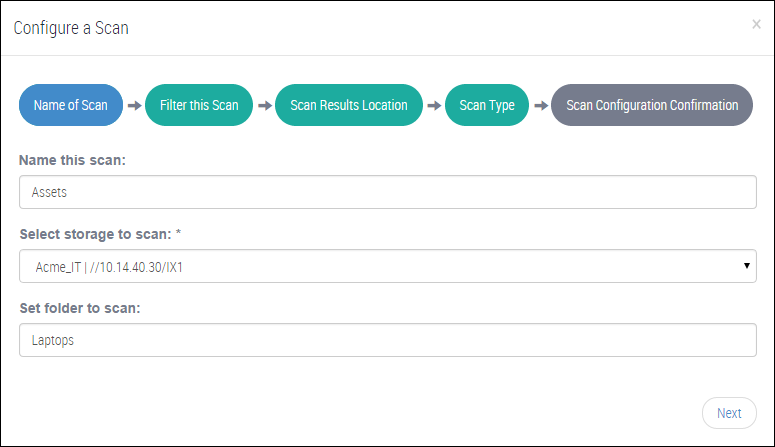
(Optional) Type a name to identify the scan. The name does not have to be unique.
Select the storage you want to scan. Each option includes the storage name, server name or IP address, and share name.
To scan only a specific folder and its subfolders, type the folder name.
Click Next or Filter this Scan to advance to the next step.
Filter this Scan
This step allows you to control the scope of the scan, as described in Filters, Results Folders, and Types.
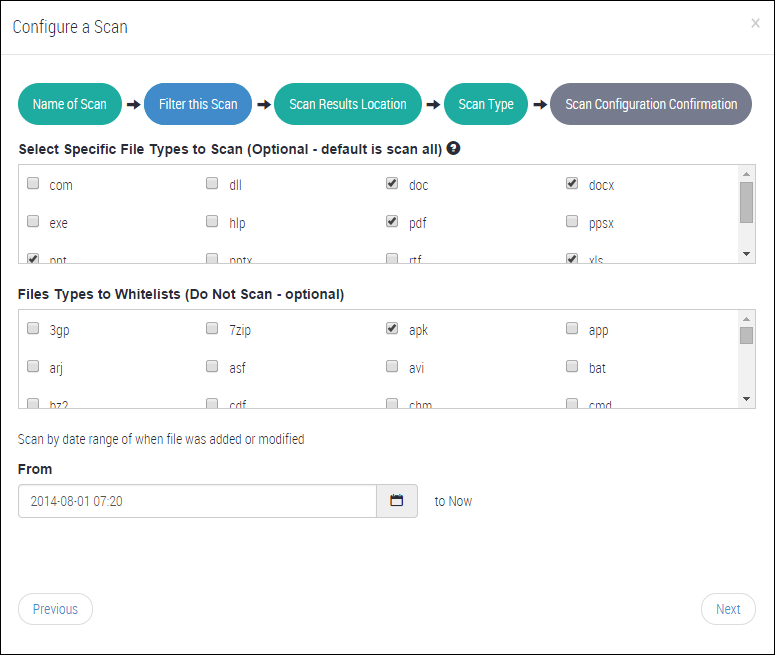
Select the file types you want to scan. This list shows file types that are enabled on Settings: Malware File Assoc. page for at least one guest images profile. If no file types are selected, files of all types are scanned.
 If you select a file type that is later disabled on the Settings > Malware File Assoc. page, subsequent scans will skip those files.
Select the file types you consider safe and want to whitelist. This list shows all the file types that the File Protect appliance knows about.
Click the
 icon and select a date to specify how far back in time you want the appliance to look for new or modified files to scan.
Click Next or Scan Results Location to advance to the next step.
Scan Results Location
This step defines the folders the File Protect appliance should move files to after they are scanned, described in Filters, Results Folders, and Types. The appliance does not scan these folders.
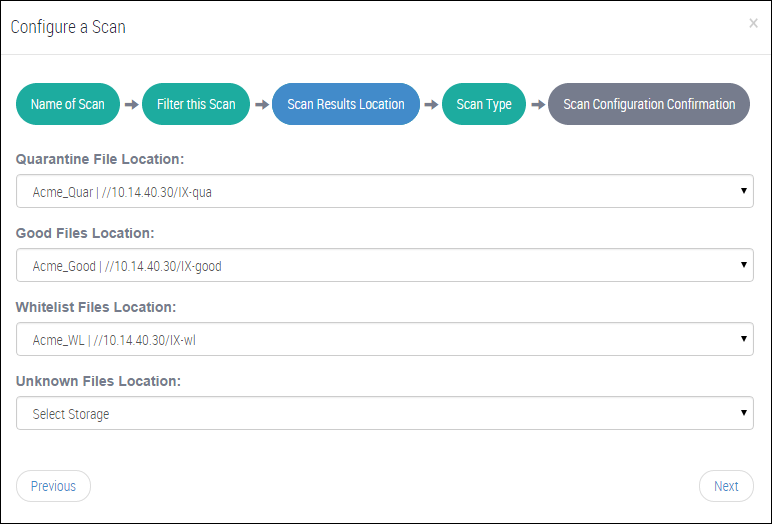
Select one or more of the following folders:
A Quarantine File Location folder to store malicious files after they are analyzed.
 You can select either a quarantine share you added as storage or "local_QF." If you select "local_QF," the File Protect appliance will create a local_QF folder in the source file share the first time it encounters a malicious file, and will move all malicious files into it. FireEye recommends against using "local_QF," because malicious files will not be isolated from the source files.
A Good File Location folder to store non-malicious files after they are analyzed.
A Whitelist File Location to store files with file types you selected in the File Types to Whitelist section in the Using the Configure a Scan Wizard .
An Unknown File Location to store files with file types you did not select in the Select Specific File Types to Scan section in the Using the Configure a Scan Wizard , file types the appliance does not recognize, files that are empty, and so on.
Click Next or Scan Type to advance to the next step.
Scan Type
This step defines the type of scan, as described in Filters, Results Folders, and Types.
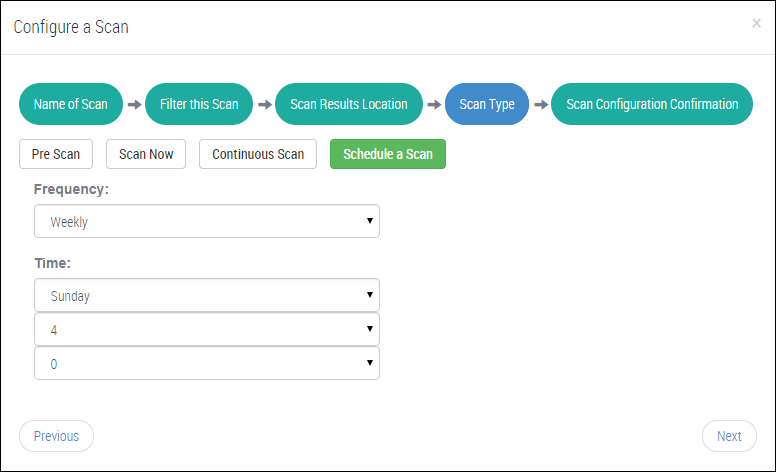
Click one of the following buttons:
Pre Scan performs a preliminary scan of the share.
Scan Now performs an instant scan.
Continuous performs a scan at regular intervals.
Schedule a Scan performs a daily or weekly scan as configured.
If you selected Schedule a Scan, do one of the following:
Select Daily, and then select the hour (0-23) and minute (0-59) the scan should start.
Select Weekly, and then select the day, hour, and minute the scan should start.
Click Next or Scan Configuration Confirmation to advance to the next step.
Scan Configuration Confirmation
This step shows you a summary of the scan parameters you defined and allows you to save or start the scan.
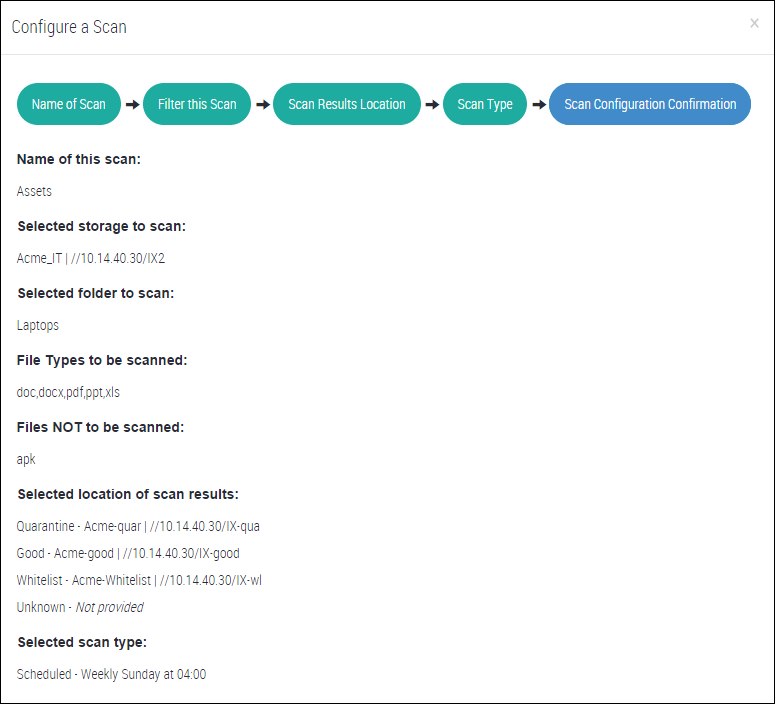
Review the summary information.
If you need to make changes to a step, click Previous or the step button to return to it.
Pre-Scan, Scan Now, or Continuous Scan: Click Save Scan if you want to run the scan later, or Scan Now to run the scan immediately.
Schedule a Scan: Click Schedule Scan.
After the "Scan configuration complete" message is displayed, click the × icon at top right corner to close the wizard.

To cancel the configuration of a scan, simply close the wizard by clicking the × icon.
Using the CLI to Configure Scans
The following topics describe how to configure scans using the CLI.
Creating a Scan Using the CLI
There are two ways to create a scan from the CLI:
Create a base scan from a share. The new scan has no defined criteria. It will run on the specified share.
Create a scan using an existing scan as a template. The new scan has the same parameters as the existing scan, and can be modified as needed. It will run on the same share as the existing scan.
Scans you create using the CLI will not be shown on the Currently Configured Scans page in the Web UI until you start or schedule them, as described in Starting a Scan .

To configure a scan from a share:
Enable the CLI configuration mode:
hostname > enable hostname # configure terminalCreate the scan:
hostname (config) # fmps scan create from share shareNamewhere shareName is the share on which the scan will run.
Save your changes:
hostname (config) # write memory
To create a scan from an existing scan:
Enable the CLI configuration mode:
hostname > enable hostname # configure terminalCreate the scan:
hostname (config) # fmps scan create from scan scanIDwhere scanID is the ID of the existing scan.
Save your changes:
hostname (config) # write memory
Examples
The following example creates a new scan on the Acme_HR share.
hostname (config) # fmps scan create from share Acme_HR
Scan 54 configuredThe following example creates a new scan on based on scan 165. The new scan will run on the same share as the existing scan.
hostname (config) # fmps scan create from scan 165
Scan 268 configuredScheduling a Scan Using the CLI
To schedule a scan:
Enable the CLI configuration mode:
hostname > enable hostname # configure terminalTo reschedule a scan that runs daily:
fmps scan schedule scanID type daily time HH:mmwhere HH is the hour (01-24) and mm is the minute (01-59).
To reschedule a scan that runs weekly:
fmps scan schedule scanID type weekly day <day> time HH:mmwhere day is Sunday, Monday, Tuesday, Wednesday, Thursday, Friday, or Saturday; HH is the hour (01-24), and mm is the minute (01-59).
Save your changes:
hostname (config) # write memory
Filtering Scans Using the CLI
Use the commands in this section to define filters that limit the scope of the scan.

You can use these commands only on scans that are in the "configured" state. You cannot configure active, paused, aborted, completed, or scheduled scans.
See Filters, Results Folders, and Types for detailed descriptions of the filters.
To define scan filters:
Enable the CLI configuration mode:
hostname > enable hostname # configure terminalTo scan only specific file types:
hostname (config) # fmps scan configure scanID filetypes select fileTypeswhere fileTypes are any of the file extensions enabled for any guest profile on the Settings: Malware File Assoc. page in the File Protect Web UI, separated by spaces.

If you specify a file type that is later disabled on the Settings>Malware File Assoc. page, subsequent scans will skip those files.
To whitelist file types so they are not scanned:
hostname (config) # fmps scan configure scanID filetypes whitelist fileTypeswhere fileTypes are any of the file extensions the File Protect appliance knows about, separated by spaces.
You can see a list of these file extensions in Filter this Scan step of the Configure a Scan wizard. See Using the Configure a Scan Wizard.
To only scan files that were added or changed after a specific date and time:
hostname (config) # fmps scan configure scanID start-time after YYYY/MM/DD HH:mm:sswhere YYYY is the year, MM is the month (01-12), DD is the day (01-31), HH is the hour (01-23), mm is the minute (01-59), and ss is the second (01-59).
To only scan files that were added or changed since a specific period of time:
hostname (config) # fmps scan configure scanID start-time since number days number hours number minutes number secondsTo exclude a parameter, specify 0 as its value. For example, to specify "since 12 hours ago," enter 0 days 12 hours 0 minutes 0 seconds.
To scan files in a specific subdirectory:
hostname (config) # fmps scan configure scanID subdirectories subdirectory
To exclude a parameter, specify 0 as its value. For example, to specify "since 12 hours ago," enter 0 days 12 hours 0 minutes 0 seconds.
7. Save your change:
hostname (config) # write memoryExamples
The following example specifies that scan 71 should analyze .doc, .docx, .pdf, and .ppt files and whitelist .asf files. It checks files in the Assets subdirectory that were added or changed over the past 30 days.
hostname (config) # fmps scan configure 71 filetypes select doc docx pdf ppt
hostname (config) # fmps scan configure 71 filetypes whitelist asf
hostname (config) # fmps scan configure 71 subdirectories Assets
hostname (config) # fmps scan configure 71 start-time since 30 days 0 hours 0 minutes 0 secondsThe following example shows the specified filters in bold.
hostname (config) # show fmps scan-id 71
Scan ID 71 (State: Configured Description: Scan configured)
Scan type: -
Scan name: -
Share name: Acme_IT
Share URL: //10.14.40.30/IX1
Filetype whitelist: asf
Selected filetypes: doc docx pdf ppt
Quarantine repository name: -
Good repository name: -
Unknown repository name: -
Whitelisted repository name: -
Only files modified: since 30 days 0 hours 0 minutes 0 seconds
Subdirectories: Assets
Advanced:
Timestamp type: change
Rescan: falseConfiguring Scan Results Folders Using the CLI
Use the commands in this section to configure scan results folders using the CLI.
You can use these commands only on scans that are in the "configured" state. You cannot configure active, paused, aborted, completed, or scheduled scans.
To configure scan results folders:
Enable the CLI configuration mode:
hostname > enable hostname # configure terminalVerify the status of the share to which you want to map the folder:
hostname (config) # show fmps file shares shareName
Specify the results folder:
To configure a folder for non-malicious files:
hostname (config) # fmps scan configure scanID target-shares good shareNameTo configure a folder for malicious files:
hostname (config) # fmps scan configure scanID target-shares quarantine shareNameTo configure a folder for unknown files:
hostname (config) # fmps scan configure scanID target-shares unknown shareNameTo configure a folder for whitelist files:
hostname (config) # fmps scan configure scanID target-shares whitelisted shareName
Save your changes:
hostname (config) # write memory
Example
The following example shows how to check the status of the Acme-good share and then configure a "good" folder for scan 37.
hostname (config) # show fmps file shares Acme-good
Share Name: Acme-good
Enabled: yes
Description: ********
Share URL: //10.14.40.30/IX-good
Mount command prefix: mount --no-mtab -t cifs -o sec=ntlmsspi
Share user: fmps-dfs\Administrator
Share password: ********
hostname (config) # fmps scan configure 37 target-shares good Acme-goodManaging Scans
There are situations in which you need to stop a running scan. A few examples follow:
Prioritization. While a scan on share A is running, you learn that potentially dangerous files were added to Share B. You want to scan Share B immediately, in as little time as possible. To maximize the performance of the scan on Share B, you can pause the first scan and then resume it later.
Troubleshooting. You are experiencing network problems. To help isolate the problem, you can pause all running scans. If the network problems persist, you can eliminate the File Protect appliance as a contributing factor, and then resume the scans.
Testing. You are configuring scans and testing different ways to filter them. After you start a scan, you quickly realize that it needs to be more fine-tuned. You can abort the scan and then configure another one that more closely meets your needs.
You can pause or abort scheduled or on-demand scans that are in progress, and then resume them when you are ready.
You can save preliminary, continuous, and on-demand scans and then start them when you are ready, instead of running them immediately. You can edit preliminary, continuous, and on-demand scans that have not been started to adjust their filters or other parameters. Scheduled scans cannot be edited. You must delete them and then configure new ones.
You can delete configured, aborted, completed, and cancelled scheduled scans. You cannot delete running, paused, and active scheduled scans. If you enter an fmps scan command for a scan that is deleted, you will see a message that states the scan is not found..
Scans on shares containing a small number of files are paused or aborted almost immediately. However, if the share being scanned contains more than 10,000 files, there could be a delay of a few seconds or minutes from the time you pause or abort the scan and when the scan actually stops.

Prerequisites
Operator or Administrator access
Managing Scans Using the Web UI
Use the Scans page to manage configured scans. The Scans page contains tools to save, pause, abort, and delete scans. In addition, it contains tools to resume a paused scan, edit a scan, and monitor a scan.
The following figure shows the Scans page.

To configure a new scan, see Using the Configure a Scan Wizard.
Managing Scans
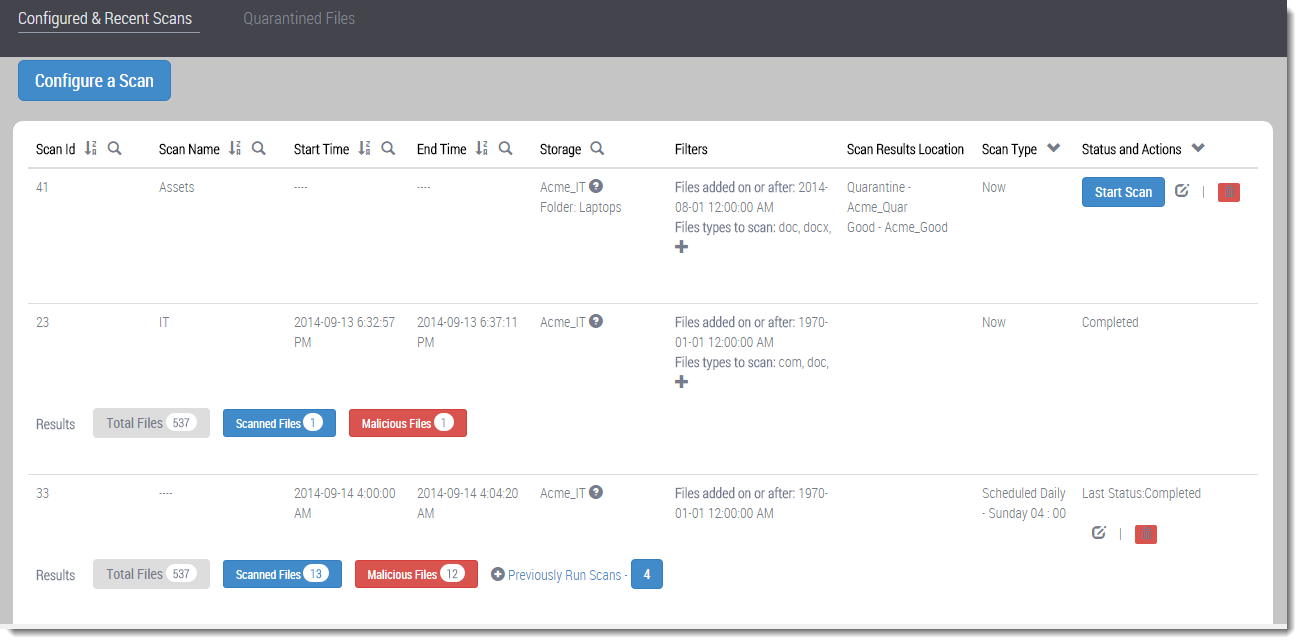
To display the Scans page, click the Scans tab in the Web UI.
Starting a Scan
To start a scan:
Click the Scans tab.
The Scans page shows the tools for managing scans.
Click the Start Scan button in the Status and Actions column.
The confirmation dialog box shows the OK button.
Click OK to confirm that you want the scan to start.
Pausing a Scan
To pause a scan:
Click the Scans tab.
The Scans page shows the tools for managing scans.
Click the pause icon.
The confirmation dialog box shows the OK button.
Click OK to confirm that you want to pause the scan.
Resuming a Paused Scan
To resume a paused scan:
Click the Scans tab.
The Scans page shows the tools for managing scans.
Click the resume icon.
The confirmation dialog box shows the OK button.
Click OK to confirm that you want to resume the scan.
Aborting a Scan
To abort a scan:
Click the Scans tab.
The Scans page shows the tools for managing scans.
Click the abort icon.
The confirmation dialog box shows the OK button.
Click OK to confirm that you want the scan aborted.
Restarting a Scan
To restart a scan:
Click the Scans tab.
The Scans page shows the tools for managing scans.
Click the Restart button in the Status and Actions column.
The confirmation dialog box shows the OK button.
Click OK to confirm that you want the scan to restart.
Deleting a Scan
To delete a scan:
Click the Scans tab.
The Scans page shows the tools for managing scans.
Click the delete icon in the Status and Actions column.
The confirmation dialog box shows the OK button.
Click OK to confirm that you want to delete the scan.
Monitoring a Scan
To monitor the status of a scan:
Click the Scans tab.
The Scans page shows the tools for managing scans.
Select the scan you want to monitor.
View the status of the scan in the Status and Actions column.
Changing Scan Parameters
To change scan parameters:
Click the Scans tab.
The Scans page shows the tools for managing scans.
Click the parameters icon.
In the Configure a Scan wizard, navigate to the applicable step or steps and change parameters as needed.
Click Scan Configuration Confirmation step to save your changes.

You can only change the parameters of saved scans.
Managing Scans Using the CLI
Use the fmps scan family of CLI commands to manage scans. The family contains commands to save, pause, abort, and delete scans. In addition, it contains commands to resume a paused scan and edit a scan.
Starting a Scan
Use the commands in this section to start or schedule a scan using the CLI.
To start a scan:
Enable the CLI configuration mode:
hostname > enable hostname # configure terminalTo start a pre-scan:
fmps scan start scanID prescanTo start a continuous scan:
hostname (config) # fmps scan start scanID continuousTo start an on-demand (scan now) scan:
hostname (config) # fmps scan start scanID nowSave your changes:
hostname (config) # write memory
Pausing a Scan
To pause a scan:
Enable the CLI configuration mode:
hostname > enable hostname # configure terminalPause scan 10:
hostname (config) # fmps scan pause 10Save your changes:
hostname (config) # write memory
Resuming a Paused Scan
To resume a scan:
Enable the CLI configuration mode:
hostname > enable hostname # configure terminalResume scan 10:
hostname (config) # fmps scan resume 10Save your changes:
hostname (config) # write memory
e
Aborting a Scan
To abort a scan:
Enable the CLI configuration mode:
hostname > enable hostname # configure terminalAbort scan 10:
hostname (config) # fmps scan abort 10Verify that scan 10 was aborted.
hostname (config) # show fmps scan 10 Scan ID: 10 (State: Completed Description: Scan aborted by user) Scan type: Now Scan name: HRScan Share name: Acme_HR Share URL: //10.14.40.30/IX1 Filetype whitelist: 7zip asf cdf Selected filetypes: com exe ppt Quarantine repository name: local_QF Good repository name: Acme-good Unknown repository name: Acme-Unknown Whitelisted repository name: Acme-Whitelist Only files modified: after 2014-01-01 08:09:00 Advanced: Timestamp type: change Rescan: false Started at: 2014-10-08 15:10:38 Ended at: 2014-10-08 15:15:03 Duration: 00:04:25.073049 Total number of files in the share: 533 (Scannable 533) Scanned: 533 (2.0 files/sec => ~173778 files/day) Analyzed: 2 (~0.4% of the share) Good: 0 (~0.0% of the share) Unknown: 526 (~98.7% of the share) Whitelisted: 5 (~0.9% of the share) Duplicates: 0 (~0.0% of the share) Malicious: 2 (~0.4% of the share)
4. Save your changes:
hostname (config) # write memoryRestarting a Scan
To restart a scan:
Enable the CLI configuration mode:
hostname > enable hostname # configure terminal
Restart scan 10:
hostname (config) # fmps scan restart 10Save your changes:
hostname (config) # write memory
Deleting a Scan
To delete a scan with confirmation:
Enable the CLI configuration mode:
hostname > enable hostname # configure terminalDelete scan 10:
hostname (config) # fmps scan delete 10 hostname (config) # Delete scan 10? ySave your changes:
hostname (config) # write memory
To delete a scan with no confirmation:
Enable the CLI configuration mode:
hostname > enable hostname # configure terminalDelete scan 10:
hostname (config) # fmps scan delete 10 noconfirmSave your changes:
hostname (config) # write memory
Monitoring a Scan
To view a scan:
Enable the CLI configuration mode:
hostname > enable hostname # configure terminal
2. View scan 10:
hostname (config) # show fmps scan 10
Scan ID: 10 (State: Completed Description: Scan completed)
Scan type: Now
Scan name: HRScan
Share name: Acme_HR
Share URL: //10.14.40.30/IX1
Filetype whitelist: 7zip asf cdf
Selected filetypes: com exe ppt
Quarantine repository name: local_QF
Good repository name: Acme-good
Unknown repository name: Acme-Unknown
Whitelisted repository name: Acme-Whitelist
Only files modified: after 2014-01-01 08:09:00
Advanced:
Timestamp type: change
Rescan: false
Started at: 2014-10-08 15:10:38
Ended at: 2014-10-08 15:15:03
Duration: 00:04:25.073049
Total number of files in the share: 533 (Scannable 533)
Scanned: 533 (2.0 files/sec => ~173778 files/day)
Analyzed: 2 (~0.4% of the share)
Good: 0 (~0.0% of the share)
Unknown: 526 (~98.7% of the share)
Whitelisted: 5 (~0.9% of the share)
Duplicates: 0 (~0.0% of the share)
Malicious: 2 (~0.4% of the share)
-------------------------------------------------------------
Filetypes Statistics
-------------------------------------------------------------
File type Analyzed Malicious Good Sec per analysis
Duplicates Duplicate percentage Whitelisted Whitelisted percentage
exe 0.0 2 2 1 0 33.3 0
zip 0.0 0 0 0 0 0 0
4 100.0
Changing Scan Parameters
To change scan parameters:
Enable the CLI configuration mode:
hostname > enable hostname # configure terminalUse the following options to change scan 10 parameters:
hostname (config) # fmps scan configure 10 ? filetypes Configure filetype settings for the scan scan-name Set a name of the scan start-time Configure a start-from time subdirectories Set a list of subdirectories that will be scanned target-shares Configure target repositories for the scan
hostname (config) # write memoryAutomatically Restarting a Scan
When the File Protect appliance loses connection to the storage it is scanning (for example, if the storage is dismounted), the scans associated with it are paused. You can enable the appliance to automatically resume the scans when the connection to the storage is restored.
When a scan is paused because the storage was dismounted, the following status messages are displayed:
In the Web UI: The scan is automatically paused due to the storage failure.
In the CLI: State: Paused Description: Scan paused by system in the Scan ID field.
To start the scan from scratch when a storage is mounted again, disable automatic restart of scans.
Follow the steps in Enabling and Disabling Auto Restart of Scans below to enable or disable the feature.
Enabling and Disabling Auto Restart of Scans
Use the commands in this section to enable or disable automatic resumption of scans in storages that have been remounted.
To enable the automatic scan restart feature:
Enable the CLI configuration mode:
hostname > enable hostname # configure terminalEnable automatic scan restart:
hostname (config) # fmps scan auto-restartSave your changes:
hostname (config) # write memory
To disable the automatic scan restart feature:
Enable the CLI configuration mode:
hostname > enable
hostname # configure terminal
Disable automatic scan restart:
hostname (config) # no fmps scan auto-restartSave your changes:
hostname (config) # write memory
Scan Results
Scan results can be viewed in the following ways:
The Scans page provides high-level information about each configured scan. Buttons and links on the page allow you to navigate to specific areas of interest. See Viewing Scan Results Using the Web UI.
The Scanned File Summary window shows each file type that was scanned, and the number of files of each type that were classified as Good, Whitelist, and Malicious. The show fmps scan-id CLI command displays summary results as well. SeeViewing Summary Results and Details.
The Scanned File Log Details buttons download or open log files with details about scanned files. See Downloading Scan Detail Logs.
The Scanned File Summary window also shows high-level pre-scan results. The Download Report button downloads or opens detailed pre-scan results. The show fmps scan-id CLI command displays pre-scan results as well. See Viewing Pre-Scan Results.
The Dashboard provides graphs, charts, and tables that afford instant visibility into the status of your file system.
The show fmps CLI command returns file scan results and status. See Viewing Scan Results Using the CLI.
Viewing Scan Results
The Scans page provides high-level information about each configured scan. You can use CLI commands to view more detailed information.
Prerequisites
Monitor, Analyst, Operator, or Administrator access to view scan results
Analyst, Operator, or Administrator access to download scanned file logs
Viewing Scan Results Using the Web UI
The Scans page displays high-level information about each configured scan. Buttons and links on the page allow you to navigate to specific areas of interest.
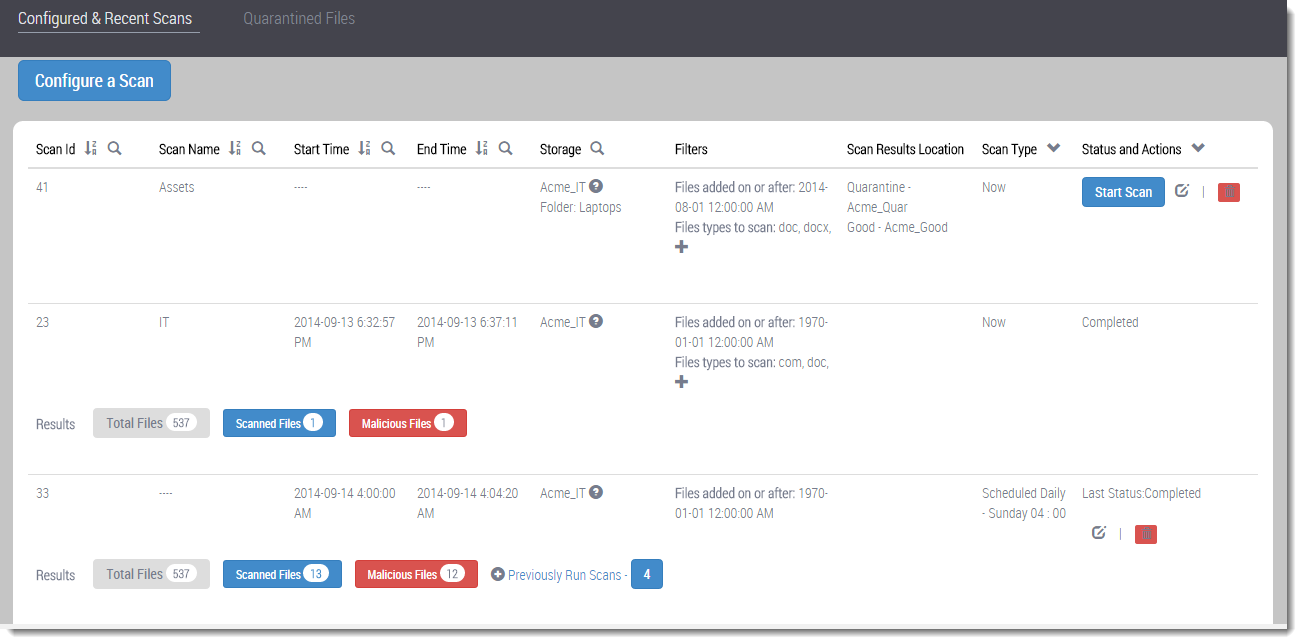
To view scan results:
Click the Scans tab. All configured scans are displayed on the Scans page.
To filter the results, do the following:
Click the arrow in the Scan Type column and select one or more scan types.
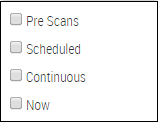
Click the arrow in the Status and Actions column and select one or more statuses.
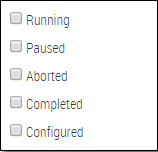
To view the full path to the storage location, hover over the question mark icon next to the storage.
To view the previous results for a scheduled scan, click the Previously Run Scans link. All scans that ran under the schedule are displayed. Click the link again to hide the previous results.
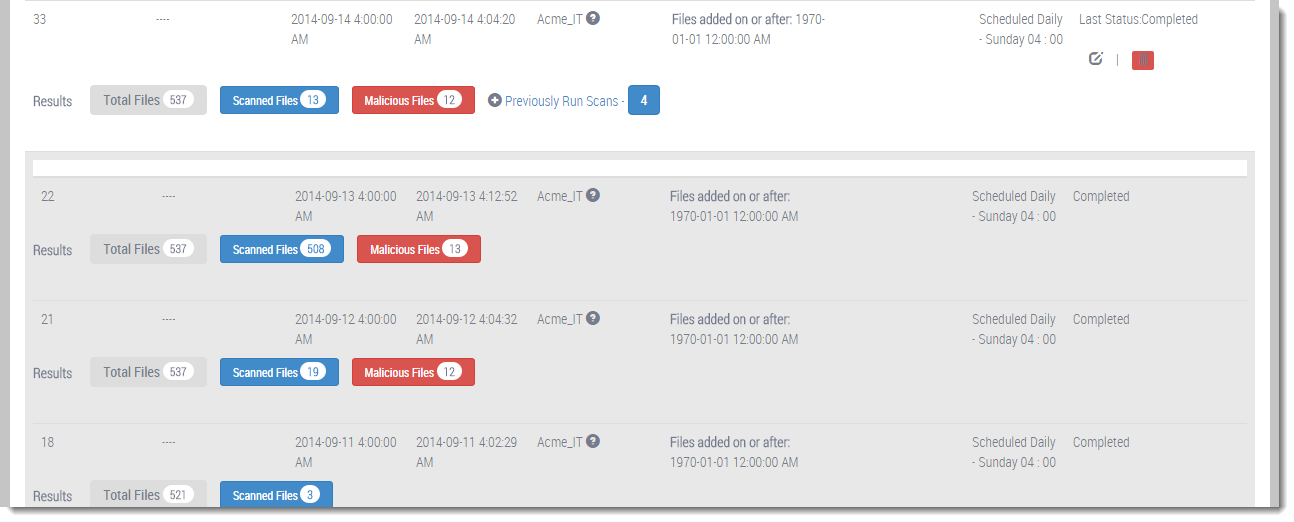
To search for or filter by scan ID, name, start time, end time, or storage name:
Click the search icon in the Scan Id, Scan Name, Start Time, End Time, or Storage column.
In the search box, type the characters you want to use as search criteria.
To sort the scan ID, name, start time, or end time in numeric or alphabetic order, click the arrow in the Scan Id, Scan Name, Start Time, or End Time column.
To view scanned file results and details:
Click the Scanned Files button in the scan results.
See Viewing Summary Results and Details.
To view quarantined file details:
Click the Malicious Files button in the scan results.
See Viewing Malware Using the Web UI.
Viewing Scan Results Using the CLI
Use the commands in this section to view scan results using the CLI in standard mode.
To view scan results:
To view the scans that ran on a share:
hostname > show fmps file shares shareName scan-idTo view the status of a scan:
hostname > show fmps scan-id scanID
The following example lists the scans that ran on the Acme_IT storage and shows statistics about them.
hostname > show fmps file shares Acme_IT scan-id
Scan Status Start End
24 Configured
8 Aborted 2014-09-05 15:34:51.460615 2014-09-05 15:34:51.460615
49 Done 2014-09-16 04:00:00.169294 2014-09-16 04:02:26.556986
Total Files Bad Files
533 0
The following example shows statistics about scan 7:
hostname > show fmps scan-id 7
Scan ID: 7 (State: Completed Description: Scan completed)
Scan type: Now
Scan name: -
Share name: Acme_HR
Share URL:/10.00.00.00/IX2
Filetype whitelist:-
Selected filetypes: doc pdf
Quarantine repository name:-
Good repository name: Acme_Quar
Unknown repository name: -
Whitelisted repository name: -
Only files modified: after 2014-08-15 12:00:00
Advanced:
Timestamp type: change
Rescan: false
Started at: 2014-09-05 15:33:37
Ended at: 2014-09-05 15:35:00
Duration: 00:01:23:053278
Total number of files in the share: 70 (Scannable 0)
Scanned: 70 (0.8 files/sec => ~72867 files/day)
Analyzed: 0 (~0.0% of the share)
Good: 0 (~0.0% of the share)
Unknown: 0 (~0.0% of the share)
Whitelisted: 0 (~0.0% of the share)
Duplicates: 55 (~0.0% of the share)
Malicious: 0 (~0.0% of the share)
Filetypes Statistics
file_type analyzed malicious sec_per_analysis duplicates duplicate_percentage
doc 0 0 0 55 100
whitelisted whitelisted_percentage good
0 0 0 For examples of scan results for other scan types and statuses, see the FireEye CLI Command Reference.
Viewing Summary Results and Details
You can view a summary of the results of a particular scan. Summary information includes the last file that was analyzed; the types of files the scan covered; the number of files of each file type that were classified as “good,” “whitelist,” and “malicious;” the number of files that were analyzed by the MVX analysis engine; and the number of files that were not analyzed because their file types are unknown, disabled, or whitelisted, or because they are duplicates (analyzed within the past seven days).
Log files for scans that are aborted, completed, or in progress provide details about scanned files:
The Analyzed log file provides details about each file that was analyzed during the scan.
The Unknown log file provides details about each file that was skipped, including the reason and whether it was moved to an “unknown” folder. A file will be skipped if its file type is disabled or unrecognized, if the file is empty, and so on.
The Whitelist log file provides details about each file that was skipped because it is on a whitelist, and whether it was moved to a “whitelist” folder.
In the Web UI, you can click a button to open or save a .txt file for each log. For ease of reading and sorting, you can also save the .txt file as comma-separated values in a .csv file and then open it in a spreadsheet program such as Excel.
Prerequisites
Monitor, Analyst, Operator, or Administrator access to view summary results
Monitor, Analyst, or Administrator access to open or download scan file detail log files
Viewing Summary Results Using the Web UI
You can use the Web UI to view all summary information except for the duplicate file statistics, which you must view using the CLI.
To view scan summary information:
Click the Scans tab and then click Configured & Recent Scans.
On the Scans page, locate the scan of interest, such as scan 57 in the following illustration.
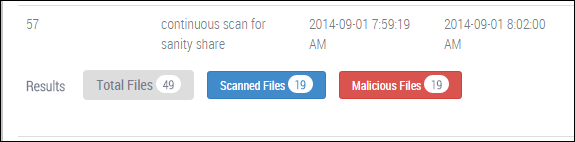
Click the Scanned Files button to open the Scanned File Summary window.
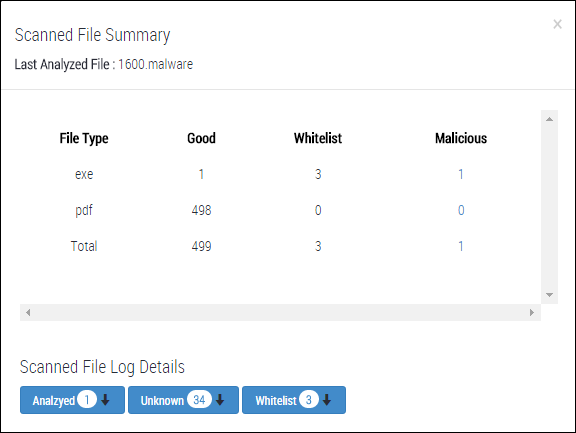
 See Downloading Scan Detail Logs for information about the buttons at the bottom of the window.
Downloading Scan Detail Logs
Use the Scanned File Log Details section of the Scanned File Summary window to download a scanned file log or the results of a pre-scan.

To download a scanned file log:
Navigate to the Scanned File Summary window as described in Viewing Summary Results Using the Web UI .
Click one of the buttons, described in Viewing Summary Results and Details .
When prompted, click Save to download the scanned file log or open the file and then save it.
To open a scanned log file in a spreadsheet program:
Open the
.txtfile.Save it as a
.csvfile. For example, you can saveWhitelist.txtasWhitelist.csv.Open the
.csvfile in a spreadsheet program such as Excel.
Viewing Summary Results Using the CLI
You can use the Web UI to view most scanned file statistics; however, you must use the CLI in standard mode to view duplicate file statistics.
To view summary information:
View the results of the scan:
hostname > show fmps scan-id scanIDExample
The following example shows the summary scan results for scan 1 in bold.
hostname > show fmps scan-id 1
Scan ID: 1 (State: Completed Description: Scan completed)
Scan type: Now
Scan name: HRScan
Share name: Acme_HR
Share URL: //10.14.40.30/IX1
Filetype whitelist: 7zip asf cdf
Selected filetypes: com exe pptQuarantine repository name: local_QF
Good repository name: Acme-good
Unknown repository name: Acme-Unknown
Whitelisted repository name: Acme-whitelist
Only files modified: after 2014-01-01 08:09:00
Advanced:
Timestamp type: change
Rescan: false
Started at: 2014-10-08 15:10:38
Ended at: 2014-10-08 15:15:03
Duration: 00:04:25.073049
Total number of files in the share: 533 (Scannable 533)
Scanned: 533 (2.0 files/sec => ~173778 files/day)
Analyzed: 2 (~0.4% of the share)
Good: 0 (~0.0% of the share)
Unknown: 526 (~98.7% of the share)
Whitelisted: 5 (~0.9% of the share)
Duplicates: 0 (~0.0% of the share)
Malicious: 2 (~0.4% of the share)
---------------------------------------------------------
Filetypes Statistics
---------------------------------------------------------
File type Analysed Malicious Good Sec per analysis Duplicates
Duplicate percentage Whitelisted Whitelisted percentage
exe 2 2 0 163 0 0.0
1 33.3
zip 0 1 0 0 0 0.0
4 100.0

For examples of summary results for other scan types and statuses, see the FireEye CLI Command Reference.
Viewing Pre-Scan Results
As described in Pre-Scans, a preliminary scan gathers initial data about a share before you actually run a scan on it. This section describes how to view the pre-scan data.
Prerequisites
Monitor, Analyst, Operator, or Administrator access to view high-level pre-scan results.
Monitor, Analyst, or Administrator access to open or download detailed pre-scan results.
Viewing Pre-Scan Results Using the Web UI
You can use the Web UI to view the results of a pre-scan.
To view pre-scan results:
Click the Scans tab and then click Configured & Recent Scans.
On the Scans page, locate the scan of interest, such as scan 15 in the following illustration.
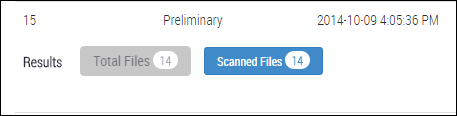
Click the Scanned Files button to open the Scanned File Summary window.
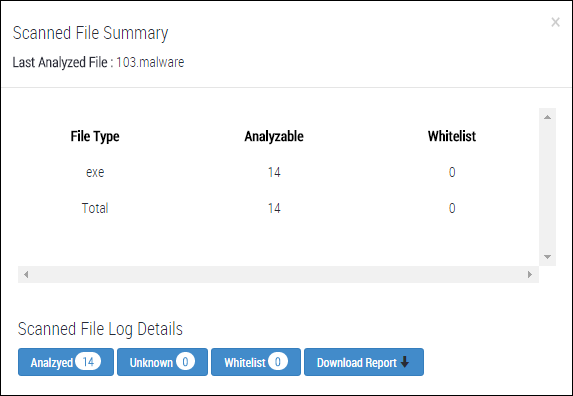
Click Download Report.
When prompted, click Save to download the report or open the report and then save it.
Viewing Pre-Scan Results Using the CLI
Use the command in this topic to view the initial data gathered by a pre-scan about a share.
To view the initial data:
Enter the following command in standard mode:
hostname > show fmps scan-id scanID
Example
The following example shows the pre-scan results for scan 15:
hostname > show fmps scan-id 15
Scan ID: 15 (State: Completed Description: Scan completed)
Scan type: Prescan
Scan name: HRPreliminary
Share name: Acme_HR
Share URL: //10.14.40.30/IX1
Filetype whitelist: -
Selected filetypes: -
Quarantine repository name: -
Good repository name: -
Unknown repository name: -
Whitelisted repository name: -
Only files modified: -
Advanced:
Timestamp type: change
Rescan: false
Started at: 2014-10-09 16:05:36
Ended at: 2014-10-09 16:05:37
Duration: 00:00:00.806398
Total number of files in the share: 14 (Scannable 14)
Scanned: 14 (14.0 files/sec => ~1209600 files/day)
Analyzable: 14 (~100.0% of the share)
Whitelisted: 0 (~0.0% of the share)
Skipped: 0 (~0.0% of the share)
--------------------------------------------------------------
Filetypes Statistics
--------------------------------------------------------------
File type Analyzable Sec per analysis Whitelisted Whitelisted percentage
exe 14 0 0 0.0Quarantines
When the File Protect appliance analyzes a file it classifies as malicious, it can be automatically moved to a quarantine folder (also known as a "scan results location" or a "target share"). All quarantine folders are remote; they cannot be configured to reside on the File Protect appliance. These remote quarantine folders require write access from both the source file share and the File Protect appliance.
If you choose to configure a quarantine share for a scan, you can select either a quarantine share you added or "local_QF." If you select "local_QF," the File Protect appliance will create a local_QF folder in the source file share the first time it encounters a malicious file, and will move all malicious files into it. FireEye recommends against using "local_QF," because malicious files will not be isolated from the source files.

A quarantine folder can be mapped to any and all configured network shares, or each network share can have its own quarantine folder mapped to it. The name that you define for a quarantine folder is used to uniquely identify share mount points. Therefore, each quarantine folder name must be unique; it cannot be the same as the name of a configured network share or another quarantine folder.
If you configure only a quarantine folder for a scan (that is, you do not a configure good, unknown, or whitelist folder), when a file is quarantined, the File Protect appliance creates a reference-only file in the same location of the network share as the original file and appends fe-quarantined to the file name. For example, if the training.ppt file is malicious, it is moved to the quarantine folder. A reference-only file named training.ppt.fe-quarantined is added to the network share, with a file type of FE-QUARANTINED File, and a file size of 0 KB. In the quarantine folder, the file has the original name and size, and the file type becomes MALWARE File.
If you examine analysis results and then conclude that a quarantined file is non-malicious, you can release it from the quarantine folder. A released file is returned to its original network share location for full access and use, and ownership and permissions for the file are assigned to the user who released the file from the quarantine. The file is also put on an internal whitelist, so it will not be marked as malicious the next time it is analyzed.
When you release a quarantined object, the MD5 checksum of the file is added to a whitelist to prevent the file from being quarantined on subsequent scans.
You can delete a file from the quarantine folder, which permanently removes it from both the network share and the quarantine folder. If you determine that an MD5 was detected as a false-positive event, you can suppress it from being marked as malicious. All records matching that MD5 will be marked as non-malicious.
The File Protect appliance provides detailed information about malicious files and the malware they contain.
The Show Quarantined Files page lists the malicious files that were quarantined after analysis. See Managing Quarantines Using the Web UI on the facing page.
The File Analysis page provides details about the malware that was detected in quarantined files. See Viewing Malware Using the Web UI.
The show file-analysis CLI command displays malware statistics. See Viewing Malware Using the CLI.
The show submission CLI command displays statistics about the number of malware submissions that were analyzed and the number submitted per minute. The show submission malicious command displays statistics about the malware submissions that are marked as malicious. See Viewing Malware Submissions Using the CLI.
For details about each show submission command, refer to the FireEye CLI Reference.
Managing Quarantines
Quarantine management tasks include viewing quarantined files, releasing and deleting files that you determined are safe from quarantine shares, and suppressing MD5s that you determine to be false-positive events.
Prerequisites
Analyst or Administrator access to release and delete quarantined files
Operator or Administrator access to suppress MD5s
Monitor, Analyst, or Administrator access to view quarantined files
Monitor, Analyst, Operator, or Administrator access to view file analysis results
Managing Quarantines Using the Web UI
Use the Show Quarantined Files page to view and manage quarantined files. This page contains scan analysis alerts and details, and lists all quarantine folders and the shares to which they are mapped. It provides links to the quarantine file and associated MD5 checksum for further forensic analysis.
If a quarantined file is deleted, it will remain in the historical view of the page. Quarantine files that are deleted cannot be restored.
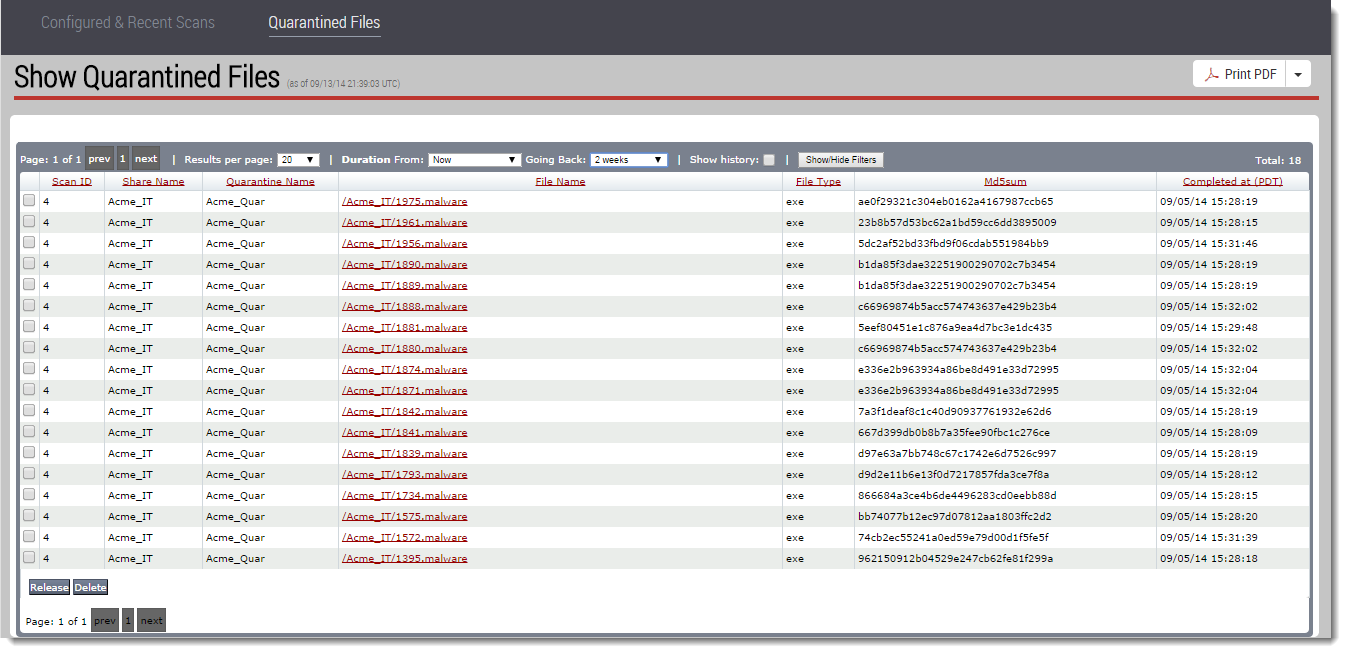
To manage quarantined files:
Do one of the following to open the Show Quarantined Files page:
Click malicious file links from the Scans page or Dashboard.
Click the Scans tab and then click Quarantined Files.
To release a quarantined file:
Select the checkbox for the file.
Click Release at the bottom of the table.
When prompted, click Yes to confirm.
To delete a quarantined file:
Select the checkbox for the file.
Click Delete at the bottom of the table.
When prompted, click Yes to confirm.
Managing Quarantines Using the CLI
Use the command in this section to prevent an MD5 that was detected as a false-positive event from being marked as malicious.
To suppress an MD5:
Enable the CLI configuration mode:
hostname > enable hostname # configure terminalSuppress the MD5:
hostname (config) # file-analysis suppress md5 md5IDwhere md5ID is the MD5 sum.
Save your changes:
hostname (config) # write memory
Example
The following example suppresses a false-positive event from being marked as malicious:
hostname (config) # file-analysis suppress md5 84a17923a66a59eb245dddffd625246e9
Malware (s) 84a17923a66a59eb245dddffd625246e9 suppressedViewing Malware
You can view malicious files and examine the malware in them.
Prerequisites
Monitor, Analyst, or Administrator access for the Web UI
Monitor, Analyst, Operator, or Administrator access for the CLI
Viewing Malware Using the Web UI
Use the File Analysis page to view and drill into details about malicious files.
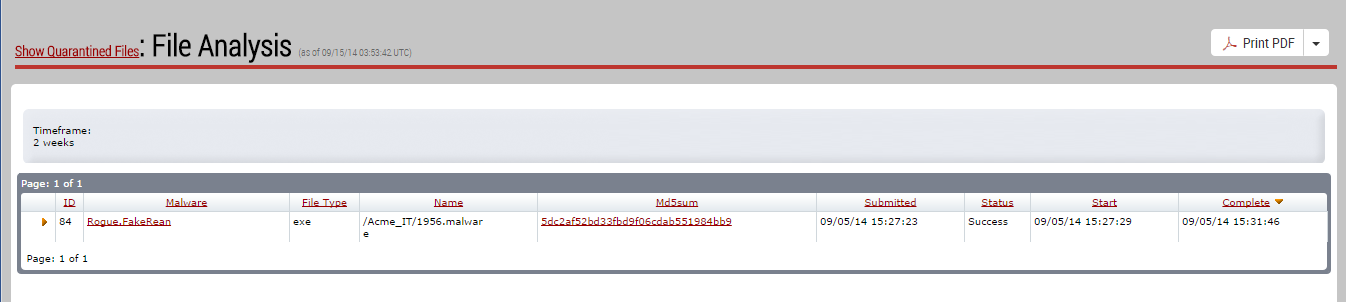
The following columns are included on the page:
ID—The Malware Analysis ID number.
Malware—The type of malware detected: Malware.Binary, Exploit, Trojan, Worm, Infection Match, and so on.
File Type—A specific file type such as EXE, PDF, DOC, PPT, XLS, GIF, JPG, SWF, MOV, QT, MP3, MP3, ASF, ZIP, DLL, or UNK (UNKNOWN).
Name—Name of the file determined to be malicious; for example: menu4.swf.
Md5sum—The message-digest algorithm5 checksum derived from a cryptographic hash function that produces a 128-bit (16-byte) hash value used to check data integrity, expressed as a 32-digit hexadecimal number in the File Protect appliance.
Submitted—The date and time at which the file scan was submitted for analysis.
Status—The status of the file scan analysis.
Start—The date and time at which the file scan was submitted for analysis.
Complete—The date and time the malware analysis was completed.
To view malicious file details:
Click a link in the File Name column of the Show Quarantined Files page.
In the File Analysis page, click the orange arrow to expand the file details.
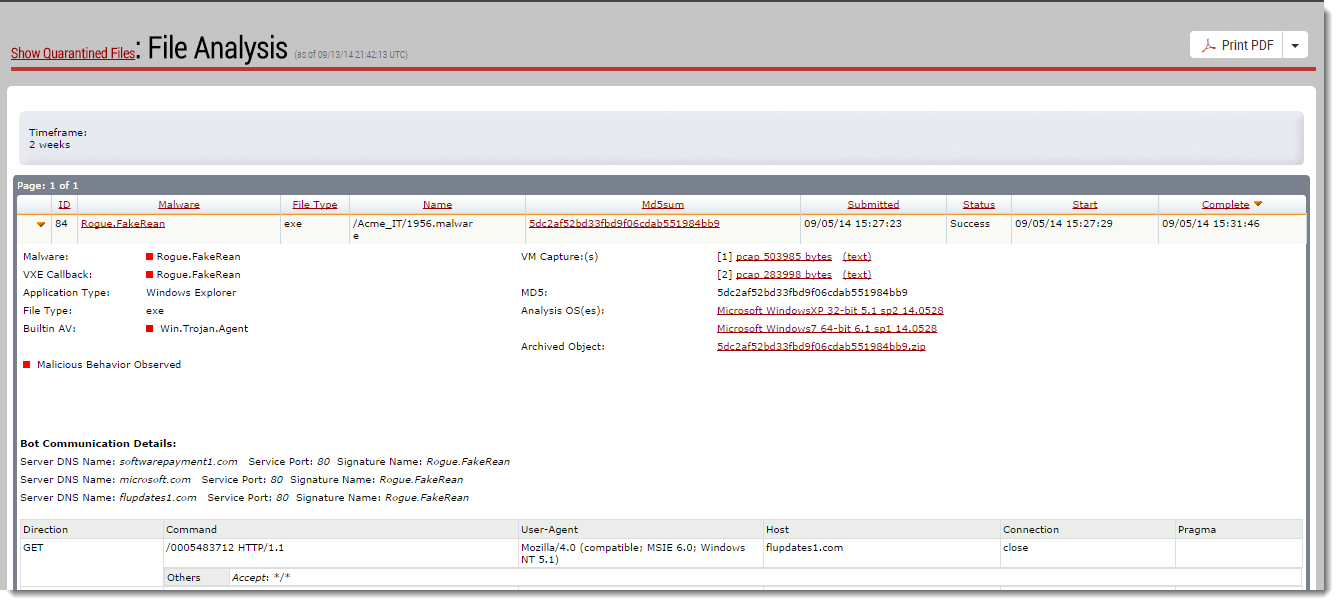
3. For compressed (archive) files types (RAR and ZIP), there are two sets of arrows. Click both arrows to see scan results for the files within the archive file.
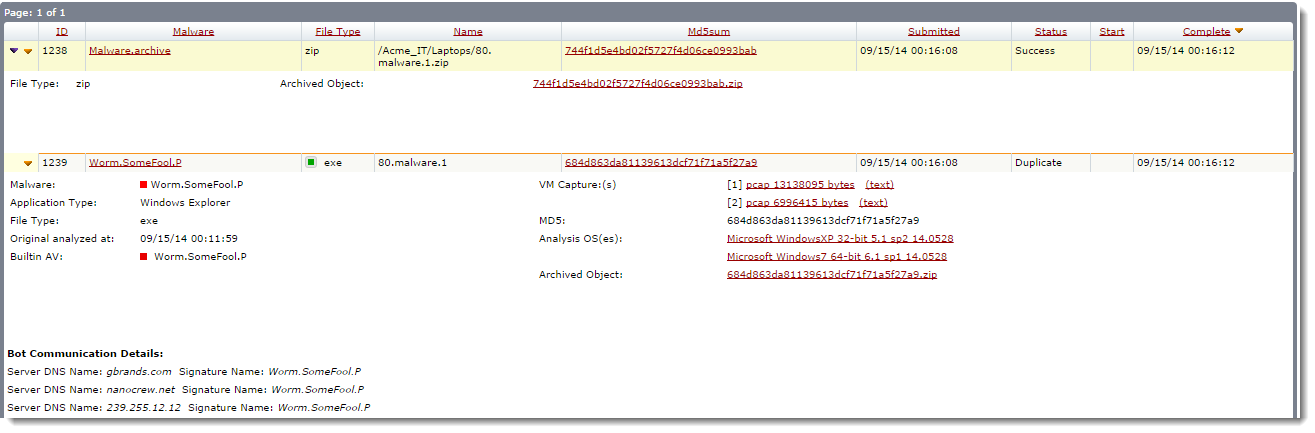
Understanding Malicious File Results
The status of compressed file types matches the status of the contained file with the most severe status. For example, a ZIP file contains one file with the status Success and one file with the status Submit Disabled. Because Submit Disabled is the more severe status, the ZIP file will also be marked as Submit Disabled. An exception to this is when the most severe status for a contained file is Duplicate; in this case, the ZIP or RAR file will be marked as Success, not Duplicate.
Red, underlined text in the tables and hierarchical pages indicate active hyperlinks. The results details are always displayed in three categories: Event Details, OS Changes Details, and Additional Information Details (Static File Analysis Tools). Each link displays detailed forensics information about malware behavior and OS changes caused by the attack.
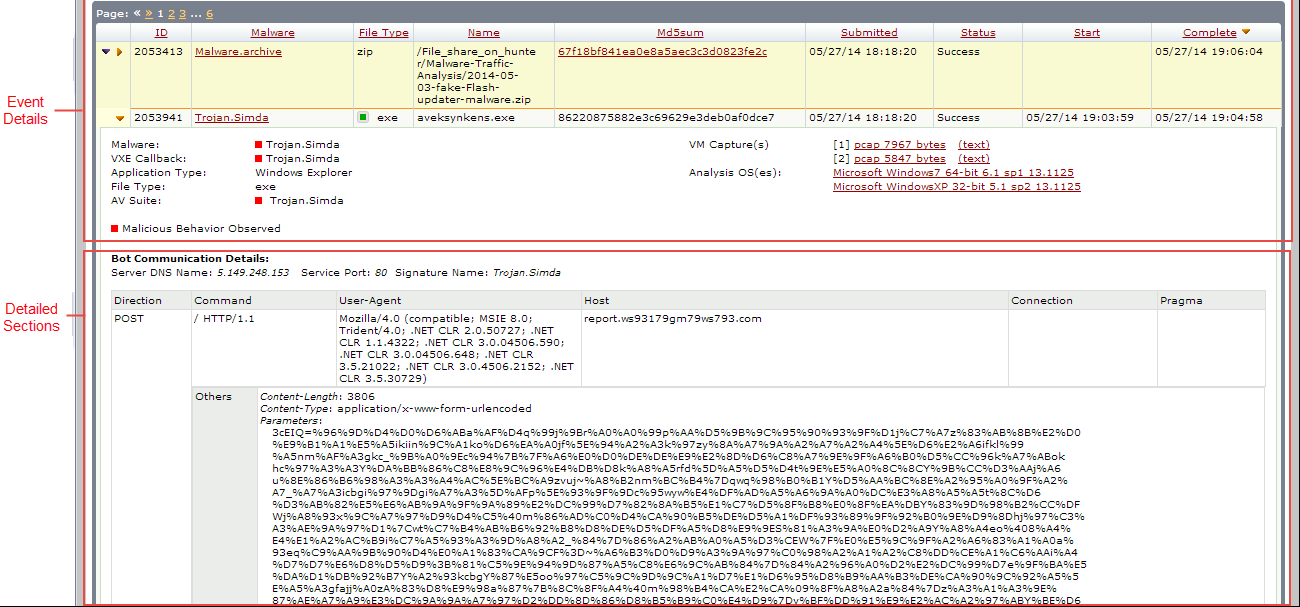
Scan Results - Event Details and Examples
Detected malware type
Example: Malware: Malware.Binary.Pdf
File type of the malware
Example: SWF
Whether suspicious behavior was observed or confirmed
Example: Suspicious Behavior Observed
Application type used to analyze the malware
Example: Adobe PDF 7.0
Callback attempts captured by the VM, including any communication attempts made by the malware
Example: VM Capture pcap < 24> bytes (text link)
Guest Image OS used during the analysis
Example: Analysis OS: Microsoft Windows XP Professional 5.1 SP3
YARA rules used to detect the malware (only if YARA is enabled)
Local AV or AV-Suite used to detect the malware (if enabled)
Examples: Clam, Sophos, VirusTotal
Archived file (zip, rar, 7zip, TNEF) analysis containing detected malware
Example: Data.encoding.zip

Sophos is enabled when the license is installed; there is no further configuration required for integration with the File Protect appliance.
Scan Results - OS Anomalies and Changes Details and Examples
Detected malware type
Example: OS Change Details: (Path/Message/Protocol//Hostname/Qtype/ListenPort, and so on)
Scan Results - Static File Information Tools - Details and Examples
Static analysis tools used to detect the malware
Examples: Exiftool 12345.malware, fe_peinfo.py, fesigcheck
Viewing Malware Using the CLI
Use the command in this section to view analysis statistics using the CLI.
To view malware statistics:
Enable the CLI enable mode.
hostname > enableView the summary of a file analysis.
hostname # show file-analysis Total Objects Submitted : 24978 Objects Analyzed : 24978 Objects identified as Malicious : 15229 - VM verified : 15175 - Duplicate to VM verified : 54 - Known checksum match : 0 Total events : 97165 vm-signature-match events : 32577 os-change-anomaly events : 30626 checksum-match events : 25083 vm-outbound-comm events : 8879 Objects break down by system status, Total : 24978 Submitted for VM analysis : 20259 VM Submit Error : 20 Duplicate : 3657 Static Analysis Only : 5 Aborted
Viewing Malware Submissions Using the CLI
Use the show submission command to view detailed statistics about the number of malware submissions that were analyzed and the number submitted per minute during the past 24 hours.
Use the show submission malicious command to view detailed statistics about the malware submissions that are marked as malicious.
The results of both types of analysis are displayed on the File Analysis page in the Web UI.
To view statistics of malware submissions:
Enable the CLI enable mode.
hostname > enableView the summary of malware submissions.
hostname # show submission Runtime Submission Stats: Total queued submission : 91 Total running submissions : 122 Total DA running submissions : 61 Cumulative Stats in timespan 2015-08-25 11:01:57 to 2015-08-26 11:01:57 Rate/minute Submissions : 1846 : 1.282 Completed submissions : 1721 : 1.195 Malicious submission count : 1414 : 0.982
To view statistics of the malware submissions that are marked as malicious:
Enable the CLI enable mode.
hostname > enableView the summary of the malware submissions that are marked as malicious.
hostname # show submission malicious Submission ID: 11585 Malware ID : 12141 md5sum : 32bfb50099749f73ff915fcc84e6a4e0 File type : dll Status : success Malicious : YES Analysis Object ID : 10478 Analysis Object Name : /data/ma/cifs-perf-01/Windows/Microsoft.NET/Framework/v4.0.30319/mscordacwks.dll Analysis File Type : dll md5sum : 32bfb50099749f73ff915fcc84e6a4e0 Static Analysis weight : 100 Dynamic Analysis jobs : 2 Static Analysis jobs : 4 SA engine weight : 100
SA job ID : 41808
SA sub-engine name : pe_sign_whitelist
SA sub-engine signature : Microsoft Corporation
SA sub-engine weight : 0
SA engine weight : 100
SA job ID : 41810
SA sub-engine name : malware_intrinsic_analysis
SA sub-engine signature : Dropper.DTI.DroppedFiles
SA sub-engine weight : 100
Job ID : 15160
OS name : winxp-sp3
Application name : RunDLL 1.0
OS Changes weight : 0
CNC Match weight : 0
Assigned time : 2015-09-11 01:39:42.340373
Complete time : 2015-09-11 01:42:11.485682
Job runtime : 00:02:29.145309
Job ID : 15161
OS name : win7x64-sp1
Application name : RunDLL 1.0
OS Changes weight : 0
CNC Match weight : 0
Assigned time : 2015-09-11 01:39:42.425965
Complete time : 2015-09-11 01:42:11.512021
Job runtime : 00:02:29.086056
Extracting Archived Objects
In addition to the MD5 checksum data, all files or OS objects that were created or modified during MVX detonation for a file analysis job are available as a zipped collection, along with a full memory dump.

To view and extract a VM memory and object dump for a selected file analysis job:
Open the File Analysis page as described in Viewing Malware Using the Web UI.
Click the orange arrow to expand the malware information.
Click the Archived Object link to download the .zip file.
Open the .zip file to extract its contents. When prompted for a password, type "infected."
Reports
This chapter describes how to access specific information about reports:
About Reports
After the malware has been analyzed, the File Protect appliance can generate alert reports based on the results of the malware analysis.
Two types of customized reports can be generated and delivered automatically on a schedule from the Reports page.
Alert Details
File Executive Summary
Reports can be produced with Concise, Normal, or Extended level of detail. When the report is generated, the File Protect appliance places a copy of the report in the data/reports directory. You can copy the report to your local machine. The report can be generated and delivered automatically through email. The reports are removed when the size of the reports directory exceeds 100 MB.
Task List for Managing Reports
Complete the steps for managing reports in the following order.
Log in to the Web UI or CLI.
Configure the SMTP server or domain. You must also specify the email address of the report recipient. These settings are used whenever you want to email reports. For details about configuring these report settings, refer to the File Protect System Administration Guide.
Generate and verify the customized reports.
Schedule reports for automatic generation and email distribution.
Verify the configuration for the report schedule.
Alert Details Report
You can generate and schedule an Alert Details report by using the appliance Web UI or CLI:
The Alert Details report displays all alert details for a malware object alert type over the time period selected, and includes a detailed summary of malware activity. You can request the report to be output as a CSV file, JSON file, XML file, or text file.
Prerequisites
Administrator or Operator access to the File Protect appliance.
Generating an Alert Details Report Using the Web UI
Use the Generate Report page to generate a consolidated Alert Details report.
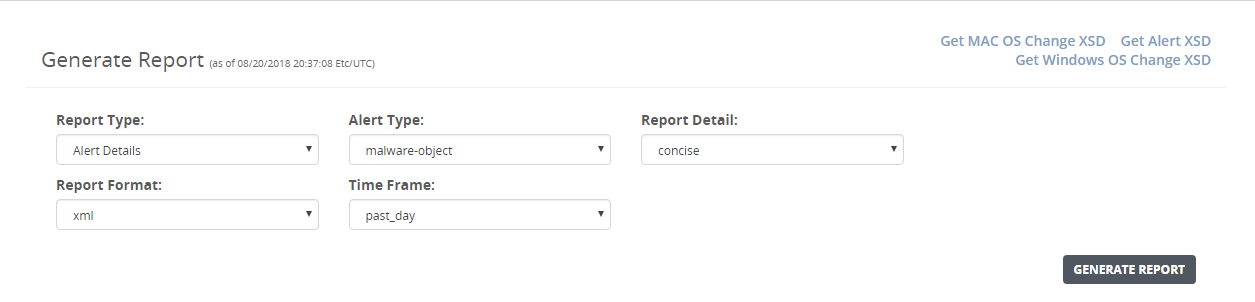
To generate an Alert Details report:
In the Web UI, choose Reports > Static Reports.
In the Report Type drop-down menu, select Alert Details.
In the Alert Type drop-down menu, select malware-object as the alert type:
In the Report Detail drop-down menu, select the level of detail:
concise — Basic information, such as alert type, ID, source IP address, malware name, hostname, and alert URL.
normal — Concise information plus OS changes, callback details, and malware details, if available.
extended — Normal information plus data-theft information (if any) and static analysis details. This format provides all details about files and objects modified during analysis.
In the Report Format drop-down menu, select the output format for the report:
xml — Generate the report in XML format.
json — Generate the report in JSON format.
csv — Generate the report in CSV format.
text — Generate the report in text format.
In the Time Frame drop-down menu, select the time period for this report:
past day — Report covers analysis generated during the past 24 hours.
past week — Report covers analysis generated during the past 7 days.
past month — Report covers analysis generated during the past 1 month.
past 3 months — Report covers analysis generated during the past 3 months.
between — Report covers analysis generated between the specified From date and time and the specified To date and time.
Click Generate Report. The generated report is added to the top of the generated report list.
When the report generation is complete, the generated report appears in the Generated Reports table.
(Optional) Export the XSD files. These files describe the structure of the Alert Details report.
To export the Windows OS Change XSD, click the Get Windows OS Change XSD link at the top right side of the page.
To export the MAC OS Change XSD, click the Get MAC OS Change XSD link at the top right side of the page.
To export the Alert XSD, click the Get Alert XSD link at the top right side of the page.
To delete a generated Alert Details report:
In the Web UI, choose Reports > Static Reports.
In the Generated Reports table, locate the generated Alert Details report you want to delete.
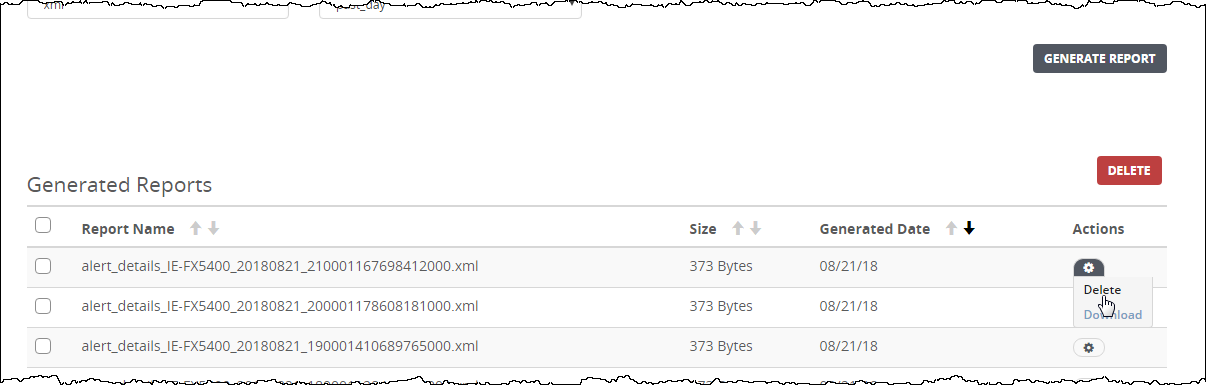
Click the action icon (
 ) in the Action column.
Click Delete. A dialog box prompts you to confirm your changes.
Click OK.
An Alert Details report is removed. The following message appears:
Generating an Alert Details Report Using the CLI
Use the commands in this section to generate a consolidated Alert Details report.
Before a report can be generated and sent through email, ensure that the SMTP server or domain is configured. You must also specify the email address of the report recipient. For details about configuring these report settings, refer to the File Protect System Administration Guide.
To generate an Alert Details report:
Go to CLI configuration mode.
hostname > enable hostname # configure terminalSpecify an Alert Details report.
hostname (config) # report generate type Alert_Details
Specify a report format.
To generate a report in .xml format:
hostname (config) # report generate type Alert_Details report_format xmlTo generate a report in .json format:
hostname (config) # report generate type Alert_Details report_format jsonTo generate a report in .csv format:
hostname (config) # report generate type Alert_Details report_format csvTo generate a report in text format:
hostname (config) # report generate type Alert_Details report_format text
Specify the level of detail for the report.
To send basic information:
hostname (config) # report generate type Alert_Details report_format <report_format> report_detail conciseTo send detailed information and abstracts:
hostname (config) # report generate type Alert_Details report_format <report_format> report_detail normalTo send detailed information and abstracts about files and objects:
hostname (config) # report generate type Alert_Details report_format <report_format> report_detail extended
Specify a malware object as the alert type.
hostname (config) # report generate type Alert_Details report_format <report_format> report_detail <report_detail> alert_type malware-object
6. Specify the time period for this report.
To specify for the past day:
hostname (config) # report generate type Alert_Details report_format <report_format> report_detail <report_detail> alert_type <alert_type> time_frame past_dayTo specify for the past week:
hostname (config) # report generate type Alert_Details report_format <report_format> report_detail <report_detail> alert_type <alert_type> time_frame past_weekTo specify for the past month:
hostname (config) # report generate type Alert_Details report_format <report_format> report_detail <report_detail> alert_type <alert_type> time_frame past_monthTo specify for the past three months:
hostname (config) # report generate type Alert_Details report_format <report_format> report_detail <report_detail> alert_type <alert_type> time_frame past_3_monthsTo specify the range between the start and end dates:
hostname (config) # report generate type Alert_Details report_format <report_format> report_detail <report_detail> alert_type <alert_type> time_frame between start_date yyyy/mm/dd start_time hh:mm:ss end_date yyyy/mm/dd end_time hh:mm:ss
7. Specify the delivery method for the report. The default delivery is email.
To deliver the report through email:
hostname (config) # report generate type Alert_Details report_format <report_format> report_detail <report_detail> alert_type <alert_type> time_frame <time_frame> transport emailTo deliver the report as a file:
hostname (config) # report generate type Alert_Details report_format <report_format> report_detail <report_detail> alert_type <alert_type> time_frame <time_frame> transport file
The following example shows how to deliver an Alert Details report with normal detail in .csv format for malware object alert types that were found during the past month:
hostname (config) # report generate type Alert_Details report_format csv report_detail normal alert_type malware-object time_frame past_month transport fileExecute report command. Check email or WebUI for report.
Scheduling an Alert Details Report Using the Web UI
Use the Schedule Report page to generate an Alert Details report on a schedule and send email notifications automatically.
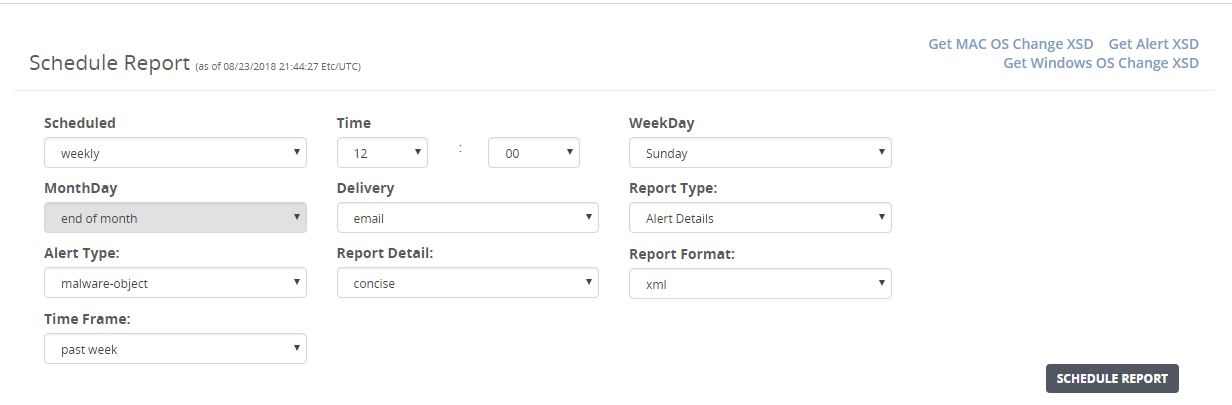
Before you can schedule an Alert Details report to be generated and sent through email, ensure that the SMTP server or domain is configured. You must also specify the email address of the report recipient. For details about configuring these report settings, refer to the File Protect System Administration Guide.
To schedule an Alert Details report for automatic generation and email distribution:
In the Web UI, choose Reports > Schedule Reports.
In the Scheduled drop-down menu, set the time frequency:
hourly
daily
weekly
monthly
In the Time drop-down menu, set the time of day in hours and minutes (00:00).
If you selected a weekly report, specify the report day of the week in the WeekDay field.
If you selected a monthly report, specify the report day of the month in the MonthDay field.
In the Delivery drop-down menu, specify the delivery method. The default delivery is email.
email—Deliver the report as a file attached to email.
file—Deliver the report as a file linked from the Web UI.
In the Report Type drop-down menu, select Alert Details.
In the Alert Type drop-down menu, select malware-object as an alert type.
In the Report Detail drop-down menu, select the level of detail:
concise—Basic information, such as alert type, ID, source IP address, malware name, hostname, and alert URL.
normal—Concise information plus OS changes, callback details, and malware details, if available.
extended—Normal information plus data-theft information (if any) and static analysis details. This format provides all details about files and objects modified during analysis.
In the Report Format drop-down menu, select the output format for the report:
xml—Write the report to an XML file.
json—Write the report to a JSON file.
csv—Write the report to a CSV file.
text—Write the report to a text file.
In the Time Frame drop-down menu, select the time period for this report generation:
past day—Report covers analysis generated during the past 24 hours.
past week—Report covers analysis generated during the past 7 days.
past month—Report covers analysis generated during the past 1 month.
past 3 month—Report covers analysis generated during the past 3 months.
Click Schedule Report. The scheduled report is added to the top of the scheduling list.
(Optional) Export the XSD files. These files describe the structure of the Alert Details report.
To export the Windows OS Change XSD, click the Get Windows OS Change XSD link at the top right side of the page.
To export the MAC OS Change XSD, click the Get MAC OS Change XSD link at the top right side of the page.
To export the Alert XSD, click the Get Alert XSD link at the top right side of the page.
To delete a scheduled Alert Details report:
In the Web UI, choose Reports > Schedule Reports.
In the table, select the checkbox of a scheduled Alert Details report you want to delete.
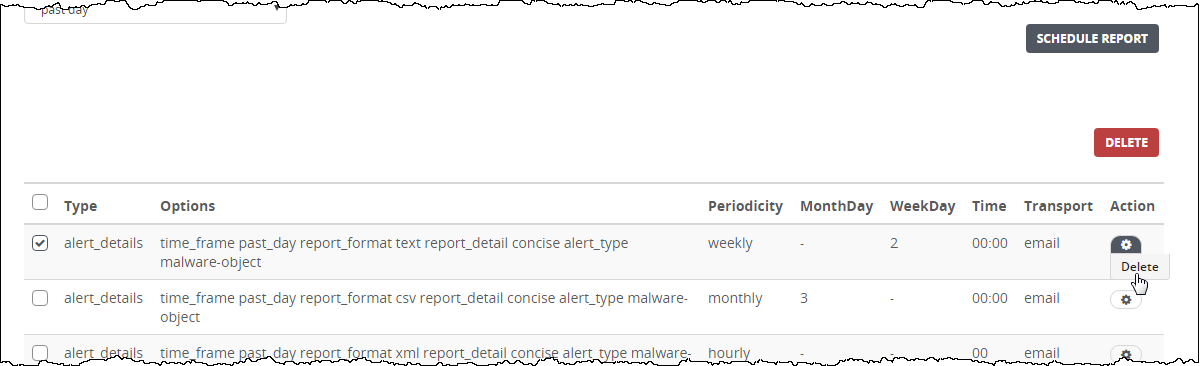
Click the action icon (
 ) in the Action column.
Click Delete. A dialog box prompts you to confirm your changes.
Click OK.
The Alert Details report is removed from the schedule. The following message appears:
Close the message.
Scheduling an Alert Details Report Using the CLI
Use the commands in this section to schedule a consolidated Alert Details report.
Before you can schedule an Alert Details report to be generated and sent through email, ensure that the SMTP server or domain is configured. You must also specify the email address of the report recipient. For details about configuring these report settings, refer to the FireEye System Administration Guide.
To schedule an Alert Details report for automatic generation and email distribution:
Go to CLI configuration mode.
hostname > enable hostname # configure terminalSpecify how often to run the report.
To update daily:
hostname (config) # report schedule run daily at <hh:mm>where <hh:mm> specifies the time to start based on a 24-hour clock.
To update hourly:
hostname (config) # report schedule run hourly at <mm>
where <mm> is the number of minutes within the hour.
To update monthly:
hostname (config) # report schedule run monthly on {<date> | end of month} at <hh:mm>
where:
<date> is the day of the month when the update should occur.
<hh:mm> specifies the time to start based on a 24-hour clock.
To update weekly:
hostname (config) # report schedule run weekly every <day> at <hh:mm>
where:
<day> is the day of the week the when update should occur.
<hh:mm> specifies the time to start based on a 24-hour clock.
3. Specify an Alert Details report.
hostname (config) # report schedule run <frequency> type Alert_Details
4. Specify a report format.
To generate a report in .xml format:
hostname (config) # report schedule run <frequency> type Alert_Details report_format xml
To generate a report in .json format:
hostname (config) # report schedule run <frequency> type Alert_Details report_format json
To generate a report in .csv format:
hostname (config) # report schedule run <frequency> type Alert_Details report_format csv
To generate a report in text format:
hostname (config) # report schedule run <frequency> type Alert_Details report_format text
5. Specify the level of detail for the report.
To send basic information:
hostname (config) # report schedule run <frequency> Alert_Details report_format <report_format> report_detail concise
To send detailed information and abstracts:
hostname (config) # report schedule run <frequency> type Alert_Details report_format <report_format> report_detail normal
To send detailed information and abstracts about files and objects:
Specify the malware object as the alert type.
hostname (config) # report schedule run <frequency> Alert_Details report_format <report_format> report_detail <report_detail> alert_type malware-objectSpecify the time period for the reports.
To specify for the past day:
hostname (config) # report schedule run <frequency> type Alert_Details report_format <report_format> report_detail <report_detail> alert_type malware-object time_frame past_dayTo specify for the past week:
hostname (config) # report schedule run <frequency> type Alert_Details report_format <report_format> report_detail <report_detail> alert_type malware-object time_frame past_weekTo specify for the past month:
hostname (config) # report schedule run <frequency> type Alert_Details report_format <report_format> report_detail <report_detail> alert_type malware-object time_frame past_monthTo specify for the past three months:
hostname (config) # report schedule run <frequency> type Alert_Details report_format <report_format> report_detail <report_detail> alert_type malware-object time_frame past_3_months
Specify the delivery method for the report. The default delivery is email.
To deliver the report through email:
hostname (config) # report schedule run <frequency> type Alert_Details report_format <report_format> report_detail <report_detail> alert_type malware-object time_frame <time_frame> transport emailTo deliver the report as a file:
hostname (config) # report schedule run <frequency> type Alert_Details report_format <report_format> report_detail <report_detail> alert_type malware-object time_frame <time_frame> transport file
Verify the configuration for the report schedule.
hostname (config) # show report schedulePeriodicity MonthDay WeekDay Time Transport Command 3 weekly - Sun 12:00 file common/Alert_Details report_format xml time_frame past_weekTotal reporting jobs scheduled: 1.
File Executive Summary Report
You can generate and schedule a File Executive Summary report by using the appliance Web UI or CLI:
The File Executive Summary report shows the highest number of files, filtered by malware events or file types for the specified reporting period. You can request the report to be output as a PDF file. The top malware detected bar chart is based on the malware event counts found in malicious files. The top file types detected pie chart is based on the percentage breakdown of the type of scanned file objects (exe, pdf, swf, doc, and so on).
Prerequisites
Administrator or Operator access to the File Protect appliance.
Generating a File Executive Summary Report Using the Web UI
Use the Generate Report page to generate a consolidated File Executive Summary report.

To generate a report:
In the Web UI, choose Reports > Static Reports.
In the Report Type drop-down menu, select File Executive Summary.
In the Report Format drop-down menu, select the pdf output format to write the report to an Adobe PDF file.
In the Time Frame drop-down menu, select the time period for this report.
past week—Report covers analysis generated during the past 7 days.
past month—Report covers analysis generated during the past 1 month.
past 3 months—Report covers analysis generated during the past 3 months.
between—Report covers analysis generated between the specified From date and time and the specified To date and time.
Click Generate Report. The generated report is added to the top of the generated report list.
When the report generation is complete, the generated report appears in the Generated Reports table.
(Optional) Export the XSD files. These files describe the structure of the Alert Details report.
To export the Windows OS Change XSD, click the Get Windows OS Change XSD link at the top right side of the page.
To export the MAC OS Change XSD, click the Get MAC OS Change XSD link at the top right side of the page.
To export the Alert XSD, click the Get Alert XSD link at the top right side of the page.
To delete a generated File Executive Summary report:
In the Web UI, choose Reports > Static Reports.
In the Generated Reports table, locate the generated File Executive Summary report you want to delete.
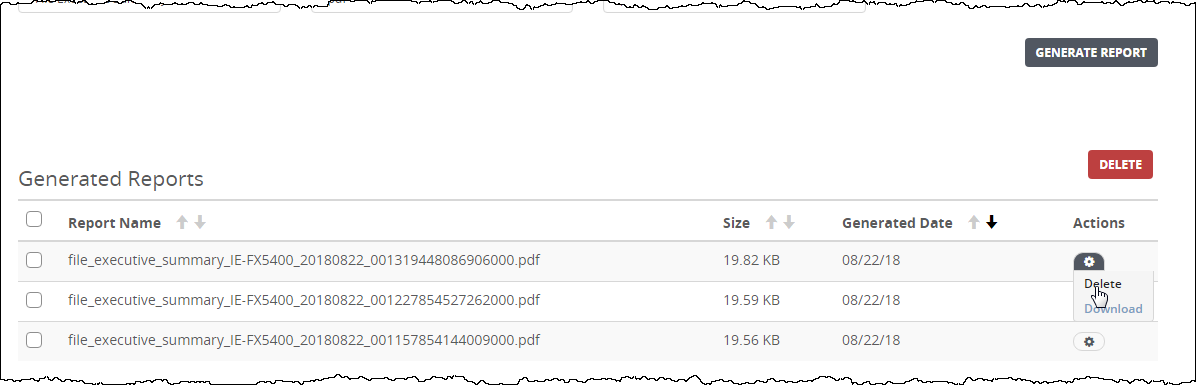
Click the action icon ( ) in the Action column.
Click Delete. A dialog box prompts you to confirm your changes.
Click OK.
A File Executive Summary report is removed. The following message appears:
Generating a File Executive Summary Report Using the CLI
Use the commands in this section to generate a consolidated File Executive Summary report.

Before a report can be generated and sent through email, ensure that the SMTP server or domain is configured. You must also specify the email address of the report recipient. For details about configuring these report settings, refer to the File Protect System Administration Guide.
To generate a File Executive Summary report:
Go to CLI configuration mode.
hostname > enable hostname # configure terminalSpecify a File Executive Summary report.
hostname (config) # report generate type file_executive_summaryWrite the report to an Adobe PDF file.
hostname (config) # report generate type file_executive_summary report_ format pdf
Specify the time period for this report.
To specify for the past week:
hostname (config) # report generate type file_executive_summary report_format pdf time_frame past_weekTo specify for the past month:
hostname (config) # report generate type file_executive_summary report_format pdf time_frame past_monthTo specify for the past three months:
hostname (config) # report generate type file_executive_summary report_format pdf time_frame past_3_monthsTo specify the range between the start and end dates:
hostname (config) # report generate type file_executive_summary report_format pdf time_frame between start_date yyyy/mm/dd start_time hh:mm:ss end_date yyyy/mm/dd end_time hh:mm:ss
Specify the delivery method for the report. The default delivery is email.
To deliver the report through email:
hostname (config) # report generate type file_executive_summary report_format pdf time_frame <time_frame> transport emailTo deliver the report as a file:
hostname (config) # report generate type file_executive_summary report_format pdf time_frame <time_frame> transport file
The following example shows how to deliver a File Executive Summary as a .pdf file covering the past month:
hostname (config) # report generate type file_executive_summary report_format pdf time_frame past_month transport fileExecute report command. Check email or WebUI for report.
Scheduling a File Executive Summary Report Using the Web UI
Use the Schedule Report page to generate a File Executive Summary report on a schedule and send email notifications automatically.
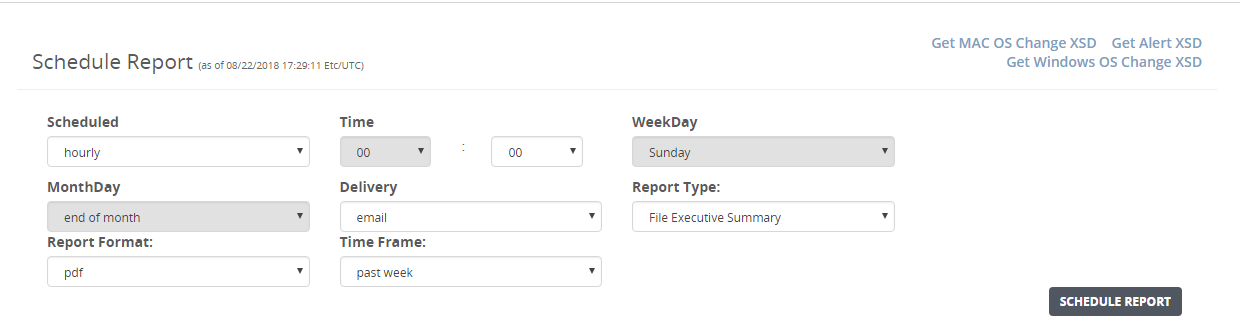

Before you can schedule a File Executive Summary report to be generated and sent through email, ensure that the SMTP server or domain is configured. You must also specify the email address of the report recipient. For details about configuring these report settings, refer to the File Protect System Administration Guide.
To schedule a File Executive Summary report for automatic generation and email distribution:
In the Web UI, choose Reports > Schedule Reports.
In the Scheduled drop-down menu, set the time frequency:
hourly
daily
weekly
monthly
In the Time drop-down menu, set the time of day in hours and minutes (00:00).
If you selected a weekly report, specify the report day of the week in the WeekDay field.
If you selected a monthly report, specify the report day of the month in the MonthDay field.
In the Delivery drop-down menu, specify the delivery method. The default delivery is email.
email—Deliver the report as a file attached to email.
file—Deliver the report as a file linked from the Web UI.
In the Report Type drop-down menu, select File Executive Summary.
In the Report Format drop-down menu, select the pdf output format to write the report to an Adobe Acrobat PDF file.
In the Time Frame drop-down menu, select the time period for this report generation:
past week—Report covers analysis generated during the past 7 days.
past month—Report covers analysis generated during the past 1 month.
past 3 month—Report covers analysis generated during the past 3 months.
Click Schedule Report. The scheduled report is added to the top of the scheduling list.
(Optional) Export the XSD files. These files describe the structure of the File Executive Summary report.
To export the Windows OS Change XSD, click the Get Windows OS Change XSD link at the top right side of the page.
To export the MAC OS Change XSD, click the Get MAC OS Change XSD link at the top right side of the page.
To export the Alert XSD, click the Get Alert XSD link at the top right side of the page.
To delete a scheduled File Executive Summary report:
In the Web UI, choose Reports > Schedule Reports.
In the table, select the checkbox of a scheduled File Executive Summary report you want to delete.
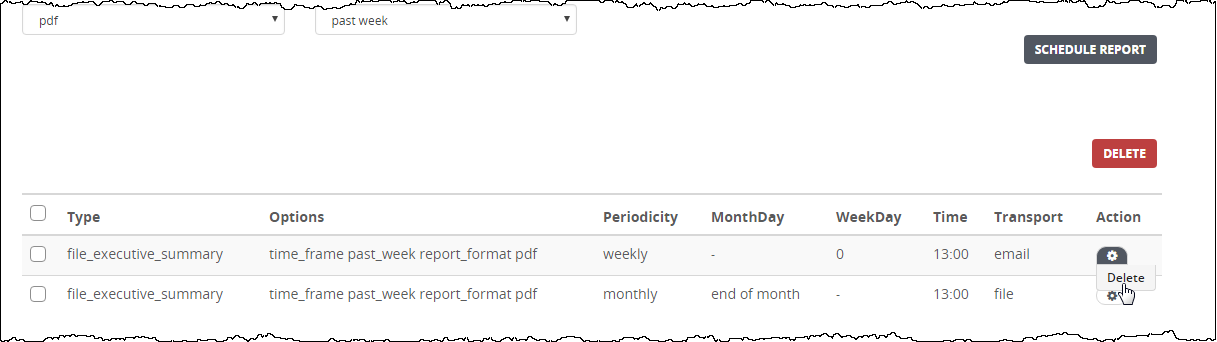
Click the action icon ( ) in the Action column.
Click Delete. A dialog box prompts you to confirm your changes.
Click OK.
The File Executive Summary report is removed from the schedule. The following message appears:
6. Close the message.
Scheduling a File Executive Summary Report Using the CLI
Use the commands in this section to schedule a consolidated File Executive Summary report.

Before you can schedule a File Executive Summary report to be generated and sent through email, ensure that the SMTP server or domain is configured. You must also specify the email address of the report recipient. For details about configuring these report settings, refer to the FireEyeSystem Administration Guide.
To schedule a File Executive Summary report for automatic generation and email distribution:
Go to CLI configuration mode.
hostname > enable hostname # configure terminalSpecify how often to run the report.
To update daily:
hostname (config) # report schedule run daily at <hh:mm>where <hh:mm> specifies the time to start based on a 24-hour clock.
To update hourly:
hostname (config) # report schedule run hourly at <mm>where <mm> is the number of minutes within the hour.
To update monthly:
hostname (config) # report schedule run monthly on {<date> | end of month} at <hh:mm>where:
<date> is the day of the month when the update should occur.
<hh:mm> specifies the time to start based on a 24-hour clock.
To update weekly:
hostname (config) # report schedule run weekly every <day> at <hh:mm>where:
<day> is the day of the week the when update should occur.
<hh:mm> specifies the time to start based on a 24-hour clock.
Specify a File Executive Summary report.
hostname (config) # report schedule run <frequency> type file_executive_summaryWrite a report in .pdf format.
hostname (config) # report schedule run <frequency> type file_executive_summary report_format pdfSpecify the time period for the reports.
To specify for the past week:
hostname (config) # report schedule run <frequency> type file_executive_summary report_format pdf time_frame past_weekTo specify for the past month:
hostname (config) # report schedule run <frequency> type file_executive_summary report_format pdf time_frame past_monthTo specify for the past three months:
hostname (config) # report schedule run <frequency> type file_executive_summary report_format pdf time_frame past_3_months
6. Specify the delivery method for the report. The default delivery is email.
To deliver the report through email:
hostname (config) # report schedule run <frequency> type file_executive_summary report_format pdf time_frame <time_frame> transport emailTo deliver the report as a file:
hostname (config) # report schedule run <frequency> type file_executive_summary report_format pdf time_frame <time_frame> transport file
A File Executive Summary report is added to the scheduled list. The following message appears:
......
Configure email recipients for report schedule to take effect.
Created report schedule 1.
7. Verify the configuration for the report schedule.
hostname (config) # show report schedule
Periodicity MonthDay WeekDay Time Transport Command
1 monthly 4 - 11:00 email file_executive_summary report_format pdf time_frame past_week
Total reporting jobs scheduled: 1.Deleting All Generated Reports Using the Web UI
Use the Generated Reports table to delete all the manually generated reports from the reports database on the appliance using the Web UI.
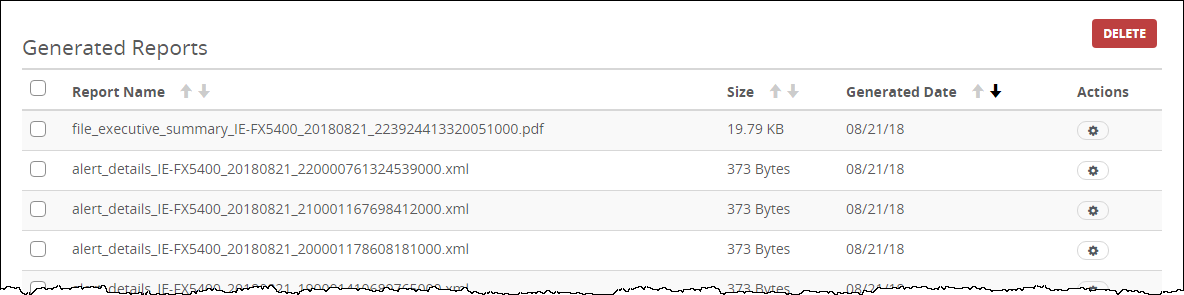
Prerequisites
Log in to the Web UI of the appliance as Administrator or Operator
You have generated one or more reports on the appliance.
To delete all the generated reports from the reports database:
In the Web UI, choose Reports > Static Reports.
The page lists the reports that have already been generated in the reports database.
In the Generated Reports table, select all the reports to delete from the reports database by clicking the checking the Report Name box at the top of the list.
The Delete button changes to Delete nnn Reports showing the number of reports selected for deletion.
Click Delete nnn Reports.
A prompt for confirmation displays. Click OK.
All the generated reports are removed. The following message appears:
The page refreshes to show that the Generated Reports table no longer appears.
Deleting All Scheduled Reports Using the Web UI
Use the Schedule Report table to delete all the scheduled reports from the reports database on the appliance using the Web UI.
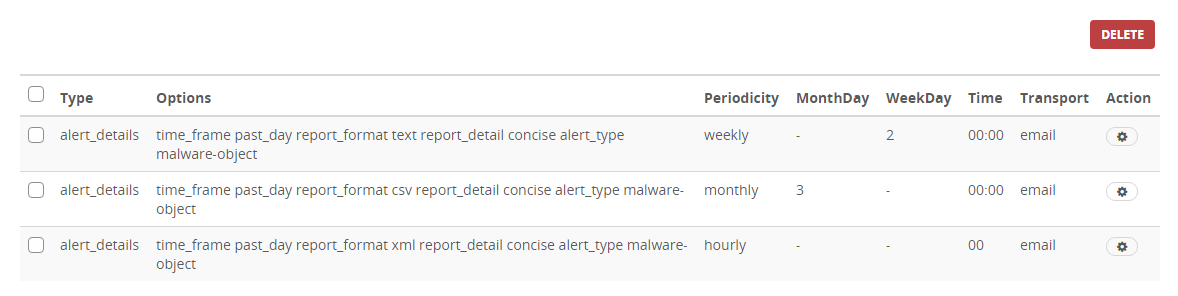
Prerequisites
Log in to the Web UI of the appliance as Administrator or Operator.
You have scheduled one or more reports on the appliance.
To delete all the scheduled reports from the reports database:
In the Web UI, choose Reports > Schedule Reports.
The page lists the reports that have already been scheduled in the reports database.
In the Schedule Report table, select all the reports to delete from the reports database by checking the Type box at the top of the table.
Click Delete.
A prompt for confirmation displays. Click OK.
The scheduled reports are removed. The following message appears:
The page refreshes to show that the Schedule Report table no longer appears.
Close the message.
Deleting Scheduled Reports Using the CLI
Use the CLI commands in this topic to delete scheduled reports from the reports database on the appliance.
To delete scheduled reports from the reports database:
Go to CLI configuration mode.
hostname > enable hostname # configure terminalVerify the report identification number to delete from the reports database.
hostname (config) # show report schedulePeriodicity MonthDay WeekDay Time Transport Command 3 weekly - Sun 12:00 file common/Alert_ Details report_format xml time_frame past_week 4 weekly - Sun 12:00 email file_executive_ summary report_format pdf time_frame past_week Total reporting jobs scheduled: 2.Specify the report identification number you want to delete from the reports database.
hostname (config) # no report schedule <report_number>Verify the status of the report schedule.
hostname (config) # show report scheduleSave your changes.
hostname (config) # write memory
Downloading a Generated Report Using the Web UI
Follow these steps to download a generated report from the appliance to your local desktop using the Web UI.
 You can download a generated report only using the Web UI.
Prerequisites
Log in to the Web UI of the appliance as Administrator or Operator
You have generated one or more reports on the appliance.
To download a generated report:
In the Web UI, choose Reports > Static Reports.
The page lists the reports that have already been generated.
Release 9.0
Downloading a Generated Report Using the Web UI
In the Generated Reports table, locate the report you want to download to your desktop.
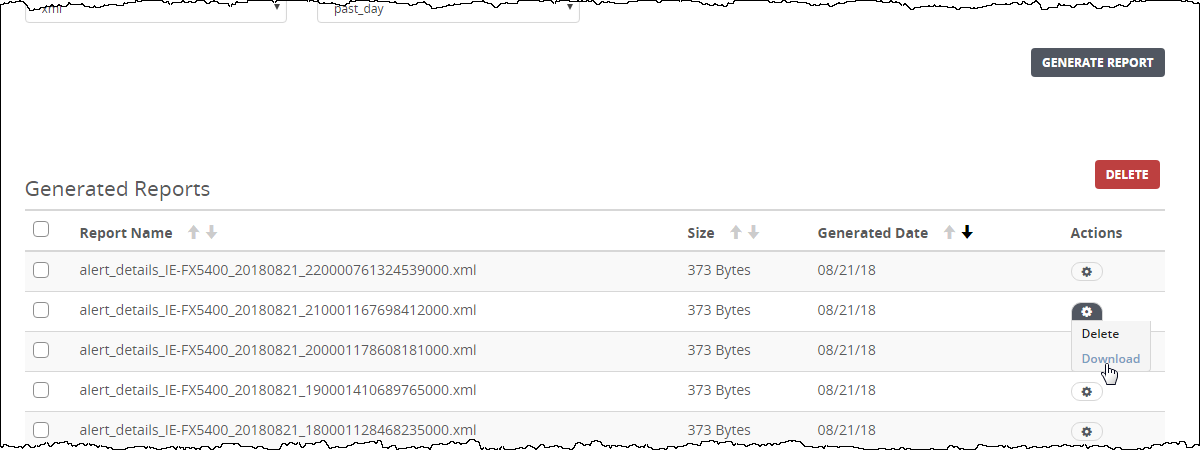
Click the action icon (
 ) in the Action column.
Click Download.