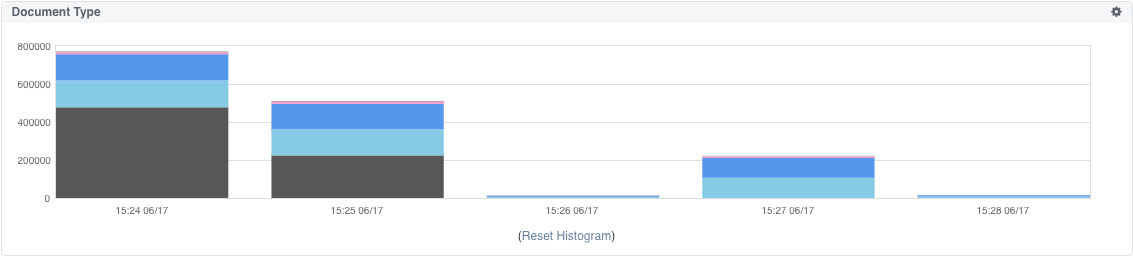
NDR enables you to conduct a query and display the result set chronologically with a Histogram chart. The chart plots the results in chronological order and groups events that are close together in time. For example, the histogram below shows the result set for all doc_values_type within the query results. Each document type is represented by a color band and the results are displayed for a specific time frame. Clicking on the document type allows you to drill down into the results for that type.
From the selected dashboard, click the Add Component button and select Histogram.
Name the widget.
Select the field filter.
Click Add Component to save the histogram widget to your dashboard.
Click the search icon in the Query Bar to run your query and display the results.
Click a document type to drill down into the results for that type.
Click the Reset Histogram link to go back to the original chart.