Trellix Intelligent Sandbox 5.0.x Product Guide

Contents
Product overview 7
- Overview........................................................................ 7
- Key features.................................................................. 7
- How it works.................................................................. 7
Managing Intelligent Sandbox 9
- Viewing user profiles.................................................................. 9
- Edit Users.................................................................. 9
- Delete users.................................................................. 9
- Monitor the Intelligent Sandbox performance.................................................. 10
- Limit the number of records in the database.................................................. 10
-
Troubleshooting..................................................................
10
- Export the Intelligent Sandbox log files.................................................. 10
- Recreate the analyzer VMs.................................................. 11
- Delete the analysis results and reports.................................................. 11
- Delete email reports and cache.................................................. 11
- Back up and restore Intelligent Sandbox Appliance from a USB drive.................................................. 12
-
Back up and restore the Intelligent Sandbox database..................................................
12
- Schedule a database backup.................................................. 13
- Restore a database backup.................................................. 14
- Restore a database backup - Previous backup file.................................................. 15
Modifying Analyzer VMs 17
- View VM profiles.................................................................. 17
- Edit VM profiles.................................................................. 17
- Delete VM profiles.................................................................. 17
Configuring Intelligent Sandbox for malware analysis.......................................................... 19
View the system logs.................................................................................................. 18
Terminologies....................................................................................................... 19
Malware analysis workflow.................................................................................... 20
Internet access to sample files............................................................................ 22
Enable the malware port...................................................................................... 23
Managing analyzer profiles.................................................................................. 24
View analyzer profiles........................................................................................ 25
Create analyzer profiles...................................................................................... 25
Edit analyzer profiles........................................................................................ 27
Delete analyzer profiles...................................................................................... 28
Configure LDAP.................................................................................................. 28
Configure SNMP setting....................................................................................... 29
Configure email notification in Azure.................................................................... 33
View the Syslog logs.......................................................................................... 34
View the Audit Log............................................................................................ 34
Configure the minimum number of password characters........................................................ 34
Disable telemetry............................................................................................. 35
Generating a Certificate signing request (CSR).............................................................. 35
Generate a CSR.................................................................................................. 35
Integrate Intelligent Sandbox with compatible products..................................................... 36
Integration with McAfee ePO for OS profiling.......................................................... 36
Configure McAfee ePO integration to publish threat events............................................... 37
Integrate Intelligent Sandbox with McAfee ePO.......................................................... 40
Download and install the Intelligent Sandbox extension for threat events.............................. 41
Integrate Intelligent Sandbox with DXL................................................................... 41
Integrate Intelligent Sandbox with DXL................................................................... 42
Download and install the DXL extension.................................................................... 42
Integrate Intelligent Sandbox with Active Response....................................................... 43
Integrate Intelligent Sandbox with Active Response....................................................... 43
Integrate Intelligent Sandbox with Private GTI Cloud ..................................... 44
Integrate Intelligent Sandbox with TIE .................................................... 45
Updating content .......................................................... 47
Defining Custom Behavioral Rules ....................................................... 47
Create the Custom Behavioral Rules file ......................................... 48
Disable custom behavioral rules in Intelligent Sandbox ........................ 49
Define Custom Yara Scanner ............................................................. 50
Create Custom YARA Scanner files ................................................... 50
Define custom memory dump rules ...................................................... 50
Create custom memory dump rule .................................................... 50
Enable custom memory dump rule .................................................... 51
Import custom behavioral and YARA scanner rules .................................. 51
Change custom behavioral rules and YARA scanner files .......................... 52
Import Network Attack Rules .......................................................... 52
Manage whitelist database samples .................................................. 53
Manage the file and URL samples .................................................. 53
Manage the digital signature samples ............................................ 53
Manually update DAT version for Trellix Gateway Anti-Malware and Anti-Virus ... 54
Update the detection package ........................................................ 54
Automatically download the latest Detection Package .......................... 54
Manually upload the latest Detection Package .................................. 55
Analyzing malware ........................................................... 56
Analyze files ............................................................................. 56
Upload files for analysis .......................................................... 60
Manually upload files ............................................................... 61
Upload samples for analysis in skip analysis mode ............................. 63
Upload files for analysis using SFTP ............................................. 63
Analyze URLs .............................................................................. 64
Analyzing URLs ......................................................................... 64
Upload URLs for analysis using Intelligent Sandbox web interface ............ 65
Manual upload using URL option.............................................................. 66
Monitor the status of malware analysis......................................................... 66
Submit files for reanalysis................................................................. 67
View the analysis results................................................................. 67
Understanding Threat Analysis Report................................................ 69
View the Threat Analysis report...................................................... 73
View the Dropped Files report....................................................... 74
Viewing and Understanding the Disassembly Results report.......................... 74
Enable Disassembly Results report for an analyzer profile....................... 74
View the Disassembly Results report.............................................. 75
Logic Path Graph........................................................................... 75
MITRE ATT&CK Report................................................................ 77
User API Log............................................................................. 79
View script and text detection report.................................................. 80
View memory dump logs................................................................. 80
Download the Complete Results .zip file................................................. 81
Download the original sample.......................................................... 82
Submit false positive and negative samples............................................ 82
Submit false positive samples........................................................ 82
Submit false negative samples........................................................ 83
Troubleshoot low sandbox file scores................................................... 83
Monitor Intelligent Sandbox with the Dashboard....................................... 84
Malware analysis monitors.......................................................... 84
VM Creation Status monitor........................................................ 86
Intelligent Sandbox performance monitors........................................... 86
Clustering Intelligent Sandbox Appliances........................................ 87
Installing Intelligent Sandbox in a cluster environment................................ 87
Prerequisites and considerations..................................................... 88
Recommended concurrent SMTP sessions for Email Connector............................... 91
Cluster VM auto synchronization........................................................ 92
Intelligent Sandbox cluster network connections.............................................................. 94
Using Intelligent Sandbox clusters................................................................. 95
How to remove Intelligent Sandbox clusters......................................................... 98
Process flow for Network Security Platform......................................................... 99
Process flow for McAfee Web Gateway............................................................. 101
High-level steps to configure clusters.......................................................... 103
Create the cluster............................................................................... 104
Clustering Virtual Intelligent Sandbox Appliance.................................................. 105
Create the Virtual Intelligent Sandbox cluster................................................ 105
Deploying Virtual Intelligent Sandbox in Load balancing mode using Azure Load balancer.......... 111
Monitor the cluster status..................................................................... 113
Submit files to the cluster.................................................................... 116
Monitor the cluster status analysis........................................................ 116
Monitor the cluster analysis results........................................................ 117
Modifying cluster configurations............................................................ 117
Change the cluster configuration settings.................................................... 118
1 | Product overview
Product overview
Overview
Trellix Intelligent Sandbox Appliance enables organizations to detect advanced, evasive malware and convert threat information into immediate action and protection.
Unlike traditional sandboxes, it includes additional inspection capabilities that broaden detection and expose evasive threats. Tight integration between security solutions — from network and endpoint to investigation — enables instant sharing of threat information across the environment, enhancing protection and investigation. Flexible deployment options support every network.
Key features
Trellix Intelligent Sandbox is available as an on-premises appliance or a virtual form factor. All form factors act as a shared resource between multiple Trellix solutions.
Trellix Intelligent Sandbox provides these features.
- Detection of file downloads — Detects when a user tries to download a file from an external resource.
- Analysis of the file for malware — Verifies if the file contains any known malware.
- Block future downloads of the same file — Prevents future downloads of the file or its variants if the file is found to be malicious.
- Identify and remediate affected hosts — Identifies the host that executed the malware, and also detects the hosts to which it has spread. Then, Intelligent Sandbox shares the report with your other security products. This allows you to quarantine the affected hosts until they are clean.
- Local blacklist — Checks for a known malware using a local blacklist.
- Cloud-lookups — Integrates with the Trellix Global Threat Intelligence to detect malware that has already been identified by organizations throughout the globe.
- Emulation capabilities — Integrates with Trellix Gateway Anti-Malware Engine for emulation capabilities.
- Signature-based detection — Includes the Trellix Anti-Malware Engine for signature-based detection.
- Sandboxing capability (Dynamic analysis) — Analyzes the file by executing it in a virtual sandbox environment to determine whether the file is malicious.
How it works
Intelligent Sandbox integrates with other Trellix and third-party products to provide you a multilayered defense mechanism against malware.
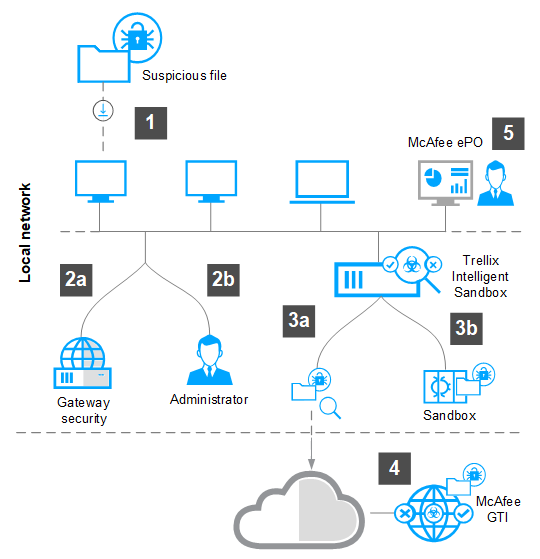
This workflow gives you a high-level overview of how Intelligent Sandbox works.
- A system tries to download a file with an embedded threat.
- The file is:
Trellix Intelligent Sandbox 5.0.x Product Guide
7
1 | Product overview
-
Automatically redirected to the McAfee Web Gateway where it's compared to known threats. If the file is deemed suspicious, it is redirected to the Intelligent Sandbox.
-
Manually submitted for analysis to Intelligent Sandbox by the administrator.
-
Once the file reaches Intelligent Sandbox, one or both of these occur:
-
The file hash of the file is compared to the file hashes in McAfee GTI.
-
The file is executed and observed in a sandbox to find if there is a threat enclosed.
-
-
If a threat is found when the file is opened, the threat is reported to McAfee GTI and all other connected security products. This allows you and your security products to take preventive measures such as blocking the file or quarantining the affected hosts.
-
If your Intelligent Sandbox is managed by McAfee ePO, a notification of the threat is sent to McAfee ePO and the administrator.
8 Trellix Intelligent Sandbox 5.0.x Product Guide
2 | Managing Intelligent Sandbox
Managing Intelligent Sandbox
Manage the malware analysis configurations and monitor the Intelligent Sandbox Appliance performance.
Viewing user profiles
If you are a user with admin permissions, you can view the list of Intelligent Sandbox users. If you do not have admin permissions, you can view your own user record.
Task
- Log on to the Intelligent Sandbox web interface.
- Click Manage → ATD Configuration → ATD Users.
- Hide the columns on the User Management table.
- Move the mouse over the right corner of the column heading, then click the drop-down arrow.
- Select Columns.
- Select the columns you want to display on the User Management table.
- To move a column, click and hold the column header, then drag it to the right or left.
- To sort the records based on a particular column name, click the column heading. You can also move your mouse over the right corner of the column heading, then click the drop-down arrow. Select Sort Ascending or Sort Descending.
Edit Users
To edit the user profiles, make sure the corresponding user is logged off.
Task
- Log on to the Intelligent Sandbox web interface.
- Click Manage → User Management.
- Select the user, then click Edit.
- Change the information in the fields, then click Save.
Delete users
Administrators have permissions to remove users from Intelligent Sandbox.
When you delete users from Intelligent Sandbox, make sure the user is logged off. You can only delete Intelligent Sandbox users, and are unable to delete these user accounts:
- Intelligent Sandbox administrator
- Network Security Platform
- McAfee Web Gateway
Task
- Log on to the Intelligent Sandbox web interface.
- Click Manage → ATD Configuration → ATD Users.
Trellix Intelligent Sandbox 5.0.x Product Guide
2 | Managing Intelligent Sandbox
3. Select the user names, then click Delete.
4. On the Confirmation window, click Yes.
Monitor the Intelligent Sandbox performance
You can use the following options to monitor the performance of Intelligent Sandbox.
- To continuously monitor the performance, use the monitors on the Intelligent Sandbox dashboard.
- Use the status command in the Intelligent Sandbox Appliance CLI.
Limit the number of records in the database
To ensure you have enough storage, limit the number of records in the Intelligent Sandbox database.
- Log on to the Intelligent Sandbox web interface.
- Select Manage → Maintenance → Database Pruning.
- Configure the Database Pruning Setting options.
- Click Schedule.
Troubleshooting
There are several methods to troubleshoot Intelligent Sandbox in your network.
Export the Intelligent Sandbox log files
If you experience any Intelligent Sandbox issues, export the log files to Trellix for analysis.
- Configuration Logs — Troubleshoot issues related to configurations.
- System Logs — Troubleshoot issues related to features, operations, and events.
- Diagnostic Logs — Troubleshoot critical issues, such as system crashes in Intelligent Sandbox.
- Debug Logs — Troubleshoot issues related to database operations, system processes, and other errors.
- VM Logs — Troubleshoot issues related to VMs.
- Install Logs — Troubleshoot issues related to installations.
- UI Logs — Troubleshoot issues related to UI errors.
- Integration Logs — Troubleshoot issues related to integration.
- Email Connector Logs — Troubleshoot issues related to email connector.
- Hardware Logs — Captures all hardware logs. Previously, hardware logs were captured by running LDT tool.
Note
Capturing hardware logs is resource intensive and could show momentary performance degradation in Intelligent Sandbox.
2 | Managing Intelligent Sandbox
Only Trellix Support can read the Intelligent Sandbox log content.
Task
-
Log on to the Intelligent Sandbox web interface.
-
Click Manage → Troubleshooting.
-
Select the log files you want to send, configure the amount of logs you want to include, then click Create Support Bundle.
-
On the Ticket Number window, enter your ticket number, then click OK.
Recreate the analyzer VMs
You can delete all existing VMs, including the default Android VM and healthy analyzer VMs, then re-create them.
Task
-
Log on to the Intelligent Sandbox web interface.
-
Click Manage → Troubleshooting → Create VMs.
-
On the Confirmation window, click Yes.
-
To view the VM re-creation logs, click Manage → Logs → System.
-
To view the VM re-creation status, click Dashboard. The status is displayed on the VM Creation Status monitor.
-
Results
The Create VMs option becomes available again when Intelligent Sandbox completes the analyzer VM re-creation process.
Delete the analysis results and reports
Remove all existing analysis results and reports from Intelligent Sandbox.
Task
-
Log on to the Intelligent Sandbox web interface.
-
Click Manage → Troubleshooting.
-
Select Remove all Analysis Results and Reports, then click Submit.
-
Click Submit.
Delete email reports and cache
Remove all existing email reports and cache from Trellix Intelligent Sandbox.
Task
-
Log on to the Trellix Intelligent Sandbox web interface.
-
Click Manage → Troubleshooting.
-
Select the following options:
-
Remove all Email Reports – Removes all existing email reports.
-
Clear Email Results Cache – Removes all cached email results.
-
-
Click Yes, then click Submit.
2 | Managing Intelligent Sandbox
Back up and restore Intelligent Sandbox Appliance from a USB drive
Create a USB recovery drive, then re-image the Intelligent Sandbox Appliance. You use this drive to back up and restore your Intelligent Sandbox Appliance.
For more information on how to create the USB Drive, see Install the OS to your appliance topic on the Intelligent Sandbox Installation Guide.
Back up and restore the Intelligent Sandbox database
As a precaution, you can periodically backup the Intelligent Sandbox database. You can then restore a backup of your choice when required. For example, if you want to discard all changes made during a troubleshooting exercise, you can restore the backup that was taken before you started troubleshooting.
You can schedule automatic backups to a designated FTP or SFTP server on a daily, weekly, or monthly basis.
When you want to restore a backup, Intelligent Sandbox collects the selected backup file from the FTP or SFTP server and overwrites its database with the contents of the backup file.
|
Data included in backup |
Data |
|---|---|
|
2 | Managing Intelligent Sandbox
|
Data
| |
|
Data not included in backup |
|
Schedule a database backup
Schedule daily, weekly, or monthly Intelligent Sandbox database backups.
Before you begin
- Make sure that you have the following:
- A configured SFTP or FTP server that stores the backup files
- A directory on the SFTP or FTP server where you want to store the backup files
- Collect the following SFTP or FTP server information.
- IPv4 address
- The user name that Intelligent Sandbox uses to access the SFTP or FTP server
Make sure that the user name has write access to the specified folder.
- The corresponding password that Intelligent Sandbox uses to access the SFTP or FTP server.
Trellix Intelligent Sandbox 5.0.x Product Guide
2 | Managing Intelligent Sandbox
-
Make sure that the communication over SFTP or FTP is possible between Intelligent Sandbox and the SFTP or FTP server.
Task
-
Log on to the Intelligent Sandbox web interface.
-
Click Manage → Maintenance → Backup & Restore → Backup.
-
Configure the options, then click Schedule.
The backup is stored in a password-protected .zip file in the specified directory on the SFTP or FTP server.
Note
Do not unzip or tamper with the .zip file. If the file corrupts, you cannot restore the database backup with the .zip file.
-
To view the backup logs, click Manage → Logs → System.
Restore a database backup
If the Intelligent Sandbox Appliance becomes corrupted, restore a specified or previous backup file on any Intelligent Sandbox Appliance.
Before you begin
Verify the following.
-
The version number in the backup file matches the current Intelligent Sandbox version. For example, Intelligent Sandbox is unable to restore a backup from 3.0.4.94.39030 on 3.0.4.94.39031.
-
All users are logged off the Intelligent Sandbox web interface, REST APIs, and CLI.
-
The SFTP or FTP server is successfully configured with Intelligent Sandbox.
-
All sample file and URL analysis is complete.
Note
When you restore a database backup during a backup, the restoration fails.
Task
-
Log on to the Intelligent Sandbox web interface.
-
Click Manage → Maintenance → Restore & Backup → Restore.
-
Restore the backup file.
-
You can upload a local backup file.
-
You can back up from your SFTP or FTP server.
-
Select Specific backup file, then configure the options.
-
Select Previous backup file, then select the file.
-
2 | Managing Intelligent Sandbox
Note
If the IP address changes on the SFTP or FTP server, update the configuration on the Backup Scheduler Setting page, then complete the restoration. If the SFTP or FTP server changes, your restore to backup on the old server fails. You would only be able to restore from the files on the new server.

Click Restore.
To view the restoration logs, click Manage → Logs → Syslog.
The sample analysis processes stop before the restore process and restart when the restoration completes.
What to do next
During restoration, make sure to avoid the following.
- Sample submissions from integrated products, users, and scripts
- Intelligent Sandbox software upgrade
Restore a database backup - Previous backup file
Before you begin
-
Make sure that you configured the SFTP or FTP IP address, directory path, and user credentials on the Backup Scheduler Setting page and the test connection is working for the specified configuration. You can restore a backup only from the same SFTP or FTP server that you used for taking the backup.
-
Make sure that the corresponding backup file that you plan to restore is available on the SFTP or FTP server at the specified directory.
-
As a precaution, make sure that there is no other user logged on to Intelligent Sandbox during the restoration window. Factor in the Intelligent Sandbox web application, REST APIs, and CLI.
-
Make sure that Intelligent Sandbox is not analyzing any sample files or URLs at the time of restoration. Also, make sure no integrated product, user, or script is submitting samples during the restoration window.
-
Make sure that you do not restore a backup during the backup window.
-
Make sure that there is no Intelligent Sandbox software upgrade happening during the restoration window.
There might be some changes regarding the SFTP or FTP server used for the backup. For example, the IP address of the SFTP or FTP backup server might change or you might want to migrate the SFTP or FTP server to a new physical or virtual server. If the IP address changes, make sure you update the configuration accordingly on the Backup Scheduler Setting page. You can then restore from the required backup file. However, if the server itself is changed, you cannot restore the backups stored on the old server. You can only restore from the files backed up on the new server.
-
You cannot restore a backup from an earlier or later version of Intelligent Sandbox software. All numbers in the version must exactly match. For example, you cannot restore a backup from 3.0.4.94.39030 on 3.0.4.94.39031.
-
The time taken for the backup restore process to complete is usually a few minutes. However, it varies based on the size of the data involved.
Task
-
Select Manage → Backup and Restore → Restore
The Restore Management page appears.
2 | Managing Intelligent Sandbox
Restore previous backup files
|
Option name |
Definition |
|---|---|
|
File Name |
The name, which Intelligent Sandbox assigned to the backup file.
|
|
Backup Server IP Address |
The IP address of the SFTP or FTP server in which the backup files are stored. |
|
Backup Time |
Time stamp of when the backup was taken. |
|
Restore |
Select the required backup file and click Restore to restore the data from that backup file. When you have more than one backup file, you can select the backup files that you want to restore using the radio buttons. |
-
To view the logs related to restore, select Manage → Logs → Syslog.
The processes related to sample analysis are stopped before the restore process and restarted after the restore process.
3 | Modifying Analyzer VMs
Modifying Analyzer VMs
View VM profiles
To view the existing VM profiles, use the Intelligent Sandbox web interface.
Task
-
Log on to the Intelligent Sandbox web interface.
-
Click Policy → VM Profile.
-
Hide the table columns.
-
Move the mouse over the right corner of the column heading. then click the drop-down arrow.
-
Select Columns.
-
Select the columns you want to display.
-
To move a column, click and hold the column header, then drag it to the right or left.
-
-
To sort the records based on a particular column name, click the column heading.
You can also move your mouse over the right corner of the column heading, then click the drop-down arrow. Select Sort Ascending or Sort Descending.
-
To view the VM profile options, select the record, then click View.
Edit VM profiles
To edit VM profiles, you must have administrator permissions.
Task
-
Log on to the Intelligent Sandbox web interface.
-
Click Policy → VM Profile.
-
Select the the VM profile, then click Edit.
-
Change the settings, then click Save.
Delete VM profiles
Before you begin
-
To delete a VM profile, either you must have created it or you must have admin-user role.
-
Make sure the VM profile you want to delete is not specified in the analyzer profiles.
Task
-
Log on to the Intelligent Sandbox web interface.
-
Click Policy → VM Profile.
-
Select the records, then click Delete.
-
On the Confirmation window, click Yes.
Trellix Intelligent Sandbox 5.0.x Product Guide
17
3 | Modifying Analyzer VMs
View the system logs
When you create a VM profile using the VM Profile page, Intelligent Sandbox creates an analyzer VM from the image file you selected in the VM profile record. Simultaneously, it prints the related logs, which you can view in the Intelligent Sandbox web interface. Through these log entries, you can view what is happening as the analyzer VM is being created. You can use this information for troubleshooting purposes.
Task
-
Log on to the Intelligent Sandbox web interface.
-
Click Manage → Logs → System.
4 | Configuring Intelligent Sandbox for malware analysis
Configuring Intelligent Sandbox for malware analysis
Terminologies
Being familiar with the following terminologies facilitates malware analysis using Intelligent Sandbox.
-
Global Whitelist — This is the list of MD5/SHA-256 hash values of trusted files and VBA scripts embedded inside a Microsoft Office application, which need not be analyzed.
The whitelist feature is enabled by default.
In a load-balancing scenario, after the cluster creation, run the
whitelistMerge clustercommand on the Active node to manually copy the Global Whitelist database of Active node onto Secondary/Backup nodes. This is only a one-time activity, after which the Whitelist database of Secondary/Backup nodes is automatically overwritten by that of Active node at 0000 hours on a daily basis. -
Static analysis — When Intelligent Sandbox receives a supported file for analysis, it first performs static analysis of the file. The objective is to check if it is a known malware in the shortest possible time, and also to preserve the Intelligent Sandbox resources for dynamic analysis. For static analysis, Intelligent Sandbox uses these resources in the following order.
-
Local Blacklist — This is the list of MD5 hash values of known malware stored in the Intelligent Sandbox database. When Intelligent Sandbox detects a malware through its heuristic Trellix Gateway Anti-Malware engine or through dynamic analysis, it updates the local blacklist with the file MD5 hash value. A file is added to this list automatically only when its malware severity as determined by Intelligent Sandbox is medium, high, or very high. There are commands to manage the entries in the blacklist.
-
McAfee GTI — This is a global threat correlation engine and intelligence base of global messaging and communication behavior, which enables the protection of the customers against both known and emerging electronic threats across all threat areas.
-
-
Gateway Anti-Malware — Trellix Gateway Anti-Malware Engine analyzes the behavior of web sites, web site code, and downloaded Web 2.0 content in real time to preemptively detect and block malicious web attacks.
Note
DNS must be configured for McAfee GTI to run.

Note
For File Reputation queries to succeed, make sure Intelligent Sandbox is able to communicate with
tunnel.message.trustedsource.orgover HTTPS (TCP/443). Intelligent Sandbox retrieves the URL updates fromList.smartfilter.comover HTTP (TCP/80).
4 | Configuring Intelligent Sandbox for malware analysis
It protects businesses from modern blended attacks, including viruses, worms, adware, spyware, riskware, and other crimeware threats, without relying on virus signatures.
Static analysis analyzes all the instructions and properties to identify the intended behaviors, which might not surface immediately. This also provides detailed malware classification information, widens the security cover, and can identify associated malware that leverages code re-use.
- Anti-Malware — The DAT is updated automatically or manually based on the network connectivity of Intelligent Sandbox.
- Yara scanner — Intelligent Sandbox utilizes this analysis engine to analyze the samples during static analysis. The scanner analyzes the samples based on the default Yara rules and custom Yara rules that you can set on your Intelligent Sandbox.
Note
By default, Intelligent Sandbox downloads the updates for Trellix Gateway Anti-Malware Engine and Trellix Anti-Malware Engine every 90 minutes.
- Dynamic Analysis — Intelligent Sandbox executes the file in a secure virtual machine and monitors its behavior to check how malicious the file is. At the end of the analysis, it provides a detailed report as required by the user. By default, if static analysis identifies the malware, Intelligent Sandbox does not perform dynamic analysis. However, you can configure Intelligent Sandbox to perform dynamic analysis regardless of the results from static analysis. You can also configure only dynamic analysis without static analysis. Dynamic analysis includes the disassembly listing feature of Intelligent Sandbox as well. This feature can generate the disassembly code of PE files for you to analyze the sample further.
The sample analysis sequence uses these resources in the following order.
- Global Whitelist
- Local Blacklist
- McAfee GTI, Trellix Gateway Anti-Malware Engine, and Trellix Anti-Malware Engine
- YARA scanner
- Dynamic Analysis
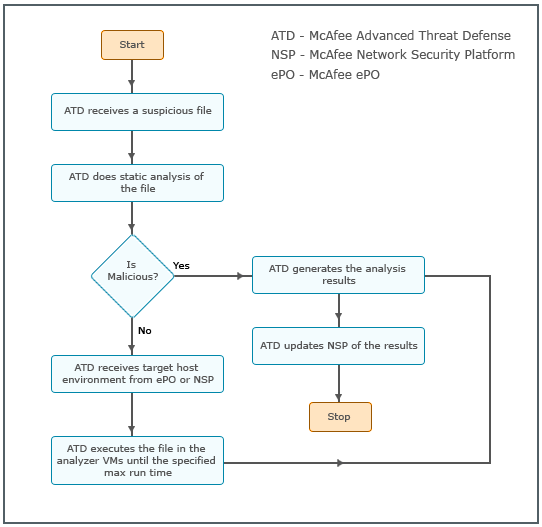
Malware analysis workflow
Consider that you have uploaded a file manually using Intelligent Sandbox web interface.
- Assuming the file format is supported, Intelligent Sandbox unpacks the file and calculates the MD5 hash value.
- Intelligent Sandbox applies the analyzer profile that you specified during file upload.
- Based on the configuration in the analyzer profile, it determines the modules to use for static analysis and checks the file against those modules.
- If the file is found to be malicious during static analysis, Intelligent Sandbox stops further analysis and generates the required reports. This, however, depends on how you have configured the corresponding analyzer profile.
4 | Configuring Intelligent Sandbox for malware analysis
- If the static analysis does not report any malware or if you had configured Intelligent Sandbox to perform dynamic analysis regardless of the results from static analysis, Intelligent Sandbox initiates dynamic analysis for the file.
- It executes the file in the corresponding analyzer VMs and records every behavior. The analyzer VM is determined based on the VM profile in the analyzer profile.
- If the file is fully executed or if the maximum execution period expires, Intelligent Sandbox prepares the required reports.
- After dynamic analysis is complete, it sets the analyzer VMs to their baseline version so that they can be used for the next file in queue.
Consider that an inline Sensor port that is assigned the corresponding Advanced Malware Policy, detects a file download over HTTP or SMTP:
- The Sensor derives the MD5 hash value of the file and checks it against its local blacklist and white list. The Sensor's blacklist and white list are different from Intelligent Sandbox lists and these lists are not synchronized.
- If the file is whitelisted, it allows the file download without processing it for malware; if the file is blacklisted, it blocks the file download without processing it further for malware. If the file is not part of the local white list or black list, the Sensor continues further processing.
- Based on the file type, the Sensor concurrently passes a copy of the packet to the selected malware engines.
- If the Sensor forwards the packets to Intelligent Sandbox, an informational alert is displayed in the Threat Analyzer indicating that a file is being forwarded to Intelligent Sandbox for malware analysis.
- The Sensor forwards the entire file to Intelligent Sandbox but holds the last file packet for 6 seconds before forwarding it through the egress port.
- Intelligent Sandbox performs static analysis of the file and if the file is found to be malicious, it informs the Sensor. The Sensor blocks the file download and takes the configured response action based on the confidence level reported by Intelligent Sandbox.
- If Intelligent Sandbox is unable to find any malware through static analysis, then it informs the Sensor that the file is about to be dynamically analyzed.
- Because dynamic analysis requires some time, the Sensor allows the last packet of the file to go through the egress monitoring port. It also informs the Manager about the file that is being dynamically analyzed.
- The Manager regularly polls Intelligent Sandbox for the result of this dynamic analysis.
- If you have integrated Trellix Intelligent Sandbox and McAfee ePO, then the information on the target host is used from McAfee ePO. If not, information from Passive Device Profiling in Network Security Platform is used to learn about the target host environment. Using this information, Intelligent Sandbox selects the analyzer VM and executes the file on that analyzer VM.
- After the file has run for the maximum time you have specified in the analyzer profile for Network Security Platform, Intelligent Sandbox prepares the required reports.
- After dynamic analysis is complete, it sets the analyzer VMs to their baseline version so that they can be used for the next file in queue.
- The Manager displays the analysis report as well as in its Malware Dashboards and Threat Analyzer.
4| Configuring Intelligent Sandbox for malware analysis
Internet access to sample files
When being dynamically analyzed, a sample might access a resource on the Internet. For example, the sample might attempt to download additional malicious code or attempt to upload information that it collected from the host machine (in this case, the analyzer VM).
You can configure Intelligent Sandbox to provide network services to analyzer VMs so that the network activities of a sample file can be analyzed.
Providing Internet access to samples enables Intelligent Sandbox to analyze the network behavior of a sample and also determine the impact of the additional files downloaded from the Internet. Some malware might try to determine if they are being executed in a sandbox by requesting for Internet access and then alter their behavior accordingly.
When an analyzer VM is created, Intelligent Sandbox makes sure that the analyzer VM has the configurations to communicate over a network when required.
You can control granting real network access to an analyzer VM through a setting in the analyzer profiles. Network services are provided regardless of the method used to submit the sample. For example, it is provided to samples submitted manually using the Intelligent Sandbox web interface as well as samples submitted by the integrated products.
4 | Configuring Intelligent Sandbox for malware analysis
Internet access to samples - process flow
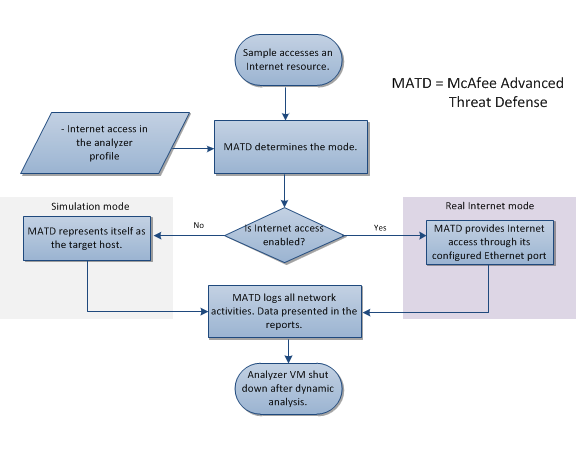
When samples access Internet resources, Intelligent Sandbox checks if the Internet connectivity is enabled in the corresponding analyzer profile. Based on whether Internet connectivity is enabled or not, Intelligent Sandbox determines the mode that provides the network services:
- Simulator mode — If Internet connectivity is not enabled in the analyzer profile, this mode is used. Intelligent Sandbox can represent itself as being the target resource. For example, if the sample attempts to download a file through FTP, Intelligent Sandbox simulates this connection for the analyzer VM.
- Real Internet mode — This mode requires the management port (eth-0), eth-1, eth-2 or eth-3 to have access to the Internet. If Internet connectivity is enabled in the analyzer profile, Intelligent Sandbox uses this mode. Intelligent Sandbox provides real Internet connection through the management port by default, which is publicly routed or directed towards your enterprise firewall as per your network configuration. Because the traffic from an analyzer VM could be malicious, you might want to segregate this traffic away from your production network. In this case, you can use Intelligent Sandbox's eth-1, eth-2, or eth-3 provide Internet access to the analyzer VM.
Intelligent Sandbox logs all network activities. The types of reports generated vary based on the mode:
- Network activities are summarized and presented in the Analysis Summary report. You can find the DNS queries and socket activities under network operations. You can find all the network activities in the Network Operations section of the report.
- The dns.log report also contains the DNS queries made by the sample.
- The packet capture of the network activities is provided in the NetLog folder within the Complete Results zip file.
Enable the malware port
By default, Intelligent Sandbox uses the management port (eth-0) to provide Internet access to samples, but you can also configure the malware port to securely access the Internet.
Trellix Intelligent Sandbox 5.0.x Product Guide23
4 | Configuring Intelligent Sandbox for malware analysis
Before you begin
-
Add a new Ethernet Adapter (eth-1) with Adapter Type E1000 for your Intelligent Sandbox.
For information about how to add a new ethernet adapter, see the VMWare vSphere Client documentation for your specific vSphere version..
-
Set malware DNS setting to a DNS server that is reachable through the malware interface port, for the malware Internet access to function correctly.
The malware DNS is required to set for the following functions to be operable:
- Activation VM Internet access
- Sandbox analysis DNS name resolution
- URL download
- URL analysis
For information about how to configure Malware DNS, see Trellix Intelligent Sandbox Installation Guide.
Task
-
Log on to the Intelligent Sandbox CLI and enable the malware port.
For example,
set intfport 1 enableto enable eth-1 port. -
Configure the malware port IP address and subnet mask.
For example,
set intfport 1 ip 10.10.10.10 255.255.255.0Make sure the IP address is outside your network.
-
For the Ethernet port, configure the gateway that you want to route the Internet access.
For example,
set malware-intfport 1 gateway 10.10.10.252 -
To allow the port to check if it is configured for malware Internet access, use the
show intfport <port number>command.For example,
show intfport 1. -
Verify these entries:
- Malware Interface Port
- Malware Gateway
To revert to the management port (eth-0) for malware Internet access, run set malware-intfport mgmt in the CLI. Intelligent Sandbox uses the management port IP and default gateway to provide Internet access to samples.
For general Intelligent Sandbox traffic, use the route add network command.
For Internet traffic from analyzer VMs, use set malware-intfport.
The route add network and set malware-intfport commands do not affect each other.
Managing analyzer profiles
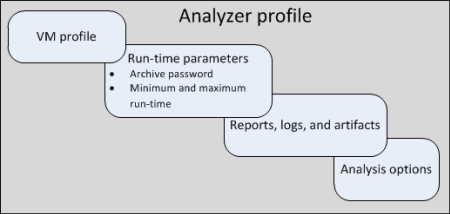
When a file is manually or automatically submitted to Intelligent Sandbox for analysis, it uses the corresponding analyzer profile to determine how the file needs to be analyzed and what needs to be reported in the analysis results. You specify the VM profile in the analyzer profile. You also define how the file is to be analyzed for malware and the reports to be published. Thus, an analyzer profile contains all the critical user-configuration on how to analyze a file.
You use the Intelligent Sandbox web application to manage analyzer profiles.
24Trellix Intelligent Sandbox 5.0.x Product Guide
4 | Configuring Intelligent Sandbox for malware analysis
Contents of an analyzer profile
View analyzer profiles
Based on your user role, you can view the existing analyzer profiles on the Intelligent Sandbox web interface.
Task
- Log on to the Intelligent Sandbox web interface.
- Click Policy → Analyzer Profile.
- Hide the unneeded columns.
- Move the mouse over the right corner of a column heading and click the drop-down arrow.
- Select Columns.
- Select only the required column names from the list.
- To sort the records based on a particular column name, click the column heading.
You can sort the records in the ascending or descending order. Alternatively, move the mouse over the right corner of a column heading and click the drop-down arrow. Then select Sort Ascending or Sort Descending.
- To view the complete details of a specific analyzer profile, select the record and click View.
Create analyzer profiles
When you submit a file manually or automatically for analysis, the file uses the corresponding analyzer profile to determine how the file is analyzed and reported.
Task
- Log on to the Intelligent Sandbox web interface.
- Make sure the users assigned to the analyzer profile are logged off of Intelligent Sandbox.
- Click Policy → Analyzer Profile → New.
- Type a name for the analyzer profile, and choose one or more VM profiles that Intelligent Sandbox must use for dynamically analyzing a file.
Trellix Intelligent Sandbox 5.0.x Product Guide 25
4 | Configuring Intelligent Sandbox for malware analysis
Note
If you want to submit a file to multiple VMs for analysis, you can select up to five VM profiles in one Analyzer Profile.
-
In the Automatically Select OS section, do the following:
-
Select Enable if you want Intelligent Sandbox to automatically select the VM profile for Windows 32-bit and Windows 64-bit.
-
Select the VM profiles from the Windows 32-bit VM Profile and Windows 64-bit VM Profile.
-
-
In the Runtime Parameters section, do the following:
-
In Archive Password, enter the password for Intelligent Sandbox to unzip a password-protected malware sample, then confirm it by entering the same password again.
-
Note
If Archive Password is blank, Intelligent Sandbox will use the password infected to unzip the password protected archive file.
b. Specify the maximum time duration for which Intelligent Sandbox should dynamically analyze the sample.
Note
The default value is 180 seconds. The maximum value allowed is 32767 seconds. If the file does not stop execution before this time period expires, the dynamic analysis is stopped.
c. In Runtime Argument, type command-line parameter for the submitted file on execution.
This allows you to review the actual payload of malware.
-
In Reports, Logs, and Artifacts section, choose from the following:
Analysis Summary – Select to include the Analysis Summary report in the analysis results.
Packet captures – Select to capture the network packets if the file tries to communicate during dynamic analysis. The pcap file is provided in the complete results .zip file.
Dropped Files – Select to generate the Files Created in Sandbox report.
Disassembly Results – Select if you want Intelligent Sandbox to generate the disassembly code of PE files.
Logic Path Graph – Select to generate Logic Path Graph report.
User API Log – This report provides Windows user-level DLL API calls made directly by the malware sample during dynamic analysis.
Memory Dump — Select to generate the memory dump strings of PE files.
-
In the Static Analysis section, select the engines that you would want to use for the scanning.
-
In the Dynamic Analysis section, select the method that you would want to use for the scanning.
-
In the Analyzer Flow Controls section, choose from the following:
-
Continue to run all engines even after file is found malicious – Select if you want Intelligent Sandbox to analyze the file using all selected Analyze Options, regardless of the result from any specific method.
-
4 | Configuring Intelligent Sandbox for malware analysis
Note
When selected, Intelligent Sandbox skips the pre-filter scan process and submits the sample to all selected engines.

-
Skip files if previously analyzed – Select if you want Intelligent Sandbox to skip analysis of a file if the same has been previously analyzed.
It verifies the md5sum hash value of a sample if it was analyzed in 3 days and the severity level was more than informational.
-
Analyze archive contents individually – Intelligent Sandbox extracts and sends the content of .zip and .7zip archive files individually to a sandbox for analysis. If an archive file is nested, it is extracted up to three levels before it's analyzed by Intelligent Sandbox.
Uncheck this option if you want Intelligent Sandbox to send the archive files for analysis without extracting its content.
In the Internet options section, select Enable Malware Internet Access to provide Internet access to samples so they have access to resources on the Internet.
Note
- To enable this option, the Sandbox option under Analyzer Options must be enabled. Also, you must have admin role permission to select or deselect Enable Malware Internet Access.
- Because the sample being analyzed could potentially be a malware, selecting the Enable Malware Internet Access option involves the risk of malicious traffic propagating out of your network. A disclaimer message is displayed when you select this option, and you must click OK to continue. Also, the administrator can configure proxy setting for malware in case there is a proxy server in their network.
Click Save to create the analyzer profile.
-
Associate the analyzer profile to a user.
- Click ATD Configuration → ATD Users.
- Select the administrator, then click Edit.
- From the Default Analyzer Profile list, select the analyzer profile.
- Click Save.
Task
- Log on to the Intelligent Sandbox web interface.
- Click Policy → Analyzer Profile.
If you have web access, you can view only the analyzer profiles that you created. If you have admin access, you can view all the analyzer profiles currently in the database.
- Select the record and, then click Edit.
- Make the changes to the required fields, then click Save.
Trellix Intelligent Sandbox 5.0.x Product Guide
27
4 | Configuring Intelligent Sandbox for malware analysis
The changes affect the corresponding users even if they are currently logged on.
Delete analyzer profiles
Before you begin
Make sure the users to whom you have assigned this analyzer profile are not currently logged on to Trellix Intelligent Sandbox.
Task
-
Log on to the Intelligent Sandbox web interface.
-
Click Policy → Analyzer Profile.
If you have web access, you can view only the analyzer profiles that you created. If you have admin access, you can view all the analyzer profiles currently in the database.
-
Select the records, then click Delete.
-
On the Confirmation window, click Yes.
Configure LDAP
LDAP (Lightweight Directory Access Protocol) enables Intelligent Sandbox to configure a dedicated LDAP server for user authentication. A separate server for user authentication facilitates a secured and centralized authentication system. It provides a robust and secure credential authentication and management system for various types of Intelligent Sandbox users.
To authenticate an account from an LDAP server, you must create an account on the Intelligent Sandbox appliance with the authentication type LDAP. The account name on the Intelligent Sandbox appliance must match the LDAP server account name.
-
Base Distinguished Name (BaseDN) — Create a specific BaseDN for Intelligent Sandbox users. BaseDN acts as a root node under which all the Intelligent Sandbox users are added.
-
Admin Credentials — To enable the LDAP option, you must provide the Admin User credentials in the Intelligent Sandbox web interface. If the Admin User has not been created, you must create the same in the LDAP server directory.
-
User creation — Create a user with the same username as on the LDAP server and select the authentication type as LDAP.
 Note
Note
During the LDAP logon, username must match the username created locally in the Intelligent Sandbox database. Username is case sensitive.
4 | Configuring Intelligent Sandbox for malware analysis
The authentication type for users created by administrators prior to the Intelligent Sandbox 5.0 upgrade can be changed to LDAP by using the Edit Users option on the TIS Users page. LDAP authentication is not supported for the user with the Integration Administrator role.
Task
- Log on to the Intelligent Sandbox web interface.
- Click Manage → TIS Configuration → LDAP, then select Enable LDAP.
- Configure the LDAP User Credentials options, then click Test Connection.
- On the LDAP Test connection successful window, click OK.
- Click Submit.
Note
To authenticate the cliadmin from an LDAP server, we can create the same user in the LDAP server. For cliadmin users, Fallback is enabled by default.
Configure SNMP setting
Intelligent Sandbox supports SNMP version 2c and version 3. To enable users to manage Intelligent Sandbox resources efficiently, the SNMP service obtains integral values through SNMP traps.
Intelligent Sandbox supports the 1.3.6.1.4.1.8962.4.1.1 OID (object identifier).
Intelligent Sandbox also provide SNMP support to standard .1.3.6.1.2.1.1 OID subtree, which includes sysName, sysDecr, sysContact, and sysLocation fields to identify the resource. The sysName value is taken from Intelligent Sandbox hostname configured by "set appliance name <hostname>" command execution.
The qualified attributes for SNMP traps include:
- Hard disk utilization
- CPU utilization
- Memory utilization
- ATD services such as system health, load balancers, and malware interface status.
- Other statuses such as DXL channel, TAXII, and sensor.
Task
- Log on to Intelligent Sandbox web interface.
- Click Manage → ATD Configuration → SNMP.
- Select Allow SNMP Monitoring, to configure SNMP.
Intelligent Sandbox allows you to configure the following SNMP versions:
- SNMPv2c
- SNMPv3
- If you want to set up SNMPv2c, then select SNMPv2c, and enter the Community String for your Intelligent Sandbox appliance.
Trellix Intelligent Sandbox 5.0.x Product Guide
29
4 | Configuring Intelligent Sandbox for malware analysis
The default Community String is atdpublic.
-
If you want to set up SNMPv3, then select SNMPv3, then do the following:
Enter the username, then select the appropriate Security Level and Authentication type.
Enter the Authentication Password and Privacy Password.
-
In the SNMP System Information section, enter these fields:
Description – The field value is saved as sysDescr.
Contact – The field value is saved as sysContact.
Location – The field value is saved as sysLocation.
Note
For the Load Balancer configuration, these fields must be defined on each node individually.
-
To configure SNMP Traps, select Send SNMP Traps, then do the following:
Note
CPU Utilization field appearing in the SNMP Setting page is different from CPU Load featuring under System Health in the Dashboard tab.
Enter the Destination IP and Port Number.
Then choose the SNMP traps that you'd want to collect.
Category | Option | Definition |
|---|---|---|
Device | Hard Disk Utilization |
Trap is generated when:
|
CPU Utilization | Traps are sent when the overall CPU utilization of the device exceeds the configured threshold value. | |
Memory Utilization | Traps are sent when the overall Memory utilization |
|
Category |
Option |
Definition |
|---|---|---|
|
of the device exceeds the configured threshold value. | ||
|
ATD Services |
System Health |
The follows trap value is sent:
|
|
Backup Scheduler |
The follows trap value is sent:
| |
|
Load Balancer |
The follows trap value is sent:
| |
|
Email Connector |
The follows trap value is sent:
|
4 | Configuring Intelligent Sandbox for malware analysis
| Category | Option | Definition |
|---|---|---|
| ||
| Email Gateway Wait time | Trap is sent with value 1 when the Wait Time for McAfee Email Gateway exceeds the configured threshold value set in Global Settings. | |
| Malware Interface Status | The follows trap value is sent:
| |
| License Status | The follows trap value is sent from Virtual Intelligent Sandbox:
| |
| Malware DNS Status | The following trap value is sent:
| |
| Point Products | DXL Status | The follows trap value is sent:
|
32Trellix Intelligent Sandbox 5.0.x Product Guide
4 | Configuring Intelligent Sandbox for malware analysis
| Category | Option | Definition |
|---|---|---|
| ||
| TAXII Status |
The follows trap value is sent:
| |
| Sensor Status |
The follows trap value is sent for NSP Sensor status:
|
8. Click Submit.
- Ensure that you download the latest management information base (MIB) file using from MIB Download link on the SNMP Configuration page. Then upload the file to your SNMP MIB browser.
- To retrieve the attribute numeric values, enter the
snmpgetcommand in the command prompt or any MIB browser.
Configure email notification in Azure
Configure email notification that allows you to monitor the status of your Virtual Intelligent Sandbox on Azure.
With this configuration, you can receive email notifications when your Virtual Intelligent Sandbox is unavailable. You can then take action to bring it back online.
Task
- Log on to the Azure Portal (https://portal.azure.com).
- Select your VM, then on the right-pane, click Metrics.
- Click Add metric alert, then do the following:
- In Name, type a name for the alert.
- Under Alert On, choose Metrics.
Trellix Intelligent Sandbox 5.0.x Product Guide33
4 | Configuring Intelligent Sandbox for malware analysis
-
Select the appropriate subscription.
-
In Resource Group, select the resource group of the Virtual Intelligent Sandbox where you deployed it.
-
In Resource, select the primary Virtual Intelligent Sandbox VM.
-
In Metric, select Select Network Out.
-
In Condition, select Less than or equal to.
-
In Threshold, type 0.
-
In Period, select Over the last 5 minutes.
-
Type the email address where you want to receive notification.
-
Click OK.
Results
You can follow these steps to configure email notifications on other metrics such as CPU, Disk, and so on.
View the Syslog logs
Syslog starts logging syslog events taking place within the Intelligent Sandbox. Simultaneously, it prints the related logs, which you can view in the Intelligent Sandbox web interface. You can use this information for troubleshooting purposes.
Task
-
Log on to the Intelligent Sandbox web interface.
-
Click Manage → Logs → Syslog.
A maximum of 1,000 events are displayed in Intelligent Sandbox user interface with latest events at the bottom. More events are available in the configured syslog server. You cannot print or export the log entries.
View the Audit Log
When you configure audit function by checking on the Audit Log using Syslog Setting page, Intelligent Sandbox starts logging the administrative actions performed within the Intelligent Sandbox. Through these log entries, you can view what is happening as the administrative actions, for example, configuration change, session establishment/session termination and so on are performed. These log entries are displayed in a tabular form. You can use this information for troubleshooting purposes.
Task
-
Log on to the Intelligent Sandbox web interface.
-
Click Manage → Logs → Audit.
Configure the minimum number of password characters
Configure the minimum number of characters that users can use in the password they create to log on to Intelligent Sandbox.
The default password length is 8 characters. The password settings also apply to console and CLI access.
Task
-
Log on to the Intelligent Sandbox web interface.
4 | Configuring Intelligent Sandbox for malware analysis
Click Manage → Security → Advanced Security Settings.
To select the minimum number of password characters, use the arrows.
Click Save.
Disable telemetry
You can disable system and Trellix Labs telemetry without disabling the automatic update.
Task
Log on to the Intelligent Sandbox interface.
Click Manage → ATD Configuration → Telemetry.
Deselect the following options, then click Submit.
Send feedback to McAfee about system information in order to improve the product.
Send feedback to McAfee about potential malicious files and urls.
Generating a Certificate signing request (CSR)
Intelligent Sandbox allows you to generate a certificate signing request (CSR) from the web interface.
When you generate a CSR , Intelligent Sandbox attaches the key to the CSR. This is because the key for the CSR is with Intelligent Sandbox.
To generate a CSR, you need to enter your organization details, and the key size. You can then generate your CSR, export it, and submit it to a certificate signing authority to get it signed.
You can generate a CSR for a server from Intelligent Sandbox.
Task
Log on to the Intelligent Sandbox web interface.
Click Manage → Security → CSR Generation.
Fill the CSR Generation fields with your organization details.
Common Name [CN] – Enter the domain name of your organization.
Organization Name [O] – Enter your organization name.
Organization Unit [OU] – Enter the organization unit that is ordering the certificate.
City/Town [L], State/Province [ST], Country [C] – Enter the address of your organization.
Email Id [ea] – Enter the email address to contact your organization.
Hash Function – Select a hash function for your certificate.
Key Size (in bits) – Select a key size for your certificate in bits.
In the Subject Alternative Name section, enter the IP address, DNS Name, and email address. This information is used to reference the server.
Click Generate to generate your CSR.
4 | Configuring Intelligent Sandbox for malware analysis
Results
Your CSR is now listed in the Certificate Singing Request Message section. You can use the icon in the Action column to Export or Remove your CSR. Once the certificate is singed, you can upload it as Web Certificate from the Manage Certificate page.
Integrate Intelligent Sandbox with compatible products
To enhance malware analysis, you can integration Intelligent Sandbox with compatible Trellix products.
Integration with McAfee ePO for OS profiling
When you integrate Intelligent Sandbox with McAfee ePO, you can correctly identify the target host environment and use the corresponding analyzer VM for dynamic analysis.
OS profiling requires a VM profile with the default name. To determine the analyzer VM for a file submitted by Network Security Platform or McAfee Web Gateway, Intelligent Sandbox uses the following sources of information in the same order of priority:
-
Intelligent Sandbox queries McAfee ePO for the operating system of a host based on its IP address. If information from this source or the corresponding analyzer VM is not available, it goes to the next source.
-
If Device Profiling is enabled, the Sensor provides the operating system and application details when forwarding a file for analysis. If information from this source or the corresponding analyzer VM is not available, it goes to the next source.
-
From the analyzer profile in the corresponding user record, Intelligent Sandbox determines the VM profile. If information from this source or if the corresponding analyzer VM is not available, it goes to the next source.
-
You can select a VM profile in your setup as the default.
When Intelligent Sandbox receives host information for a particular IP address from McAfee ePO, it caches this detail.
The cached IP address to host information data has a time to live (TTL) value of 48 hours.
For the first 24 hours, Intelligent Sandbox uses just the host information in the cache.
For the second 24 hours, Intelligent Sandbox uses the host information from the cache but also queries McAfee ePO and updates its cache. This updated information is valid for the next 48 hours.
If the cached information is more than 48 hours old, it treats it as if there is no cached information for the corresponding IP address. That is, it attempts to find the information from other sources and also sends a query to McAfee ePO.
The following explains how Intelligent Sandbox collaborates with McAfee ePO.
Network Security Platform or Web Gateway sends a file to Intelligent Sandbox for analysis. When Network Security Platform sends a file, the IP address of the target host is also sent.
Intelligent Sandbox checks its cache to see if there is a valid operating system mapped to that IP address.
If it is the first time that a file for that IP address is being analyzed, there is no information in the cache. So, it determines the analyzer VM from the device profiling information in case of Network Security Platform and user record in case of McAfee Web Gateway. Simultaneously, it sends a query to McAfee ePO for host information based on the IP address.
McAfee ePO forwards the host information to Intelligent Sandbox, which is cached for further use.
4 | Configuring Intelligent Sandbox for malware analysis
Configure McAfee ePO integration to publish threat events
You can enable Intelligent Sandbox to send sample data to McAfee ePO. You must install the ATDThreatEvents_5221.zip extension on ePO to allow Intelligent Sandbox to publish threat events.
Intelligent Sandbox Custom Fields & Data
Intelligent Sandbox sends the following data to McAfee ePO:
- Intelligent Sandbox software version
- Job ID
- Task ID
- Intelligent Sandbox IP address
- Source IP address
- IOC (Indicators of compromise) file Name
- MD5 value
- Time stamp
- Size
- Severity
- Indicators of compromise (IOC) file Data

Note
Indicators of compromise (IOC) file Data is available from 4.12.4.x and above versions.
Download IoC (Indicators of compromise) file
You can download the Indicators of compromise file Data for a selected threat event from Actions → Download IoC File. This option redirects you to the file link. You can open the file in browser by single click or downloaded by right click and Save As.
The Download IoC File will remain disabled if more than one event is selected. If an event is clean, the IoC file will not exist, in this case a message File does not exist is displayed instead of link.
Choose Columns
From Actions → Choose Columns, select the following data fields to see the Intelligent Sandbox Threat Events details:
- Intelligent Sandbox software version (MIS Version)
- Intelligent Sandbox IP address (TIS IP)
- IOC (Indicators of compromise) file Name
- MD5 value
- Severity
Queries and Reports
4 | Configuring Intelligent Sandbox for malware analysis
Generate the Queries and reports based on the following data fields to see the TIS Threat Events belonging to a category:
- Intelligent Sandbox software version (MIS Version)
- Intelligent Sandbox IP address (TIS IP)
- IOC (Indicators of compromise) file Name
- MD5 value
- Severity
Under Queries & reports → New Query → (Feature Group) Events → (Result Type) Trellix Intelligent Sandbox Events, above columns can be selected for:
- Chart → Bar labels
- Columns
- Filter
Note
The Queries and Reports, Choose Columns, and Download IoC custom fields are available from 4.12.4.x and above versions.
ePO Common Fields data
The following ePO Common Fields are sent by Intelligent Sandbox to McAfee ePO:
| ePO Field | Value |
|---|---|
| Detecting Product Name | Trellix Intelligent Sandbox |
| Detecting Product Version | Intelligent Sandbox software version |
| Threat Source IPv4 Address | Source IP address. |
| Threat Target Process Name | Refer IoC File, if event is not clean, else it is empty. |
| Threat Target File Path | Refer IoC File, if event is not clean, else it is empty. |
| Threat name |
tis_detected_threat_<MD5 Value of sample submitted for analysis>. Md5 is appended for 4.12.4 onwards. |
| Threat Type |
Threat Type for an event takes one of the following values based on the TIS Analysis Engine:
|
4 | Configuring Intelligent Sandbox for malware analysis
|
ePO Field |
Value | ||||||
|---|---|---|---|---|---|---|---|
| |||||||
|
Event Category |
Event Category for an event takes one of the following values based on following mapping of TIS Severity to Event Category:
| ||||||
|
Analyzer Detection Method |
Analyzer Detection Method for an event takes one of the following values based on the TIS Analysis Engine:
| ||||||
|
Threat Severity |
Threat Severity for an event takes one of the following values based on the following mapping of TIS Severity to Threat Severity: |
Trellix Intelligent Sandbox 5.0.x Product Guide39
4 | Configuring Intelligent Sandbox for malware analysis
| ePO Field | Value | ||||||||||||
|---|---|---|---|---|---|---|---|---|---|---|---|---|---|
|
Note
The ePO field values are based on 4.12.4 release. These fields are enhanced from 4.12.4 release and above versions.

Integrate Intelligent Sandbox with McAfee ePO
Integration enables McAfee ePO to gather information on the target host, and enables Intelligent Sandbox to send relevant data about submitted samples to McAfee ePO.
Task
- As an administrator, log on to McAfee ePO, then install the Intelligent Sandbox extension.
- Log on to the Intelligent Sandbox web interface.
- Click Manage → ATD Configuration → ePO Login/DXL.
- Select Enable ePO Login.
- Configure the ePO User Credentials options.
- To enable McAfee ePO to collect target host information, configure the options.
- Click Test ePO Login.
- If successful, click Submit.
- Configure the Publish Threat Events to ePO options.
- To enable Intelligent Sandbox to send relevant data about submitted samples to McAfee ePO, select Enable Threat Event Publisher.
4 | Configuring Intelligent Sandbox for malware analysis
-
From the Severity Level drop-down list, select the security level for the events you want to send to McAfee ePO.
-
On the Publish Threat Events Setting updated successfully message, click OK.
-
Click Apply.
Download and install the Intelligent Sandbox extension for threat events
The Trellix Intelligent Sandbox extension for threat events is available on the Trellix downloads site.
Make sure that you have the grant number you received during the product purchase.
Task
-
Go to Trellix Product Downloads.
-
Enter the grant number and email address associated with the product, then click Submit.
-
Search for Intelligent Sandbox Software and select the applicable version to show the available software.
-
Locate and download the ATDThreatEvents_XXXXX.zip extension for threat events to your local system. Make sure you use the correct extension.
-
Log on to the McAfee ePO server as an administrator.
-
Select Menu → Software → Extensions → Install Extension.
-
Click Choose File and select the extension, then click OK.
Integrate Intelligent Sandbox with DXL
DXL includes client software and one or more brokers that allow bidirectional communication between endpoints on a network. The DXL client is installed on each managed endpoint so that threat information can be shared immediately with all other services and devices, reducing the spread of threats.
Integrating Intelligent Sandbox with DXL enables Intelligent Sandbox to send the analysis report of the samples analyzed at Intelligent Sandbox to the DXL broker. Analysis reports of samples that meet the following are sent to DXL:
- Portable executable (PE) files with a severity score greater than or equal to 2
- Non-PE files with a severity score greater than or equal to 3
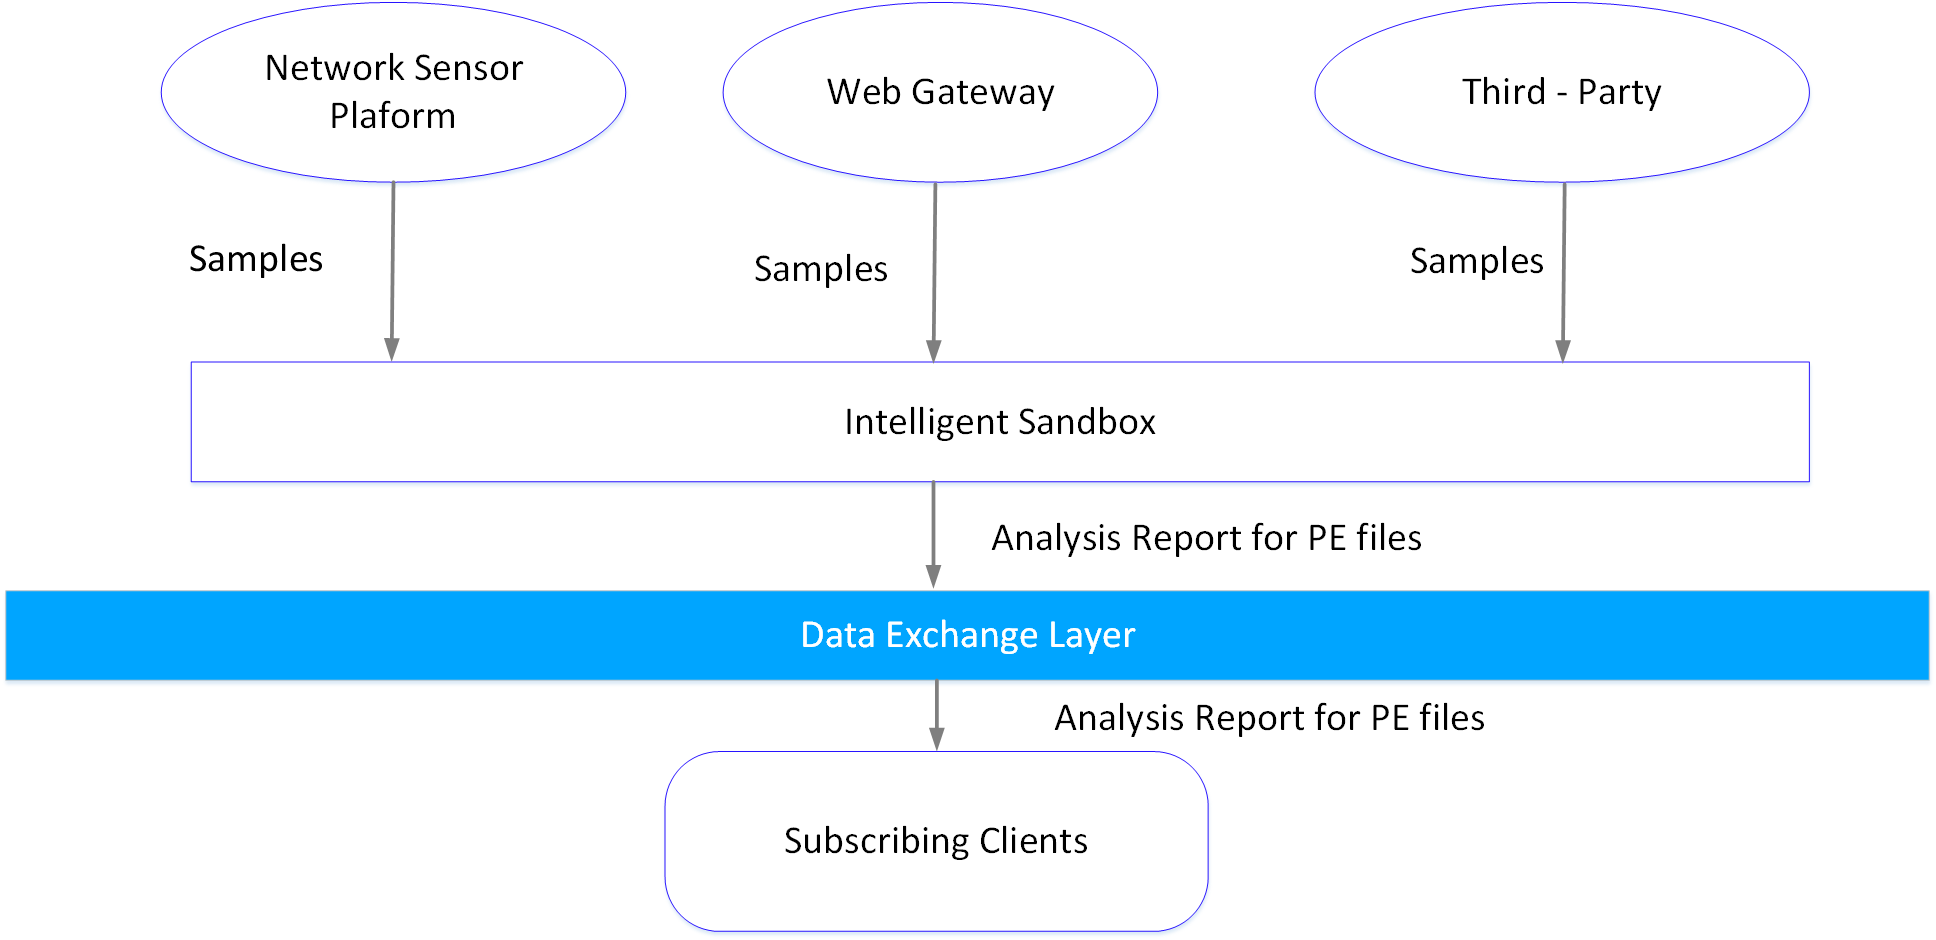
These analysis reports are published to a topic located at /mcafee/event/atd/file/report on the DXL broker. Clients such as Security Information and Event Management (SIEM) that subscribe to this topic can fetch analysis reports from DXL broker to build a robust security reputation database. Subscribing clients can refer to this database and treat files entering their network according to the analysis report of the files.
-
Intelligent Sandbox gets the sample files from different channels like Network Security Platform, Web Gateway, and so on for analysis.
-
The analysis summary is then sent to the DXL broker for further on-demand distribution to subscribing clients.
The following diagram explains Intelligent Sandbox and DXL integration.
4 | Configuring Intelligent Sandbox for malware analysis
If you want your Intelligent Sandbox to have exclusive rights to publish on the Intelligent Sandbox topic, then you must install the ATDDXLTag_3482.zip extension on McAfee ePO. This restricts publishing on the Intelligent Sandbox topic by any other sender.
Integrate Intelligent Sandbox with DXL
Configure Intelligent Sandbox to communicate with DXL.
Task
- Log on to the Intelligent Sandbox web interface.
- Click Manage → ATD Configuration → ePO Login/DXL.
- Select Enable DXL communication.
- From TIE Publishing Criteria, select a severity based criteria.
- Malicious (Medium to Very High) — To publish only malicious files that have severity level of Medium to Very High.
- All Samples — To publish all the samples.
- None — To publish no samples.
- Click Test Connection.
Verifies the connection between Intelligent Sandbox and the DXL broker channel.
- Click Apply.
Results
If more than one VM is configured in the analyzer profile, Intelligent Sandbox publishes the report for each VM.
Download and install the DXL extension
You must install the ATDDXLTag_3482.zip extension on ePO to allow Intelligent Sandbox to communicate with DXL. The DXL extension is available on the McAfee downloads site.
4 | Configuring Intelligent Sandbox for malware analysis
Before you begin
Make sure that you have the grant number you received during the product purchase.
Task
- Go to Trellix Product Downloads.
- Enter the grant number and email address associated with the product, then click Submit.
- Search for Intelligent Sandbox Software and select the applicable version to show the available software.
- Locate and download the
ATDDXLTag_XXXX.zipextension to your local system. - Log on to the McAfee ePO server as an administrator.
- Select Menu → Software → Extensions → Install Extension.
- Click Choose File and select the extension, then click OK.
Integrate Intelligent Sandbox with Active Response
Active Response is a threat detection and response tool. It provides real-time information about endpoints on your network.
Integrating Active Response enables Intelligent Sandbox to identify all endpoints in your network which are infected with a malicious file having a threat score of 3 and above.
 Note
Note
This feature does not support URL analysis.
Integrate Intelligent Sandbox with Active Response
Configure Intelligent Sandbox to communicate with Active Response.
Before you begin
- To integrate Intelligent Sandbox with Active Response, make sure that the Active Response search is working from McAfee ePO. For more information see, Trellix Active Response Installation Guide.
- To integrate Active Response workspace with Intelligent Sandbox, make sure that Active Response workspace extension is installed on McAfee ePO and all required configuration is completed for Active Response workspace. For more information see, Trellix Active Response Installation Guide.
Task
- Configure Active Response server:
- Log on to the Intelligent Sandbox web interface.
- Click Manage → TIS Configuration → ePO Login/DXL.
- Select Enable DXL communication and click Apply.
- Verify that the DXL Status is UP, then select Enable Active Response.
- Click Test Connection.
- On the Test connection is successful window, click Apply.
- Enable ATDDXL settings in McAfee ePO:
- Log on to the McAfee ePO and click Menu → Configuration → Server Settings → DXL Topic Authorization.
Trellix Intelligent Sandbox 5.0.x Product Guide 43
4 | Configuring Intelligent Sandbox for malware analysis
The DXL Topic Authorization page opens.
Click Edit in the bottom right corner.
The DXL Topic Authorization : Authorization Configuration page opens.
Select the checkbox for Active Response Server API.
Click Actions → Restrict Send Tags.
The Restrict Send Tags window opens.
Select ATDDXL and click OK → Save.
3. (Optional) Integrate Active Response workspace with Intelligent Sandbox:
-
Log on to the McAfee ePO and click Menu → Configuration → Server Settings → Trellix Intelligent Sandbox Server.
-
Click Edit in the bottom right corner.
The Edit Trellix Intelligent Sandbox Server page opens.
-
Enter the following:
Trellix Intelligent Sandbox (URL) For example: https://192.168.1.10 User Enter Intelligent Sandbox login credentials (username) Password Enter Intelligent Sandbox login credentials (password) Connection Select Connect insecurely, without certificate validation or click Validate Certificate
d. Click Save.
Integrate Intelligent Sandbox with Private GTI Cloud
You can configure Intelligent Sandbox to send queries to a Private GTI Cloud.
Before you begin
- For Intelligent Sandbox to integrate with the Private GTI Cloud, you must have certain Trellix certificates installed on all Intelligent Sandbox nodes. Contact Support for more information.
- Ensure that you have reset your
cliadminpassword. If you continue using the default password, the configurations might fail.
Task
Log on to the Intelligent Sandbox web interface.
Click Manage → TIS Configuration → Global Settings.
In the GTI Cloud Setting section, select Enable Private GTI Cloud.
In Private Cloud IP or Hostname, enter the IP address or the host domain name of your Private GTI Cloud.
4 | Configuring Intelligent Sandbox for malware analysis
Note
If you have configured a hostname, then ensure that the DNS resolves the hostname for Intelligent Sandbox.
5. Click Test Connection to check the connection status, then click Save.
Results
Note
We recommend you configure Private GTI Cloud using the Intelligent Sandbox web interface. In a Load Balancing scenario if you configure Private GTI Cloud using CLI, then the configuration will not sync automatically among the other nodes. You'd need to configure the nodes manually.
Integrate Intelligent Sandbox with TIE
You can enable Intelligent Sandbox to collect the TIE Enterprise and McAfee GTI/TIE Reputation data from the TIE server through the DXL channel.
When the DXL channel is enabled and the McAfee GTI/ TIE Reputation is configured in the analyzer profile, Intelligent Sandbox does a file reputation lookup, using McAfee GTI or TIE Enterprise Reputation, for the submitted samples through the DXL channel. If the administrator configures TIE Enterprise Reputation on McAfee ePO, the Threat Analysis Report shows the TIE Enterprise Reputation severity score. If not set, the McAfee GTI file reputation fetched from the TIE server is displayed in the Threat Analysis Report.
Receive External Reputation from TIE - Currently, we support reputation from MWG and ATD. If the file hashes were previously unseen in TIE Server and known Malicious from ATD/MWG, TIE adds it to its database.
TIE Enterprise Reputation severity score
Severity | Threat Level Mapping |
|---|---|
| unverified | Informational |
| low | Informational |
| very low | Informational |
| medium | Malicious |
| high | Malicious |
| very high | Malicious |
4 | Configuring Intelligent Sandbox for malware analysis
Intelligent Sandbox Reputation Mapping
Severity | Threat Level Mapping |
|---|---|
Medium (3) | TIE File Reputation (ATD) |
High (4) | TIE File Reputation (ATD) |
Very high (5) | TIE File Reputation (ATD) |
McAfee Web Gateway Reputation Mapping
Severity | Threat Level Mapping |
|---|---|
1-30 | TIE File Reputation (MWG) |
31-70 | TIE File Reputation (MWG) |
71-100 | TIE File Reputation (MWG) |
5 | Updating content
Updating content
To upload content to the Intelligent Sandbox Appliance, use the Intelligent Sandbox web interface.
Defining Custom Behavioral Rules
Custom Behavioral Rules is a set of YARA rules. YARA is a rule-based tool to identify and classify malware. Intelligent Sandbox enables you to use your own YARA rules to identify and classify malware. You can therefore import your own descriptions of malware into Intelligent Sandbox.
Custom Behavioral Rules also enable you to customize the detection capabilities of Intelligent Sandbox to suit your needs. For example, you can use Custom Behavioral Rules if you would like certain registry operations to be reported as a particular severity level rather than the default severity level assigned by Intelligent Sandbox. You can also write Custom Behavioral Rules to catch zero - day or near-zero-day malware. You can write your own Custom Behavioral Rules or use the YARA rules from a third party.
Note
In this section, the word sample refers to both files and URLs that have been submitted to Intelligent Sandbox for malware analysis.
You can store your Custom Behavioral Rules in a text file. You can name this file such that it enables you track modifications to your Custom Behavioral Rules set. You import this text file into Intelligent Sandbox through the web interface.
Assuming you have enabled all analyze options with custom YARA rules, Intelligent Sandbox processes the sample files and URLs in the following order of priority:
- Global Whitelist
- Local blacklist
- McAfee GTI
- Trellix Gateway Anti-Malware Engine
- Trellix Anti-Malware Engine
- Custom Yara Scanner
- Dynamic Analysis
- Custom Behavioral Rules — User-managed YARA rules.
- Internal YARA rules — Internal YARA rules that are defined by Trellix and updated during Intelligent Sandbox software upgrades. You cannot view or download these rules.
Note
Intelligent Sandbox checks a sample against YARA rules only if the sample is dynamically analyzed.
5 | Updating content
After you import your Custom Behavioral Rules into Intelligent Sandbox, the malware detection and classification are based on these rules as well. Final severity result of sample analysis is determined as a maximum value from analysis methods mentioned above, including custom YARA rules.
Considerations
Intelligent Sandbox 4.8 supports YARA 3.8. All YARA rules are migrated to YARA 3.8. This migration provides better performance and rich syntax. When you upgrade to Intelligent Sandbox 4.8, all Custom YARA rules are automatically compiled with YARA 3.8.
Intelligent Sandbox supports custom YARA rules only from Intelligent Sandbox release 3.2.0.
Intelligent Sandbox 3.2.0 supports YARA version 1.0 only. So, all YARA features documented in YARA User's Manual for version 1.0 are supported.
Intelligent Sandbox 3.4.8 supports YARA version 3.0.
Intelligent Sandbox 3.6.0 supports YARA version 3.1.
In an Intelligent Sandbox cluster setup, each node maintains its set of Custom Behavioral Rules separately. That is, the custom YARA rules that you define in the primary node are not sent to the secondary nodes automatically.
There is no limit on the number of rules that you can include in your Custom Behavioral Rules file. Neither is there a limit on the size of this file. However, the number of rules and their complexity might affect the performance of Intelligent Sandbox.
Create the Custom Behavioral Rules file
Intelligent Sandbox applies the Custom Behavioral Rules on the User API log of an analyzed sample. To create Custom Behavioral Rules to catch a specific behavior, you can use the user API log of a sample that caused the same behavior. You can use YARA rules to catch runtime DLLs, file operations, registry operations, process operations, and other operations reported in analysis summary report for a sample. For example, to catch a specific runtime DLL, see a sample's user API log and write a YARA rule for that DLL.
Before you begin
You are familiar with all features of Custom Behavioral Rules that Intelligent Sandbox currently supports.
You have identified the user API log of the sample that you want to use as a reference for creating your Custom Behavioral Rules.
Task
Create a text file and open it in a text editor such as Windows Notepad.
Enter the comments in the text file to track the APIs or data that are the sources for your Custom Behavioral Rules.
Write the first rule and provide it a name.
Enter the metadata for the rule.
Metadata is mandatory for standard rules and optional for helper rules. Regarding custom YARA rules, metadata can contain classification, description, and severity. Use a [metadata field name] = [string/value] format to define all these three metadata fields. These fields are case-insensitive.
Optionally, enter the classification value for Custom Behavioral Rules. Classification is the malware classification category to which a behavioral rule belongs. Use the following information to calculate the classification value.
5 | Updating content
|
Classification |
Value |
|---|---|
|
Persistence, Installation Boot Survival |
1 |
|
Hiding, Camouflage, Stealthiness, Detection and Removal Protection |
2 |
|
Security Solution / Mechanism bypass, termination and removal, Anti Debugging, VM Detection |
4 |
|
Spreading |
8 |
|
Exploiting, Shellcode |
16 |
|
Networking |
32 |
|
Data spying, Sniffing, Keylogging, Ebanking Fraud |
64 |
For example, if a YARA rule describes a malware that attempted to do spreading (value 8), installation boot survival (value 1), and networking (value 32) then total classification result is 8+1+32 = 41.
b. Enter the description for the rule, which is displayed in the analysis reports.
c. Enter a severity value for the behavior described by the YARA rule.
Severity value must be an integer from 1–5, with 5 indicating most malicious behavior. Severity values are irrelevant for helper rules.
- Log on the Intelligent Sandbox web interface.
- Click Analysis → Analysis Reports, click the report icon, then select User API Log.
- On the text editor, enter the strings and conditions according to YARA syntax.
- Add more rules according to your requirement in the same custom YARA text file, then save the file.
Disable custom behavioral rules in Intelligent Sandbox
You can troubleshoot Intelligent Sandbox by disabling custom behavioral rules.
Task
- Log on to the Intelligent Sandbox web interface.
- Click Manage → Global Settings.
- Clear the Apply Custom Behavioral Rules checkbox.
Trellix Intelligent Sandbox 5.0.x Product Guide
5 | Updating content
To enable the custom behavioral rules, select Apply Custom Behavioral Rules, then click Submit.
Define Custom Yara Scanner
Custom Yara Scanner is also a set of YARA rules, similar to Custom Behavioral rules. Custom Behavioral Rules is applied on the User API log of an analyzed sample. Custom Yara Scanner serves as an analyzing option in analyzer profile before analysis. Custom Yara Scanner is available as a static analysis option with no dependency on dynamic analysis.
Only enable the Customer YARA scanner in the corresponding YARA file that you upload to Intelligent Sandbox.
Create Custom YARA Scanner files
YARA Scanner files is a set of rules written in accordance with YARA manual. These rules are user-defined, written to identify any specific pattern in a file.
If Custom YARA Scanner is enabled in your analyzer profile as an analyzing option, Intelligent Sandbox checks for a presence of these user-defined rules in the samples being analyzed. If any defined rule is present in a file analyzed, then after the analysis Very High severity is displayed in the analysis report with threat name as the rule name. If defined rule is not present in the file analyzed, then Unverified is displayed in the analysis report for the file.
Define custom memory dump rules
The custom memory dump rules are a set of YARA rules. You can create a custom memory dump rule in Intelligent Sandbox to detect a specific behavior by utilizing the user memory dump log of a sample.
Additionally, you can also create custom memory dump rules to detect zero-day or near-zero-day malware. You can either create your own custom memory dump rules or use YARA rules from a third party.
To use the custom memory dump rule, you must:
- Create a custom memory dump rule.
- Import the rule.
- Enable the rule.
Create custom memory dump rule
To use the memory dump rule, you must first create a custom memory dump rule based on the memory dump logs.
Task
- In a text file, write the first rule and give it a name that will appear in the Analysis Report.
- Enter the comments in the text file to track the memory dump logs or data that are the source of your custom memory dump rules.
- Enter the metadata for the rule.
50
Trellix Intelligent Sandbox 5.0.x Product Guide
5 | Updating content
Metadata is mandatory for standard rules and optional for helper rules. Metadata includes classification, description, and severity information for custom memory dump rules. Use a [metadata field name] = [string/value] format to define these three metadata fields.
-
Enter the classification value for custom memory dump rules.
-
Enter the description for the rule, which is displayed in the analysis reports.
-
Enter a severity value. A severity value must be an integer from 1-5, with 5 indicating the most malicious behavior.
These severity values are irrelevant for helper rules.
When two rules are applied, only the rule with the highest severity is executed first. When both rules have the same severity, the rule that is applied first will be executed.
-
Log on the Intelligent Sandbox web interface.
-
Click Analysis → Analysis Reports, click
 , then select Memory Dump Logs.
 -
On the text editor, enter the strings and conditions according to YARA syntax.
-
Add more rules according to your requirement in the same custom YARA text file, then save the file.
Enable custom memory dump rule
When the custom memory dump rule is enabled as an analyzing option in your Analyzer Profile, Intelligent Sandbox checks samples for the presence of these user-defined memory dump rules.
Before you begin
Create and upload the memory dump rule.
Task
Enable Memory Dump in your Analyzer Profile.
Go to Manage → Global Settings and select Apply Custom Memory Dump Rules.
Import custom behavioral and YARA scanner rules
Import the custom rule files into Intelligent Sandbox. You can import a maximum of two YARA rules versions. The second version that you upload becomes the Current file, and renders the first version the Backup files. Intelligent Sandbox applies the rules in the Current DAT file for malware detection.
Task
Log on to the Intelligent Sandbox web interface.
Click Manage → Image & Software → Incremental Updates.
Click the YARA Rules tab.
Next to Upload File, click Browse, then locate and open the YARA file.
In the pop-up window, select the YARA file type.
Click Upload.
If there are syntax errors in the file, Intelligent Sandbox displays the Uploaded file contains invalid Custom Behavioral Rules. Please check system log for more details. message.
If you delete the Current YARA rule file, the Backup file replaces the Current file. To reinstate the Current file, click Revert.
Trellix Intelligent Sandbox 5.0.x Product Guide51
5 | Updating content
Load-balancing scenario
Manually upload the Custom Yara Scanner files on these nodes:
- Primary
- Secondary
- Backup
On the primary node, click Policy → Analyzer Profile, select the analyzer profile, then click Edit. Enable Custom Yara Scanner.
Change custom behavioral rules and YARA scanner files
Add and change the rules in custom behavioral rules and YARA scanner files.
Task
- Log on to the Intelligent Sandbox web interface.
- Click Manage → Image & Software → Incremental Updates.
- Click the YARA Rules tab.
- To download the file from the Intelligent Sandbox database onto your client, click the File Name link.
- Open the file that you downloaded in a text editor, make your changes, then save the file.
- On the Incremental Updates page, click Browse, locate and open the file, then click Upload.
Import Network Attack Rules
You can now import customized network attack rules. Network Attack Rules is a set of SNORT rules that are applied on the PCAP (Packet Capture) files of an analyzed sample. Intelligent Sandbox allows you to use your own SNORT rules to analyze and identify malicious activity in the network. Intelligent Sandbox applies the SNORT rule in the Current DAT file for malware detection. Network Attack Rules is available as a static analysis option in your analyzer profile.
Task
- Log on to the Intelligent Sandbox web interface.
- Click Manage → Image & Software → Content Updates.
- Click the Network Attack Rules tab.
- Next to Upload File, click Browse, then locate and select the ZIP file.
Note
You can import a maximum of two ZIP files that contains the SNORT rules and classification.config. The second file that you upload becomes the Current file and renders the first version of the Backup files. The file size can be maximum of 200 MB.
- Click Upload.
If there are syntax errors in the file, Intelligent Sandbox displays the Uploaded file contains invalid Custom Behavioral Rules. Please check system log for more details. message.
5 | Updating content
If you delete the Current file, the Backup file replaces the Current file. To reinstate the Current file, click Revert.
Manage whitelist database samples
Use the Intelligent Sandbox web interface to manage whitelisted files, URLs, and digital signatures.
" alt="note icon" style="vertical-align:middle;margin-right:6px;">Note
The whitelist database lists the MD5/SHA-256 hash values of trusted files and do not need to be analyzed.
Manage the file and URL samples
Add and remove file and URL samples that you have added to the whitelist database.
Task
- Log on to the Intelligent Sandbox web interface.
- Click Manage → Global Whitelist → File and URL.
- Configure the options you need.
- To upload a file or URL to the whitelist, configure the options.
To upload a file or URL to the whitelist on the Manual Upload page, go to Analysis → Manual Upload.
- To add a URL or MD5 to the whitelist, configure the options.
- To search and analyze the records, configure the options.
Alternately, you can add an analyzed sample to the whitelist database on the Analysis Reports page in the Analysis tab.
Manage the digital signature samples
White list a digitally signed certificate in Intelligent Sandbox to prevent in-depth scanning of certain known trusted files.
Task
- Log on to the Intelligent Sandbox web interface.
- Click Manage → Global Whitelist → Digital Signature.
- Click Browse... or drag and drop the portable executable (PE) file that contains the digital signature.
- To upload a digital signature to the white list, configure the options.
Trellix Intelligent Sandbox 5.0.x Product Guide53
5 | Updating content
Note
To upload a digital signature to the white list on the Manual Upload page, go to Analysis → Manual Upload..
-
To search and analyze the records, use the following options.
Note
Alternately, you can add an analyzed sample to the whitelist database using Analysis Reports page in the Analysis tab.
-
After the file name is populated in the text box, click Add Digital Signature.
Intelligent Sandbox will extract the digital signature from the file and add it to the white list.
Results
-
To upload a digital signature to the white list on the Manual Upload page, go to Analysis → Manual Upload..
-
To add an analyzed sample to the white list database, you can do so from the Analysis Reports page in the Analysis tab.
Manually update DAT version for Trellix Gateway Anti-Malware and Anti-Virus
Import up to two DAT for Trellix Gateway Anti-Malware Engine and Trellix Anti-Virus versions.
Task
-
Log on to the Intelligent Sandbox web interface.
-
Click Manage → Image & Software → Content Update.
-
Click Download Content.
You can also access the update package at https://contentsecurity.mcafee.com/update.
Note
If you do not want Intelligent Sandbox to automatically download and update the DATs, deselect Allow Automatic Update, then click Apply.
-
Click Browse, locate the DAT files on your system, then click Upload.
Update the detection package
Apply the latest detection package to Intelligent Sandbox.
Automatically download the latest Detection Package
Automatically download and install the latest Detection Package in Intelligent Sandbox.
5 | Updating content
Task
-
Log on to the Intelligent Sandbox web interface.
-
Allow automatic Detection Package downloads.
-
Click Manage → Image & Software → Content Update.
-
Under Auto Update, select Allow Automatic Update, then click Apply.
-
In the Success message, click OK.
-
-
Install the Detection Package.
-
On the Intelligent Sandbox toolbar, click the Detection Package alert message.
-
On the Uploaded Content window, then under the Action column, click Install next to the new detection package.
-
Manually upload the latest Detection Package
Manually upload and install the latest Detection Package in Intelligent Sandbox.
Before you begin
Ensure that you have downloaded the detection package for your Intelligent Sandbox version from the McAfee download site.
Intelligent Sandbox allows you to import a maximum of two versions of the Detection Package. The latest uploaded version is the Current upload by default, and renders the previous upload as Backup. The Detection Package designated as Current is applied for malware detection.
Task
6 | Analyzing malware
Analyzing malware
Upload files and URLs for analysis. You can monitor the status of malware analysis using Intelligent Sandbox web interface, then view the results.
Analyze files
Intelligent Sandbox performs static and dynamic analysis on the files you submit.
Guideline | Definition |
|---|---|
|
File submission methods |
You can submit files using the following methods:
|
|
Maximum file size |
The Intelligent Sandbox web interface, RESTful APIs, and Web Gateway support a maximum of 128 MB in file size. |
|
File name requirements |
When you use the following characters, file names are displayed as the file MD5 hash value: |

|
Guideline |
Definition |
|---|---|
For example, you submit vtest;32.exe. Intelligent Sandbox displays the file name as e2cfe1c89703352c42763e4b458fc356.exe.
| |
|
Static analysis |
Static analysis of Visual Basic for Applications scripts (VBA scripts) embedded inside a Microsoft Office application takes place inside the virtual machine. The analysis enhances the ability to identify threats that are disguised as VBA scripts. |
|
Dynamic analysis |
Dynamic analysis of Flash files occurs after you install the Internet Explorer-based Flash plug-in or Flash player on the virtual machine. The Flash plug-in is supported only for Internet Explorer on the virtual machine. When you install the Flash player and Flash plug-in, the Flash plug-in takes precedence. |
|
Pre-filtering |
Intelligent Sandbox supports file sample pre-filtering for these software:
|
6 | Analyzing malware
|
Guideline |
Definition |
|---|---|
The pre-filtering functionality ascertains classified Microsoft Office samples as clean, even before these samples are submitted for dynamic analysis. This reduces load on the virtual machines. |
Supported file types
|
File Types |
Static Analysis |
Dynamic Analysis |
|---|---|---|
|
32-bit Portable Executables (PE) files; |
|
|
|
Microsoft Office Suite documents |
|
|
6 | Analyzing malware
File Types | Static Analysis | Dynamic Analysis |
|---|---|---|
|
| |
| JustSystems Ichitaro documents |
|
|
| Adobe |
|
|
| Compressed files |
|
|
| Android application package | .apk | .apk |
| Java |
|
|
| Image files |
| Not supported |
| Other file types |
|
|
6 | Analyzing malware
| File Types | Static Analysis | Dynamic Analysis |
|---|---|---|
|
|
Upload files for analysis
To submit a file for analysis, you must select an analyzer profile. The analyzer profile overrides the default analyzer profile associated with your user account.
When archive files are submitted for analysis, .zip files are extracted by Intelligent Sandbox. The extracted files are then sent for analysis. All the other supported archive files are submitted for analysis directly.
Note
If the archive file is password-protected, ensure that you define the password in the analyzer profile.
60
Trellix Intelligent Sandbox 5.0.x Product Guide
6 | Analyzing malware
The sample file name has a 200 character or 200-byte limit. If your sample file name contains Unicode characters, you would see an error prompting that the filename is too long. This is because Unicode characters are not one byte per character always. As a result the filename goes beyond the 200-byte limit.
Task
Log on to the Intelligent Sandbox web interface.
Make sure that the required analyzer profile is available.
Click Analysis → Manual Upload.
Configure the options, then click Submit.
Manually upload files
Manually upload files to Intelligent Sandbox for analysis.
Before you begin
Make sure that the required analyzer profile is available with the Enable Malware Internet Access option selected.
To completely execute some malware, user intervention might be required.
For example, a default setting in the analyzer VM might pause the execution unless the setting is manually overridden. Some files might display dialog boxes, where you are required to make a selection or a confirmation. Malware demonstrates such behavior to determine if they are being executed in a sandbox. The behavior of the malware might vary based on your intervention. When you submit files in user-interactive mode, the analyzer VM opens in a pop-up window on your client computer and you can provide your input when prompted.
You can upload files to be executed in the user-interactive mode. This option is available only when you manually upload a file using the Intelligent Sandbox web interface. For files submitted by other methods, such as FTP upload and files submitted by Network Security Platform, requests for user intervention by the malware are not honored. However, the screen shots of all such requirements are available in the Screenshots section of the Analysis Summary report. Then you can manually resubmit such files in the user-interactive mode to know the actual behavior of the file.
Note
For XMode, Google Chrome version 44.0.2403 and later, and Mozilla Firefox version 40.0.3 and later are supported. Microsoft Internet Explorer is not supported.

Note
Because the analyzer VM is opened in a pop-up window, make sure the pop-up blocker is disabled in your browser.
Task
Log on the Intelligent Sandbox web interface.
Click Analysis → Manual Upload → Browse, then locate and open the file you want to submit for analysis. You can also drag and drop the file on the Drop your file here box.
Trellix Intelligent Sandbox 5.0.x Product Guide 61
6 | Analyzing malware
- If you are uploading a password-protected .zip file, make sure you have provided the password in the analyzer profile that you want to use for analysis.
- If dynamic analysis is required, the files in the .zip file are executed on different instances of the analyzer VM. If enough analyzer VMs are not available, some of the files are in the pipeline until analyzer VMs are available.
- Because the files in the .zip file are analyzed separately, separate reports are created for each file.
- Unicode is supported for the file name of samples. A file names can contain non-English characters and special characters.
Note
File names are displayed as the MD5 hash value of the file if the following characters are used: "< > | ; * ? # $ *

- The file name can be up to 200 bytes in length.
- From the Analyzer Profile drop-down list, select the analyzer profile.
- From the Submission Priority drop-down list, select the priority.
- Select one of these options, then click Submit
- User Interactive Mode (XMode)
On the Uploaded File Successfully window, click OK, then click OK on the pop-up message. On the Analysis Status page, locate the sample and click X-Mode.
When the file execution completes, the VM automatically shuts down and you are unable to use Connect to view the VNC session. When you click Disconnect, Intelligent Sandbox closes the VNC session from the client and displays the VNC disconnected message.
Enabling X-Mode overrides the maximum execution time in the Analyzer profile to the X-Mode time.
- Skip files if previously analyzed.
Intelligent Sandbox is unable to skip sample analysis in these scenarios:
- Analyzer profile settings change after the last analysis
- The last submitted sample analysis occurred three days prior
- You used URL Download to submit the samples
Note
When you submit a previously analyzed .zip file, Intelligent Sandbox displays the sample with the highest severity.
Note
Password protected PDF files will be analyzed only in X-Mode, where user can provide the password. In non X-Mode, the sample will have its severity marked as Failed with the message Pre-filter heuristics determined that this file is encrypted and therefore cannot be analyzed.
6 | Analyzing malware
Upload samples for analysis in skip analysis mode
You can configure Intelligent Sandbox to skip analysis of the submitted samples, if the same has been analyzed previously.
Task
-
Select Analysis → Manual Upload.
-
In the Manual upload field, click Browse and select the file you want to submit for analysis or drag and drop the file into the specified box.
-
In the Analyzer Profile field, select the required analyzer profile from the drop-down list.
-
In the Submission Priority field, select the priority from the drop-down list.
-
Select Skip files if previously analyzed.
-
Click Submit.
The sample is uploaded to Trellix Intelligent Sandbox and a success message with the details specifying that the submitted file was previously analyzed is displayed.
-
Click OK in the Uploaded File Successfully dialog box.
Note
Sample analysis is not skipped in the following scenarios:
- If Analyzer Profile is modified after the last analysis
- If the submitted sample was analyzed more than three days ago
- If the samples are submitted via URL Download method
Note
If a previously analyzed .zip file is submitted again, a single sample from the .zip with highest severity is displayed.
Upload files for analysis using SFTP
Using SFTP, you can upload supported file types to the FTP server on Intelligent Sandbox.
Before you begin
- Your user name has FTP Access privilege. This is required to access the FTP server hosted on Intelligent Sandbox.
- You have created the required analyzer profile that you want to use.
- You have installed an FTP client on your machine.
Note
By default, FTP is not a supported protocol for uploading samples. To use FTP to upload files, you must enable it using the
set ftp enableCLI command.
Task
-
Open your FTP client and connect to Intelligent Sandbox using the following information.
Trellix Intelligent Sandbox 5.0.x Product Guide
63
6 | Analyzing malware
- Host — Enter the IP address of Intelligent Sandbox
- User name — Enter your Intelligent Sandbox user name
- Password — Enter your Intelligent Sandbox password
- Port — Enter 22, which is the standard port for SFTP. For FTP, enter 21.
- Upload the files from the local site to the remote site, which is on Intelligent Sandbox.
- Log on to theIntelligent Sandbox web interface.
- Click Analysis → Analysis Status and monitor the status of the uploaded files.
Analyze URLs
Intelligent Sandbox analyzes the URL in an analyzer VM determined by the user profile, and reports the file analysis results. Intelligent Sandbox uses only the local blacklist and dynamic analysis for the downloaded file. In addition, the McAfee GTI reputation of the URL is reported. The behavior of the browser when opening the URL is also analyzed for malicious activity.
Follow these methods to submit URLs:
- Manually upload the URL using the Intelligent Sandbox web interface.
- Use the restful APIs to upload URLs. See the Trellix Intelligent Sandbox RESTful APIs Reference Guide.
Malicious websites typically contain multiple types of malware. When a victim visits the website, the malware that suits the vulnerabilities present in the endpoint is downloaded. You can create multiple analyzer VMs, each with different operating systems, browsers, applications, browser plug-ins that are relevant to your network. Also, if the browsers and operating systems are unpatched, it might enable you to analyze the actual behavior of web sites.
The advantage of using Intelligent Sandbox is that, you can get a detailed report of previously unknown malicious domains, websites, and IP addresses as well as the current behavior of known ones. You can also get a detailed analysis report for even benign sites that are recently compromised.
Intelligent Sandbox analyzes the URL samples and generates a Graph Modeling Language (GML) file. This file is in an ASCII plain text format, which contains data to generate a graphical representation of the logic execution path. You cannot directly view this file in the Intelligent Sandbox web interface.
Note
- Full Logic Path is not available for Non-PE files. If you submit a non-PE file with FLP enabled, Intelligent Sandbox will ignore the setting and proceed with dynamic analysis.
- GTI Reputation is enabled by default. This setting allows Intelligent Sandbox to analyze URLs.
Analyzing URLs
To analyze URLs, select an analyzer profile that has both sandbox and Internet access enabled.
- Intelligent Sandbox uses a proprietary procedure to calculate the MD5 hash value of the URL. Then, it checks this MD5 against its local blacklist.
6 | Analyzing malware
-
It is assumed that the file that the URL refers to is of a supported file type. Then Intelligent Sandbox dynamically analyzes the file using the corresponding analyzer VM. It is assumed that the MD5 of the URL is not present in the blacklist or Run All Selected option is selected in the corresponding analyzer profile.
Note
McAfee GTI File Reputation, Anti-Malware, and Gateway Anti-Malware analyze options are not relevant for URLs.
-
Dynamic analysis and reporting for URLs is similar to that of files. It records all activities in the analyzer VM including registry operations, process operations, file operations, runtime DLLs, and network operations. If the webpage downloads any dropper files, Intelligent Sandbox dynamically analyzes these files as well and includes the results in the same report under embedded/dropped content section.
-
If a dropped file connects to other URLs, all these URLs are checked with TrustedSource for URL reputation and categorization.
-
Intelligent Sandbox analyzes the URL samples and generates a Graph Modeling Language (GML) file. This file is in an ASCII plain text format, which contains data to generate a graphical representation of the logic execution path. You cannot directly view this file in the Intelligent Sandbox web interface.
Only HTTP, HTTPS, and FTP protocols are supported for URL analysis.
Upload URLs for analysis using Intelligent Sandbox web interface
You can upload the URLs using two different options based on their requirements.
Before you begin
Make sure that the required analyzer profile is available with sandbox and Enable Malware Internet Access options selected.
These options are available for manually uploading URLs:
-
URL—The selected URL is sent to the analyzer VM, and the file pointed to by the URL is downloaded to the analyzer VM for analysis. For example, when a user submits the URL http://the.earth.li/~sgtatham/putty/latest/x86/putty.exe, the URL is sent to the analyzer VM, then the putty.exe file is downloaded to the analyzer VM.
-
URL Download—The selected URL is downloaded to the Intelligent Sandbox. The file which the URL is pointing to is downloaded locally in the Intelligent Sandbox and the downloaded file is then sent to the static analyzers and the analyzer VM for analysis. For example, when a user submits the URL http://the.earth.li/~sgtatham/putty/latest/x86/putty.exe, the putty.exe file is downloaded to the Intelligent Sandbox, then sent to the analyzer VM.
When you use the Intelligent Sandbox web interface to submit a URL for analysis, select an analyzer profile. This analyzer profile overrides the default analyzer profile associated with your user account.
Trellix Intelligent Sandbox 5.0.x Product Guide
65
6 | Analyzing malware
Manual upload using URL option
Manually upload URLs to Intelligent Sandbox for analysis.
Task
- Log on to the Intelligent Sandbox web interface.
- Click Analysis → Manual Upload.
- Configure the options, then click Submit.
Monitor the status of malware analysis
The Analysis Status page provides status of your submitted files till the analysis is complete.
Once the analysis is complete, the analysis details can be found on the Analysis Reports page.
Task
- Log on to the Intelligent Sandbox web interface.
- Click Analysis → Analysis Status.
- From the drop-down lists, configure the view and refresh criteria.
- The default refresh interval is 1 minute.
- By default, results from the last 24 hours are displayed. You can specify this criteria based on time or number. For example, you can select to view the status for files submitted in the last 5 minutes or for the last 100 samples.
- To refresh the Analysis Status page now, click
 .
.
- Enter your filter criteria, then click Search.
Suppose that you have selected File Name and Status as the criteria, selected Case Sensitive, and specified Com. All the records in the completed state and file names starting with the characters Com are listed.
- Hide the columns that you do not require.
- Move the mouse over the right corner of a column heading and click the drop-down arrow.
- Select Columns.
- Select only the required column names from the list.
Note
You can click a column heading and drag it to the required position.
- To sort the records based on a particular column name, click the column heading.
You can sort the records in the ascending or descending order. Alternatively, move the mouse over the right corner of a column heading and click the drop-down arrow. Then select Sort Ascending or Sort Descending. By default, the records are sorted in descending order based on the Submitted Time column.
- To cancel analysis of multiple pending files, select the files using the checkbox and click Cancel Selected.
- To cancel analysis all pending files, click Cancel All Pending.
6 | Analyzing malware
Note
Cancel Selected and Cancel All Pending are applicable only for the files in Pending state and not in Analyzing state.
9. Click 
Submit files for reanalysis
You can re-analyze the files that are submitted for analysis, from the Analysis Reports page.
Reanalysis of the file is not supported for the samples (samples not available in the Results directory) that were not submitted earlier to Intelligent Sandbox for analysis.
Reanalysis of the file is not supported in the following scenarios:
- The samples that are blacklisted manually.
- The whitelisted samples.
Task
- Log on to the Intelligent Sandbox web interface.
- Click Analysis → Analysis Reports. The Analysis Reports page lists the status of the completed files.
- Right-click the report
 and select Re-Analyse the File.
 - From the Analyzer Profile drop-down list, select the analyzer profile.
- From the Submission Priority drop-down list, select the priority. Optionally, the User Interactive Mode (XMode) check box allows you to use the X-Mode.
- Click Submit. The submitted file is sent for reanalysis and the status of the file can be viewed on the Analysis Status page.
View the analysis results
View the file analysis results on the Analysis Reports page. In dynamic analysis if you have selected multiple VM profiles, the file has one Job ID and separate Task IDs for each VM profile. In Static Analysis, when a sample is detected then only one entry with one Job ID and one Task ID is created.
Note
- Older reports are deleted when the data disk of Intelligent Sandbox is 75% full. You can view the current data disk space available in the System Health monitor of the Dashboard. If you configure the options under FTP Result Output in the User Management page and use the
set resultbackup enablecommand, then Intelligent Sandbox saves the results locally and sends them to the configured FTP server for your long-term use.- To save the FTP results for a longer time period, configure the FTP Result Output settings, then enable
set resultbackupfrom the Intelligent Sandbox CLI.- While you view the reports, the maximum number of reports you can navigate to are one million. If you want to view the reports beyond that, use the search filter to reduce the result of the number of reports.
Trellix Intelligent Sandbox 5.0.x Product Guide 67
6 | Analyzing malware
Task
-
Log on to the Intelligent Sandbox web interface.
-
Click Analysis → Analysis Reports.
The Analysis Reports page lists the status for the completed files.
Note
If you do not have administrator permissions, only those files that you submitted are listed. A user with admin permissions can view the samples submitted by all users.
-
Click Export CSV to export locally the status of completed files in CSV format and then click Download CSV.
Note
You can export a maximum of 1 million records by using Export CSV operation.
The CSV report is downloaded and the CSV file is zipped in the results.zip file.
-
Specify the criteria for viewing and refreshing the records in the Analysis Reports page.
-
Set the criteria to display records in the Analysis Reports page.
By default, the results for the files completed in the last 24 hours are shown.
You can specify this criteria based on time or number. For example, you can select to view the files for which the analysis was completed in the last 5 minutes or for the last 100 completed files.
-
Set the frequency at which the Analysis Reports page must refresh itself.
The default refresh interval is 1 minute.
-
To refresh the Analysis Reports page now, click
 .
.
-
-
Choose to hide the columns that you do not require.
-
Move the mouse over the right corner of a column heading and click the drop-down arrow.
-
Select Columns.
-
Select only the needed column names from the list.
-
Note
You can click a column heading and drag it to the needed position.
-
To sort the records based on a particular column name, click the column heading.
You can sort the records in the ascending or descending order. Or, move the mouse over the right corner of a column heading and click the drop-down arrow. Then select Sort Ascending or Sort Descending.
By default, high severity files are shown at the top of the list.
-
To save the Analysis Reports page settings, click
 .
.
6 | Analyzing malware
Understanding Threat Analysis Report
The Threat Analysis report is an executive brief detailing key behaviors of the sample file.
Intelligent Sandbox allows you to download the Threat Analysis report in these file types:
- HTML
- Text
- XML
- JSON
- OpenIOC
- STIX
The XML and JSON formats provides well-known malware behavior tags for high-level programming script to extract key information. Network Security Platform and Web Gateway use the JSON formats to display the report details in their user interfaces.
Intelligent Sandbox also supports OpenIOC and STIX formats, which you can use to share threat information. With the OpenIOC and STIX formats, you can share the Analysis Summary reports with other security applications for a better understanding, detection, and containment of malware. For example, you can manually submit the OpenIOC and STIX reports to an application, which query hosts for the indicators in the report. This way you can detect the infected hosts, and then take the needed remedial actions to contain and remove the malware.
The Threat Analysis reports in the OpenIOC and STIX formats are available in the sample Complete Results file.
Threat Analysis report content
| Formats | Severity -6 | Severity -2 | Severity -1 | Severity 0 | Severity 1 | Severity 2 | Severity 3 | Severity 4 | Severity 5 |
|---|---|---|---|---|---|---|---|---|---|
| HTML | X | X | X | X | X | X | X | X | X |
| Text | X | X | X | X | X | X | X | ||
| X | X | X | X | X | X | ||||
| XML | X | X | X | X | X | X | X | X | |
| JSON | X | X | X | X | X | X | X | X | X |
| OpenIOC | X | X | X | ||||||
| STIX | X | X | X | X | X |
Trellix Intelligent Sandbox 5.0.x Product Guide69
6 | Analyzing malware
| Formats | Severity -6 | Severity -2 | Severity -1 | Severity 0 | Severity 1 | Severity 2 | Severity 3 | Severity 4 | Severity 5 |
|---|---|---|---|---|---|---|---|---|---|
| STIX | X | X | X |
Threat and Engine Level Severity Mapping
| Threat Level | Engine Analysis Severity |
|---|---|
| 5 - Very High | 5 - Very High |
| 4 - High | 4 - High |
| 3 - Medium | 3 - Medium |
| 2 - Low | 2 - Low |
| 1 - Very Low | 1 - Informational |
| 0 - Informational | 0 - Unverified |
| -1 - Clean | -1 - Clean |
| -2 - Failure | -2 - Fail/Unverified |
What the severity translates to:
- Severity -6 – Incomplete. The submitted file analysis failed or incomplete.
- Severity -2 – Failed. Intelligent Sandbox is unable to analyze the submitted file.
- Severity -1 – Clean. The submitted file is not a malware.
- Severity 0 – Informational. The submitted file has insufficient or invalid information for analysis.
- Severity 1 – Very low activity. The submitted file hasn't shown signs of a malware.
- Severity 2 – Low activities. The submitted file shows signs of a malware that pose low risk.
- Severity 3 – Likely to be malicious. The submitted file shows signs of a malware that pose medium risk.
- Severity 4 – Malicious. The submitted file shows signs of a malware that pose high risk.
- Severity 5 – Very high. The submitted file shows signs of a malware that pose high risk.
The report also provides errors in simple terms. Here are some examples:
6 | Analyzing malware
For archive samples
|
Analysis report description |
Error description |
|---|---|
|
Invalid Archive content |
The archive sample has files that are corrupt or file with multibyte unicode characters file names. This cause the archive extraction to fail. |
|
Archive is empty |
The archive sample is empty. There are no files to be extracted and analyzed. |
|
Unsupported Archive |
This error appears due to the following reasons:
|
For non-archive samples
|
Analysis report description |
Error description |
|---|---|
|
File type not supported |
Intelligent Sandbox does not support this file type for analysis. |
|
Below minimum file size |
The sample submitted for analysis does not meet the minimum file size configured for its type in the Global settings page. |
- The Submitted Time and Completed Time in the Analysis Reports page displays the time stamp with the local timezone in its suffix.
- The HTML or PDF reports for a sample displays the Submitted time stamp mentioned in UTC time zone.
- Previously the HTML or PDF reports displayed the time stamp in the local timezone.
- The JSON report sent to managed products will have time stamp in UTC timezone.
- The Instances column in the Analysis Report displays the total number of times a sample was analyzed by a specific user. For more details such as the list of samples, click on the number.
For admin users, the column displays the number of times a sample was submitted by all users.
Trellix Intelligent Sandbox 5.0.x Product Guide 71
6 | Analyzing malware
For example, when logged in using the nsp username, the column displays the number times a sample was submitted using this username.
Note
- The updated time might take few minutes to reflect in the reports page post migration. This is dependent on the size of the reports database.
- The Instances column is not included when exporting the report to CSV.
- Search queries on the number of instances are not supported.
Timeline view
The Timeline view in the report displays a timeline activity graph and timeline activity details table detailing the order and time of events for a submitted sample. This view is available in both HTML and PDF versions of the report.
The Timeline Activity section provides a graphical representation of the events for the submitted sample. The event logged for each file sample includes:
- Process activity - Activities such as creation or termination of a process.
- File activity - Activities such as read, write, or closing of files.
- Registry keys - Creation, change, or deletion of registry keys.
- Network operations - Suspicions network activities.
The graph on an HTML report is dynamic, allowing you to perform the following actions:
- Hover over the event – Provides detailed information about the number and type of events with the time-offset.
- Zoom-in – Allows you to zoom into the timeline, which provides precise offset between closely occurring events.
The graph on a PDF report is a static image of the graph.
Apart from the graphical representation of events, the timeline view provides more details about the event through the Timeline Activity Details table. The table contains the following details for an event:
- Time offset of the event
- The event itself
- The description details of the event.
MITRE ATT&CK™ Matrix
This section displays the list of techniques, its respective IDs and corresponding tactics used by the sample. On expanding each technique, you can also see an overview of the technique followed by a severity rating. If a technique contains sub-techniques, upon expanding the technique, you can see the list of detected sub-techniques which you can further expand to see the overview of the sub-techniques followed by a severity rating.
Machine Learning Prediction
The Intelligent Sandbox Machine Learning Prediction section displays the verdict and probability factor of the analysis through machine learning. This section does not appear in the report if you have not enabled Machine Learning in your analyzer profile.
6 | Analyzing malware
To enable, edit your analyzer profile, and select Machine Learning Prediction under Dynamic Analysis. You can also enable Machine Learning when you create an analyzer profile.
Note
Machine Learning analysis only scans PE files.

Family Classification
The Family Classification section displays the category of malware present in the file submitted.
Note
If the parent file generates other files with malicious content, it shows categories of malware in the subordinate files too.
To use the Family Classification option, you must have enabled the Disassembly Results option in the corresponding analyzer profile.
Network Analysis result
This section displays the classification and threat details executed by the PCAP file of an analyzed sample. The classification and threat details are displayed from customer's classification.conf and .rule files respectively.
This section is not displayed in the report in the following scenarios:
- If you have not enabled Custom Network Attack Rules in analyzer profile.
- Even after enabling Custom Network Attack Rules, there is no network attack rule applied on the PCAP file of an analyzed sample.
Understanding the fields in the Intelligent Sandbox JSON Report
- MISversion – Intelligent Sandbox software version.
- SUMversion – Deprecate field. Intelligent Sandbox software version.
- DETversion – Shows the version of the current detection package installed.
- OSversion – Operating system name and version of the sandbox that processed the sample.
- JSONversion – Version of the JSON package used to generate the report.
- StaticAnalysis – If sample was not sent to sandbox for analysis then this flag will be True.
- hasDynamicAnalysis – If sample was sent to sandbox for analysis then this flag will be True.
View the Threat Analysis report
Intelligent Sandbox allows you to view the report on the web interface and also to download an offline copy of the report in supported formats.
Task
- Log on to the Intelligent Sandbox web interface.
- Click Analysis → Analysis Reports.
Trellix Intelligent Sandbox 5.0.x Product Guide
73
6 | Analyzing malware
-
To view the Threat Analysis Report in HTML format, you can double-click a sample or do the following:
-
Select a sample.
-
In the Reports column, click
 , then select Analysis Summary (HTML).
-
-
To download the Threat Analysis Report, select a sample, then click [IMAGE PLACEHOLDER: small download icon], then select one of the options from the list. Intelligent Sandbox allows you to download the analysis result of your selected sample in the following formats:
- Analysis Summary (PDF)
- Disassembly Results
- Logic Path Graph
- MITRE ATT&CK Report
- User API Log
- Complete Results
View the Dropped Files report
You can download a .zip file containing all the files that the sample created or touched during dynamic analysis.
You can download these files using one of the following methods.
-
In the Analysis Reports page (Analysis → Analysis Reports), click
and select Dropped Files. Download the dropfiles.zip file, which contains the files that the sample created in the sandbox. To use this option, you must have enabled the Dropped Files option in the corresponding analyzer profile. -
After you click [IMAGE PLACEHOLDER: small download icon], select Complete Results. Download the <sample_name>.zip file. This .zip file contains the same dropfiles.zip inside the AnalysisLog folder. The Complete Results contains the dropfiles.zip regardless of whether you have enabled Dropped Files option in the corresponding analyzer profile.
Viewing and Understanding the Disassembly Results report
The Disassembly Results report provides the disassembly output listing for portable executable (PE) files. This report is generated based on the sample file after the unpacking process has completed. It provides detail information about the malware file such as, the PE header information.
The Disassembly Results report includes the following information:
- Date and time of the creation of the sample file
- File PE and Optional Header information
- Different section headers information
- The Intel disassembly listing
Enable Disassembly Results report for an analyzer profile
Change the analyzer profile settings and enable Disassembly Results.
Task
-
Log on to the Intelligent Sandbox web interface.
6 | Analyzing malware
-
Make sure the users assigned to the analyzer profile are logged off from Intelligent Sandbox.
-
Click Policy → Analyzer Profile, select a profile, then click Edit.
-
From Reports, Logs, and Artifacts, select Disassembly Results, then click Save.
View the Disassembly Results report
You can view the Disassembly Results report in the Intelligent Sandbox web interface or download it as a file to your client computer. The contents of the report are the same in both the methods.
-
To view the Disassembly Results report in the Intelligent Sandbox web interface, select Analysis → Analysis Reports.
In the Analysis Reports page, click
 and select Disassembly Results. To use this option, you must have enabled the Disassembly Results option in the corresponding analyzer profile.
 -
To download the report as a file, click [IMAGE PLACEHOLDER: small download icon] in the Analysis Reports page and select Complete Results. Download the <sample_name>.zip file. This .zip file contains a file named as <file name>_detail.asm in the AnalysisLog folder. The Zip Report contains this .asm file regardless of whether you have enabled Disassembly Results option in the corresponding analyzer profile.
The Disassembly Results report provides the assembler instructions along with any static standard library call names like printf and Windows system DLL API call names embedded in the listing. If the global variables such as string text are referenced in the code, these string texts are also listed.
A section of a sample Disassembly Results report
Column 1 | Column 2 | Column 3 |
|---|---|---|
:00401010 | e8 1f2c0000 | call 00403c34 |
The virtual address of the instruction is shown in column 1, the binary instruction in column 2, and the assembly instruction with comments is in column 3. In the preceding example the call 00403c34 instruction at memory location of 00401010 is making a functional call at 0x403c34 memory location, which is determined to be system DLL API function call determined to be URLDownloadToFileA(). The comment shown with the ;; in this listing provides the library function name.
Logic Path Graph
The Logic Path Graph is a graphical representation of function call cross-references that Intelligent Sandbox discovers during dynamic analysis. You can use the report to view the executed and non-executed functions in analyzed files that occurred during dynamic analysis.
Warning
If you find non-executed functions, you must fix them immediately.
Trellix Intelligent Sandbox 5.0.x Product Guide75
6 | Analyzing malware
The Logic Path Graph report is available in the Graph Modeling Language (GML) file format. The file is in ASCII plain text format, which contains a graphical representation of the logic execution path of the sample in the GML (Graph Modeling Language) format. You cannot directly view this file in the Intelligent Sandbox web interface, but download it to your client computer. Then you must use a graphical layout editor, like yWorks yEd Graph Editor, that supports GML format. You can use such an editor to display the cross-reference of all functions using this file as an input.
You can download the Logic Path Graph file using one of the following methods.
-
In the Analysis Reports page (Analysis → Analysis Reports), click
 and select Logic Path Graph. Then download the <file name>_logicpath.gml file. To use this option, you must have enabled the Logic Path Graph option in the corresponding analyzer profile.
 -
After you click [IMAGE PLACEHOLDER: small menu icon], select Complete Results. Download the <sample_name>.zip file. This .zip file contains the same <file name>_logicpath.gml file in the AnalysisLog folder. The Zip Report contains the <file name>_logicpath.gml file regardless of whether you have enabled Logic Path Graph option in the corresponding analyzer profile.
This section uses yWorks yEd Graph Editor to explain how to use the Logic Path Graph GML file. In the yEd Graph Editor, you must first set the Routing Style. You need to do this only once, and this setting is saved for further use.
- To open the Logic Path Graph file, use your yEd Graph Editor.
- Click Layout → Hierarchical.
- Click Edges, select Polyline from the Routing Style drop-down list, then click Ok.
When you open the <file name>_logicpath.gml file in yEd Graph Editor, initially you might see many rectangle boxes overlapping each other.
Layout of the subroutines relationships
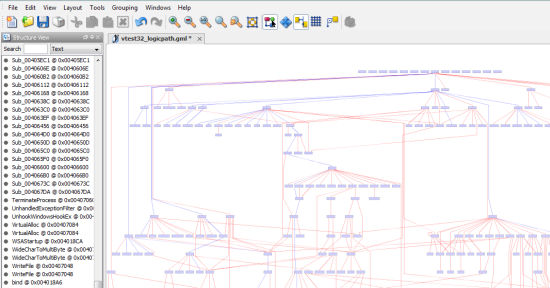
6 | Analyzing malware
The graph depicts an overview of the complexity of the sample as seen by the cross-reference of function calls. The following shows more detail on the function names and their addresses as seen by zooming in.
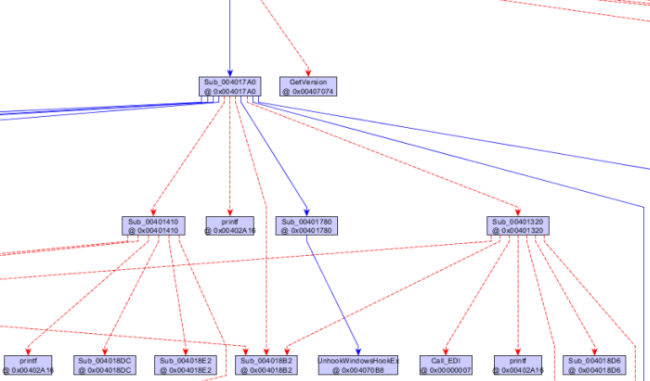
Two colors are used to indicate the executed path. The red dash lines show the non-executed path, and the blue solid lines show the executed path.
According to the preceding control graph, the subroutine (Sub_004017A0) at virtual address 0x004017A0 was executed and is shown with a blue solid line pointing to the Sub_004017A0 box. However, the subroutine (GetVersion) was not called potentially as there is a red dash line pointing to it.
The Sub_004017A0 subroutine is making 11 calls as there are 11 lines coming out of this box. Seven of these 11 calls were executed during dynamic analysis. One of them is calling Sub_00401780 as there is a blue solid line pointing from Sub_004017A0 to Sub_00401780. Calls to Sub_00401410, printf, Sub_00401882, and Sub_00401320 were not executed and shown with red dashed line pointing at them.
The Sub_00401780 subroutine is making only one unique call as there is only one line coming out from this box. This call was executed during dynamic analysis.
MITRE ATT&CK Report
The MITRE ATT&CK™ report displays the cyber adversary behavior table. The table provide details about the order of the ATT&CK content for a submitted sample. You can capture the report as a screenshot or export it as a json file.
The report provides the following information:
- File name – The sample file name.
Trellix Intelligent Sandbox 5.0.x Product Guide77
6 | Analyzing malware
File hash – The MD5 hash value of the sample.
Severity – The threat level of the sample.
Tactics, Techniques, and Sub-Techniques – The number of tactics, techniques, and the corresponding sub-techniques used by the submitted sample.
ATT&CK Matrix – The matrix shows all tactics (in the first row), and the techniques in the rest of the table. These techniques are further expanded to list all the sub-techniques which are triggered by the sample.
The techniques and sub-techniques are highlighted in various colors to represent the risk level posed by the sample. High risk techniques and sub-techniques are shown in a darker shade of red, while low risk is shown in green. The toggle switch allows you to switch view between showing only the risk items and all items in the table. You can also click each technique or sub-technique to see an overview about the item.
These options are available for the user to interact with the MITRE Matrix report:
Option | Description |
|---|---|
|
|
Toggles the theme of the MITRE Matrix report. These are the themes: Light and Dark. |
|
|
Captures the screenshot of the MITRE Matrix report. |
|
|
Exports the matrix information to navigator.json file. You can upload this JSON file here to create a layer on the MITRE ATT&CK™ Navigator with all the techniques and sub-techniques detected by Intelligent Sandbox. |
|
|
Scrolls the report from right to left. |
|
|
Scrolls the report from left to right. |
|
|
Expands the sub-techniques of all the techniques. |
|
|
Collapse the sub-techniques. |


6 | Analyzing malware
| Option | Description |
|---|---|
|
|
Allows you to filter the tactics column to be displayed. |
|
|
Enables and disables the display of technique and sub-technique IDs. |
|
|
|



Important
Intelligent Sandbox allows you to generate a MITRE ATT&CK™ report for a sample that triggers the behavior linked to MITRE techniques in the sandbox. You cannot generate an ATT&CK report on Intelligent Sandbox if the sample was detected only through any of the following:
- GTI URL reputation
- Family classification engine
- Intelligent Sandbox Machine Learning Prediction
- Other static engine

For more information about MITRE ATT&CK™ Matrix, see https://attack.mitre.org/wiki/ATT&CK_Matrix.
The User API Logs are contained in various files.
- The .log file contains the Windows user-level DLL API calls made directly by the analyzed file during dynamic analysis. To view this file in the Intelligent Sandbox web interface, select Analysis → Analysis Reports. Then click
 and select User API Log. Alternatively, click [IMAGE PLACEHOLDER: menu icon], select Complete Results. Download the <sample_name>.zip file. This .zip file contains the same information in the <sample name>.log file in the AnalysisLog folder. The content of the .log file includes the following:
- A record of all systems DLL API calling sequence.
- An address which indicates the approximate calling address where the DLL API call was made.
- Optional input and output parameters, and return code for key systems DLL API calls.
6 | Analyzing malware
-
The following are the other files containing the dynamic execution logs. All these files are contained in the <sample name>.zip file.
-
<sample name>ntv.txt file. This file contains the Windows Zw version of native system services API calling sequence during the dynamic analysis. The API name typically starts with Zw as in ZwCreateFile.
-
log.zip
-
dump.zip
-
dropfiles.zip
-
networkdrive.zip
-
View script and text detection report
The Script and Text Content report display the scripts and ASCII text content during the sample analysis.
Intelligent Sandbox currently supports the following scripts:
ps1
cmd, bat, lnk
htm, html, php, url, xml, hta
vbs, vbe
js
asp, jsp
wsc, wsf
vba and xlm macros
Task
-
Log on to the Intelligent Sandbox web interface.
-
Click Analysis → Analysis Reports. The Analysis Reports page lists the status of the completed files.
-
Right-click the report
 and select Script and Text Content. The Script Log page displays.
When you submit a sample file for dynamic analysis, a memory dump captures all the information content of a system. This memory dump is then converted into strings and any suspicious URLs found in the dump are validated against the GTI URL reputation. Intelligent Sandbox allows you to search for suspicious strings, APIs, and URLs by analyzing memory dump logs.
Task
-
Log on the Intelligent Sandbox web interface.
-
Select Analysis → Manual Upload → Browse, then locate and open the file you want to submit for analysis. Memory dump logs are generated only for the executable files such as .exe, .dll, etc.
-
Select the analyzer profile from the Analyzer Profile dropdown list.
-
Select the priority from the Submission Priority dropdown list.
-
Click Submit. The sample is uploaded to Intelligent Sandbox and is analyzed.
-
Navigate to Analysis → Analysis Reports. The Analysis Reports page lists the status of the file.
6 | Analyzing malware
-
Right-click the report
 and select Memory Dump Logs. The logs that are saved in the memory dump are displayed in the Memory Dump page.
Download the Complete Results .zip file
Intelligent Sandbox produces detailed analysis for each submitted sample. All the available reports for an analyzed sample are available in a .zip file, which you can download from the Intelligent Sandbox web interface.
Task
-
Log on to the Intelligent Sandbox web interface.
-
Click Analysis → Analysis Reports.
-
Click [IMAGE PLACEHOLDER: complete results icon] and select Complete Results.
Download the <sample_name>.zip file to the location you want. This .zip file contains the reports for each analysis. The files in this .zip file are created and stored with a standard naming convention. Consider that the sample submitted is vtest32.exe. Then the .zip file contains the following results:
-
vtest32_summary.html (.json, .txt, .xml) — This is the same as the Analysis Summary report. There are four file formats for the same summary report in the .zip file. The html and txt files are mainly for end users to review the analysis report. The .json and .xml files provide well-known malware behavior tags for high-level programming script to extract key information.
-
If the malware severity is 3 and above, then it contains .ioc, and .stix.xml formats of the Analysis Summary report for the sample.
-
vtest32.log — This file captures the Windows user-level DLL API calling activities during dynamic analysis. You must thoroughly examine this file to understand the complete API calling sequence as well as the input and output parameters. This is the same as the User API Log report.
-
vtest32ntv.txt — This file captures the Windows native services API calling activities during dynamic analysis.
-
vtest32.txt — This file shows the PE header information of the submitted sample.
-
vtest32_detail.asm — This is the same as the Disassembly Results report. This file contains reverse-engineering disassembly listing of the sample after it has been unpacked or decrypted.
-
vtest32_logicpath.gml — This file is the graphical representation of cross-reference of function calls discovered during dynamic analysis. This is the same as the Logic Path Graph report.
-
log.zip — This file contains all the run-time log files for all processes affected by the sample during the dynamic analysis. If the sample generates any console output text, the output text message is captured in the ConsoleOutput.log file zipped up in the log.zip file. Use any regular unzip utility to see the content of all files inside this log.zip file.
-
dump.zip — This file contains the memory dump (dump.bin) of binary code of the sample during dynamic analysis. This file is password protected. The password is virus.
-
dropfiles.zip — This is the same as the Dropped Files report in the Analysis Reports page. The dropfiles.zip file contains all files created or touched by the sample during the dynamic analysis. It is also password protected. The password is virus.
-
extract_static.log : This file contains the following:
-
Filetypes of all dropped files extracted during sample execution.
-
Characteristics of Portable Execution (PE) sample (in order):
-
Trellix Intelligent Sandbox 5.0.x Product Guide
81
6 | Analyzing malware
- Packer/Compiler Signature Detection
- Overlay Detection, shows offset if present
- Compilation Timestamp
- TLS Callback Information
- Raw vs. Virtual Size Comparison
- Sectional Characteristics (name, entropy, section headers)
- extract_url.log: This file contains all the URLs extracted from memory dump log.
- extractallstring_dump.log: This file contains all the strings from memory dump of the processes.
Download originally submitted files. All submitted samples are available in a .zip file.
Task
- Log on to the Intelligent Sandbox web interface as an Administrator.
- Click Manage → ATD Configuration → ATD Users.
- Select the user profile, then click Edit.
- Select Sample Download Access, then click Save.
- Click Analysis → Analysis Reports.
- Click the Reports icon, select Original Sample.
- Save the zipped <SAMPLENAME>_<MD5SUMOFSAMPLE>.zip file on your local system, then extract the contents and use infected as the password.
Submit false positive and negative samples
If you find false positive and negative samples in Intelligent Sandbox, submit the samples for further analysis.
When you receive false positive samples, submit it for analysis.
Task
-
Download the sample.
- Click Manage → TIS Configuration → TIS Users.
- Select the user, then click Edit.
- Select Sample Download Access, then click Save.
- Click Analysis → Analysis Reports.
- Click the Reports icon, then select Original Sample.
- Save the .zip file on your computer.
- Log on to the Intelligent Sandbox web interface.
- Click Analysis → Analysis Reports.
- Click the Reports, then select Analysis Summary.
- Locate Engine Analysis, then determine where to submit the sample:
- GTI File Reputation — Submit the file as a Service Requests or to the URL reputation team.
6 | Analyzing malware
-
- To submit a file sample, go to https://supportm.trellix.com, select Service Requests, then submit the false positive file sample.
- To submit an URL sample, go to http://www.trustedsource.org, then submit the false positive URL.
- Gateway Anti-Malware — Submit the sample to the Gateway Anti-Malware team.
- Submit by email — Send an email to virus_research_gateway@avertlabs.com, attach the false positive sample, then enter Possible False as the subject.
- Submit by service request — Go to https://supportm.trellix.com, select Service Requests, then submit the false positive sample.
- Anti-Malware — Go to https://supportm.trellix.com, select Service Requests, then submit the false positive sample.
- Sandbox — Go to https://supportm.trellix.com, select Service Requests, then submit the false positive sample.
Submit false negative samples
When you receive false negative samples, submit it for analysis.
Task
-
Download the sample.
- Click Manage → ATD Configuration → ATD Users.
- Select the user, then click Edit.
- Select Sample Download Access, then click Save.
- Click Analysis → Analysis Reports.
- Click the Reports icon, then select Original Sample.
- Save the .zip file on your computer.
-
Go to http://support.mcafee.com, select Service Requests, then submit the false negative sample.
Make sure that you include the Analysis ID.
Troubleshoot low sandbox file scores
Use Intelligent Sandbox elements to troubleshoot unexpectedly low sandbox file scores.
Task
Complete the following, then submit a sample after each task to check if the sandbox file score remains low.
- Verify that you are using the latest Intelligent Sandbox version. If you are using an older version, upgrade the Intelligent Sandbox software.
- Edit the Analyzer Profile, then select Enable Malware Internet Access.
- Verify that you are using the correct operating system.
- For example, you must use a 32-bit operating system to submit a 32-bit sample, and a 64-bit operating system to submit a 64-bit sample.
- Verify that Microsoft Office, Adobe Flash, Adobe Reader, and Java are installed on the virtual machine.
- For example, when you submit a Microsoft Office document, you must have Microsoft Office installed.
- Select Analysis → Manual Upload → User Interactive Mode, configure the remaining options, then click Submit.
- Submit the sample to McAfee.
Trellix Intelligent Sandbox 5.0.x Product Guide83
6 | Analyzing malware
Monitor Intelligent Sandbox with the Dashboard
To analyze the malware on your network, use the Intelligent Sandbox Dashboard monitors.
Task
-
Log on to the Intelligent Sandbox web interface.
-
Select Dashboard.
-
Specify the time period for the information to be displayed in the monitors.
For example, you can select to view the information for the past one hour. By default, data for the past 14 days is shown.
This field does not affect the System Health and System Information monitors.
-
Configure the display settings for each monitor.
-
To collapse a monitor, click

-
To hide a monitor, click

-
To change the display format of a monitor, click

-
Malware analysis monitors
The following are the monitors related to malware analysis.
File Counters
This monitor shows the analysis status for files submitted during the specified time period. For example, if you set the time period for the data in the dashboard as last 5 minutes, this monitor shows the count of files in completed, analyzing, and waiting statuses since the last 5 minutes. If you view this monitor in the stacked bar chart format, it also displays the severity level for the files.
- The severity levels are indicated using various colors.
- To hide the files for a particular severity, click the corresponding severity in the legend. For example, if you want to focus on only the malicious files, click Not Malicious and Not Rated in the legend. Now the chart shows only the high-severity malware that is in the waiting, running, and completed statuses. Click again on Not Malicious and Not Rated to view the combined chart.
- Move the mouse over a particular block in the chart to view the number of files that make up that block.
Top 10 File Types by Volume
Note
This monitor has drill - down capabilities. Once you click the mouse over a particular block, Intelligent Sandbox takes you to Analysis Results page, displaying the records sorted as per the chosen block.
This monitor shows the count of top 10 file types based on their volume. In the tabular format, it shows the percentage for each type. In the chart, it also shows the count of malicious, not malicious and not rated files.
- The malicious, not malicious and not rated file counts are indicated using different colors.
- To hide the malicious or not malicious files, click the corresponding severity level in the legend.
84 Trellix Intelligent Sandbox 5.0.x Product Guide
6 | Analyzing malware
-
Move the mouse over a particular block in the chart to view the number of files that make up that block.
Note
This monitor has drill - down capabilities. Once you click the mouse over a particular block, Intelligent Sandbox takes you to Analysis Results page, displaying the records sorted as per the chosen block.
Profile Usage
This monitor shows the number of times each analyzer profile has been used for analyzing files.
Top 5 Recent Malware by File Name
In this monitor, you can view the names of five malicious files detected in your network with the most severe ones listed on top. This information might enable further research such as finding more information about these files on the web.
-
The listed malware files are sorted based on their severity level in the descending order.
-
The first column displays the file names. The second column displays the severity level.
Top 10 Malware by Threat Name
In this monitor, you can view the names of ten most severe malware files in your network by threat name.
Note
This monitor has drill - down capabilities. Once you click the mouse over a particular block, Intelligent Sandbox takes you to Analysis Results page, displaying the records sorted as per the chosen block.
Files Analyzed by Engine
In this monitor, you can view the severity and number of files analyzed by GAM, GTI and Sandbox.
Note
This monitor has drill - down capabilities. Once you click the mouse over a particular block, Intelligent Sandbox takes you to Analysis Results page, displaying the records sorted as per the chosen block.
Top 5 URLs Analyzed by GTI
In this monitor, you can view the names of five most severe URLs being analyzed by GTI. This information might enable further research such as finding more information about these files on the web.
-
The listed malware files are sorted based on their severity level in the descending order.
-
The first column displays the file names. The second column displays the severity level.
Top 5 URLs
In this monitor, you can view the names of five malicious files detected in your network with the most severe ones listed on top. This information might enable further research such as finding more information about these files on the web.
6 | Analyzing malware
- The listed malware files are sorted based on their severity level in the descending order.
- The first column displays the file names. The second column displays the severity level.
VM Creation Status monitor
This monitor displays the color based on the status of VM creation. Below is the color code followed:
In Progress - Yellow
Failed - Red
Success - Green
Intelligent Sandbox performance monitors
The following are the monitors related to Intelligent Sandbox Appliance performance.
Point Products
The Point Products monitor displays the connection status between Intelligent Sandbox and supported point products.
- To view the Point Products monitor, you must manually enable it on the Dashboard.
- The Intelligent Sandbox REST API enables user-centric communication. When you configure the user type for communication with Intelligent Sandbox, it must match the correct point product. For example, Email Gateway uses the MEG user type to communicate with Intelligent Sandbox.
- In a cluster environment, the Point Products monitor displays the status of the primary node. The primary node dashboard shows the last connected time for each sample the node receives from these point products:
- Network Security Platform
- Email Gateway
- Web Gateway
- TIE
- Secondary node dashboards display the status for each sample they receive from the primary node.
- Each node dashboard displays the corresponding connectivity and status of the node with these point products:
- Syslog
- ePO Status
- DXL Channel
- Active Response
- TE Publisher Channel
System Health
The System Health monitor displays the health of the Intelligent Sandbox Appliance components.
System Information
The System Information monitor displays the Intelligent Sandbox software component versions.
7 | Clustering Intelligent Sandbox Appliances
Clustering Intelligent Sandbox Appliances
When you have a very heavy load of files to be analyzed for malicious content, you can cluster two or more Intelligent Sandbox Appliances. So, the analysis load is efficiently balanced between the Intelligent Sandbox Appliances (nodes) in the cluster.
Consider multiple inline Sensors submitting hundreds of files per second to one Intelligent Sandbox Appliance. In the blocking mode, a Sensor waits for up to 6 seconds for Intelligent Sandbox to analyze a file. After this time period, the Sensor forwards the file to the target endpoint. Faster response from Intelligent Sandbox could be accomplished by clustering Intelligent Sandbox Appliances for load-balancing.
Installing Intelligent Sandbox in a cluster environment
To make sure that Intelligent Sandbox is always available, you can install Intelligent Sandbox in a cluster environment.
When you set up a cluster environment with two or more Intelligent Sandbox Appliances, you can configure them to share data.
Each Intelligent Sandbox cluster contains these nodes:
- Primary — Virtually associated to the cluster IP address for configuration and file submission. Integrated products and users access the primary node to submit files for analysis and retrieve analysis results and reports. The Primary node is also the template and control center for the cluster. It is responsible for load-balancing the files among all nodes and providing high availability.
- Backup — Receives and analyzes samples. If the primary node fails, the backup node assumes the primary node responsibilities and cluster IP address. When the backup node is present in the cluster, the integrated products are configured with the cluster IP address.
- Secondary — Receives and analyzes samples.
Certificates in a cluster environment
In a cluster environment of Intelligent Sandbox, the certificate of active node is synchronized to all backup and secondary nodes. Choose one of the following methods for a reliable infrastructure.
- Use a wildcard certificate and install it on all nodes.
Note
Ensure that the certificate and the CA are trusted by the browser.
- Use a certificate with a valid CN where the SAN field contains the IP addresses or FQDNs of all nodes in the cluster. Install the certificate on all nodes.
This method has a drawback. If you add the host name or FQDN in the SAN field (instead of an IP address), the browser performs a certificate chain validation. If the validation fails, XMODE or the Activation of VM ceases to work.
Workaround: Bypass the browser's certificate validation. To bypass certificate validation:
Trellix Intelligent Sandbox 5.0.x Product Guide
87
7 | Clustering Intelligent Sandbox Appliances
Browser | Workaround |
|---|---|
Chrome | Start Chrome using |
Firefox | Add Site Exceptions for each node. |
Prerequisites and considerations
-
You must use the eth-0 interfaces (management ports) of the Intelligent Sandbox Appliances for cluster communication.
Note
The eth-0 interfaces of all nodes must be in the same layer-2 network of the OSI reference model for better performance and to avoid network latency.
-
The nodes must be homogenous regarding the following:
Intelligent Sandbox software version. The software versions of all nodes must exactly match.
Analyzer VMs. All nodes must have the same analyzer VMs.
Note
Upon adding a node to a cluster or upon modifying a VM profile of Primary node, VM configurations in the Primary node are pushed to the VMs in secondary nodes, synchronizing all the VMs in the cluster.
It is recommended that DAT and engine versions of McAfee Anti-Malware Engine are the same in all nodes.
It is recommended that DAT and engine versions of McAfee Gateway Anti-Malware Engine are the same in all nodes.
-
The nodes can be heterogenous regarding the following:
Hardware. That is, you can create a cluster using a combination of ATD-3100 and ATD-6100 Appliances.
FIPS compliance. Regardless of primary or secondary, some nodes can be in FIPS mode and the rest in non-FIPS mode.
-
Note
In Common Criteria (CC) mode, Load-balancing is not supported.
-
Use the IP address of the Primary node to submit files and to integrate with other products such as Network Security Platform, McAfee Email Gateway, and Web Gateway. If Backup node is present in cluster, these integrated products
7 | Clustering Intelligent Sandbox Appliances
need to be configured with cluster IP address. The Primary node or the primary Intelligent Sandbox Appliance acts as the external interface for the cluster. That is, the Primary node is associated to the IP address of the cluster from the standpoint of configuration and file submission. If you integrate Network Security Platform, Web Gateway and Email Gateway with the secondary nodes, these nodes function like standalone Intelligent Sandbox Appliances.
Note
Integrating an Intelligent Sandbox cluster with Email Gateway is supported with release 3.4.2.
- If the Primary node is down, the Backup node takes over. Backup node must be in same L2 network as Primary node.
- User can view the Analysis Status and Analysis Results of all nodes in cluster from Active node, that is Primary node or Backup node.
- You can wipe out all cluster-related configurations from a node and make it as a standalone box.
clearlbconfigcommand is used to destroy cluster using CLI. It is permitted to run at all nodes (Primary/ Backup/Secondary). This command can be used in scenarios where normal means of removing a node (Remove Node/ Withdraw From Cluster) does not remove that node from cluster. - To delete VMs from the secondary node, make sure that you delete it through VM Synchronization. That is, do not delete the image from the Policy page of Secondary. To delete the image, delete it from the Primary, then during VM Synchronization, the image is deleted from Secondary automatically.
- From the Intelligent Sandbox user interface, you can only validate, activate, and delete inactive node VMs.
- Make sure the node to be added to the cluster are not in "BAD" state or in "VM creation failed" condition.
- If the VM synchronization fails, an automatic re-attempt of the synchronization does not take place.
- For VM Sync failure on secondary/backup node the node’s status on primary shows VM Sync failed. In this case user has to go to each Individual node and check system log for further steps. Take corrective measures for failure scenarios, then click the Sync All VMs button, if VM synchronization starts automatically no further action is required.
- Sample distribution to a particular node does not take place in case the node has either of the following status messages:
- VM Sync In Progress
- VM Sync Failed
- If secondary node’s system.log says VMSync cannot be initiated as VM Creation has failed on this node, then execute the CLI command
reboot vmcreator. - VM sync fails if Primary and Secondary nodes have images with the same name.
- When adding a node to a cluster with the same hardware, VM Synchronization begins and the status of the node changes in the following order:
Option | Definition |
|---|---|
| VM Mismatch | VMs between Primary and new node do not match. |
7 | Clustering Intelligent Sandbox Appliances
|
Option |
Definition |
|---|---|
|
VM Sync in progress |
VM Synchronization in progress. |
|
Up and ready |
All VMs and VM profiles are copied to the new node. |
Hybrid cluster
-
In a cluster, ATD-3000, ATD-3100, ATD-3200, ATD-6000, ATD-6100 and ATD-6200 are all treated as different appliances. For example, a cluster with only ATD-3000 and ATD-3100 is considered a hybrid cluster. Similarly, a cluster with ATD-6000 and ATD-6100 is considered a hybrid cluster.
-
When a new node with a different hardware is added to a cluster, a warning message is displayed indicating the difference is hardware type with the Primary.
-
Before you add a secondary node to a hybrid cluster, make sure that you delete all images, VM profiles, and Analyzer profiles from the secondary.
Due to the difference in hardware, during VM Synchronization, the licenses are not applied.
-
Once the new node is successfully added to the cluster, VM Synchronization begins and the status of the node changes in the following order:
7 | Clustering Intelligent Sandbox Appliances
-
Once the node is added to the cluster, and its status changes to SCP of all images completed, manually activate the VMs and create the licenses for the VMs.
-
Once the status in all nodes is Up and ready, create the Analyzer profiles in the Primary node.
-
If the status doesn't change from SCP of all images completed, then review the following:
-
Verify that the licenses in the new node are activated. If not, manually activate the license in the new node.
-
Verify that the VM profiles in the new node match the VM profiles on Primary.
For example, the new node might be missing the default VM profile. In that case, you need to manually create the VM profile.
In a hybrid cluster, the Policy tab in your Intelligent Sandbox web UI is kept enabled which allows you to manually create or edit the VM profiles.
-
-
If the new node has more VM profiles than the Primary, the VM profiles in the new node are automatically deleted during VM Synchronization.
-
In a hybrid clustering environment, the Microsoft Office and analyzer VM operating system licenses have not been retained because of hardware changes.
Recommended concurrent SMTP sessions for Email Connector
Review the number of concurrent sessions supported by Intelligent Sandbox and configure your email connector accordingly.
Appliance type | Standalone | Cluster |
|---|---|---|
Virtual Intelligent Sandbox appliance | 50 | 300 |
Intelligent Sandbox appliance | 200 | 500 |
Note
The Standalone and Cluster number shows up by submitting 1 mail per session.
The recommended number of VM licenses to be created are:
Appliance model | For Windows 10 or later OS | For other OS |
|---|---|---|
Virtual Intelligent Sandbox | 6 | 7 |
ATD-3000/ATD-3100/ATD-3200 | 18 | 25 |
ATD-6000/ATD-6100/ATD-6200 | 55 | 55 |
Trellix Intelligent Sandbox 5.0.x Product Guide91
7 | Clustering Intelligent Sandbox Appliances
Note
The number of licenses supported by Windows 10 OS are less compared to other windows OS because of higher resource consumption.
Cluster VM auto synchronization
The primary node pushes all VM settings to the secondary nodes, which enable auto synchronization within VM clusters.
Adding nodes in a hybrid cluster scenario
In a cluster, ATD-3000, ATD-3100, ATD-6000, and ATD-6100 are all treated as different appliances. For example, a cluster with only ATD-3000 and ATD-3100 is considered a hybrid cluster. Similarly, a cluster with ATD-6000 and ATD-6100 is considered a hybrid cluster.
Scenario | Outcome |
|
Add an ATD-3000 or ATD-3100 or ATD-3200 to a cluster with ATD-6000 or ATD-6100 or ATD-6200 as primary node, with more than 30 VMs |
Intelligent Sandbox notifies you to decrease the licenses in ATD-6000 or ATD-6100 or ATD-6200 primary node before you can add the secondary node. |
|
Add an ATD-6000 or ATD-6100 node with more than 30 VMs to a cluster with an ATD-3000 or ATD-3100 primary node |
Intelligent Sandbox successfully adds the node to the cluster, and secondary node VMs are deleted. |
Primary node upgrade in a hybrid cluster scenario
Scenario | Outcome |
|
Upgrade ATD-6000 or ATD-6100 primary node with more than 30 VMs and one ATD-3000 or ATD-3100 secondary node. |
Intelligent Sandbox notifies you to decrease the VM licenses in ATD-6000 or ATD-6100 to 30 or less. When you fail to decrease the number of licenses, synchronization causes the VM creation process to fail in ATD-3000 or ATD-3100 nodes. |
|
Upgrade ATD-3000 or ATD-3100 or ATD-3200 primary node and ATD-6000 or ATD-6100 or ATD-6200 secondary node with more than 30 VMs |
Intelligent Sandbox successfully completes upgrade. When the synchronization process completes, you must delete the additional secondary ATD-6000 or ATD-6100 or ATD-6200 nodes. |
7 | Clustering Intelligent Sandbox Appliances
|
Configuration |
Definition |
|---|---|
|
Synchronized |
Intelligent Sandbox automatically synchronizes these settings between all nodes:
On the secondary and backup nodes, Intelligent Sandbox disables the web interface settings. |
|
Unsynchronized |
If you want to change the following settings, you must change them on each individual node:
|
7 | Clustering Intelligent Sandbox Appliances
Intelligent Sandbox cluster network connections
Eth-0 interface of the primary acts as the management interface of the cluster whereas the eth-0 of the secondary and backup node are used to exchange information with the primary.
The Backup node acts as a secondary node till the time the Primary node goes down for some reason and the Backup node takes the role of the primary node. The primary node load balances the files received on the eth-0 interface among the secondary nodes based on the number of files submitted to a node. A highly burdened node receives lesser number of samples for processing as opposed to a less burdened node. The primary node transfers files to be analyzed by the secondary node through the eth-0 interface and uses the same to retrieve results. When cluster configuration changes are made using the primary node, they are synchronized across the secondary nodes and the backup node through the eth-0 interface.
An example Intelligent Sandbox cluster deployment
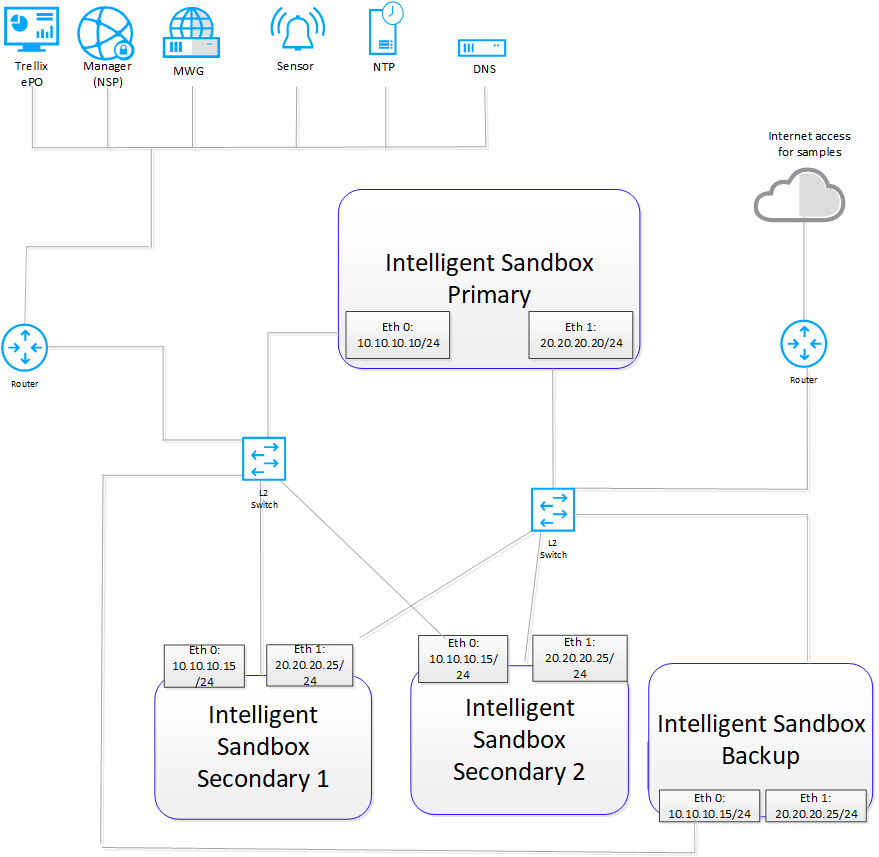
In this example, eth-1 is used to provide network access to malware running on the analyzer VMs. This isolates the network traffic generated by malware from the production network to which eth-0 interfaces are connected.
A local database is maintained at the Primary node which lists the MD5 hash value along with corresponding node-id of the samples blacklisted by Intelligent Sandbox cluster node. Node-id is the primary identifier of a node that processes a particular sample. Whenever a sample is submitted to Intelligent Sandbox, the Primary node looks for an existing entry of this sample in its newly created database. If the MD5 hash value of a sample matches with an existing one in the database, this previously blacklisted sample is sent to the node based on the corresponding node-id of the sample. This approach ensures that every previously submitted, blacklisted sample reaches the node that analyzed it earlier, hence avoiding re-analysis of the blacklisted samples by any other node in the cluster.
Intelligent Sandbox determines the wait time for a submitted sample before it gets picked for analysis. The wait time is calculated based on the current sample analysis rate of the nodes. For samples submitted through MEG, a default threshold wait
7 | Clustering Intelligent Sandbox Appliances
time of 780 seconds is allotted. Intelligent Sandbox rejects all the incoming samples from MEG until the wait time drops below this threshold value.
Using Intelligent Sandbox clusters
When you configure clusters, you use the primary node to manage the configuration for the cluster, and Intelligent Sandbox uses the secondary nodes as backup.
Certain configurations can only be done using the primary node. When you save these configurations, the primary node sends a snapshot of its current configuration as a file to all secondary nodes. The secondaries save these settings in their database. This synchronization process does not affect the file analysis capabilities of an Intelligent Sandbox Appliance.
The primary node has the latest version of the configuration file. If the version of the configuration file does not match between the primary and a secondary node, the primary node pushes the configuration file automatically to that secondary. The primary node overrides the synchronized configurations on the secondary nodes.
When treated as part of a cluster, the secondary nodes are transparent to users and integrated products.
- It is possible for you to use a secondary Intelligent Sandbox directly for file submission and report retrieval. But, you are not allowed to modify any of the synchronized configurations.
- Both files and URLs submitted for analysis are distributed to achieve load-balancing.
-
Factor in the following when you decide on the primary node.
- Use the primary node's IP address to submit files and to manage the configuration.
- Products such as Network Security Platform, Web Gateway and Email Gateway must be integrated with the primary node's IP address. Since the result and report retrieval is through the primary, connection between the integrated products and the secondary nodes is not mandatory. With 3.4.2 release, Cluster IP is point of contact for these integrated products, if user chooses to configure a Backup node.
-
Make sure that the integrated products are configured to use the primary node. This includes the integrated Trellix products and third-party applications or scripts that use the Intelligent Sandbox REST APIs. With 3.4.2 release Cluster IP address is point of contact for these integrated products, if user chooses to configure a backup node.
7 | Clustering Intelligent Sandbox Appliances
Intelligent Sandbox Appliance clusters
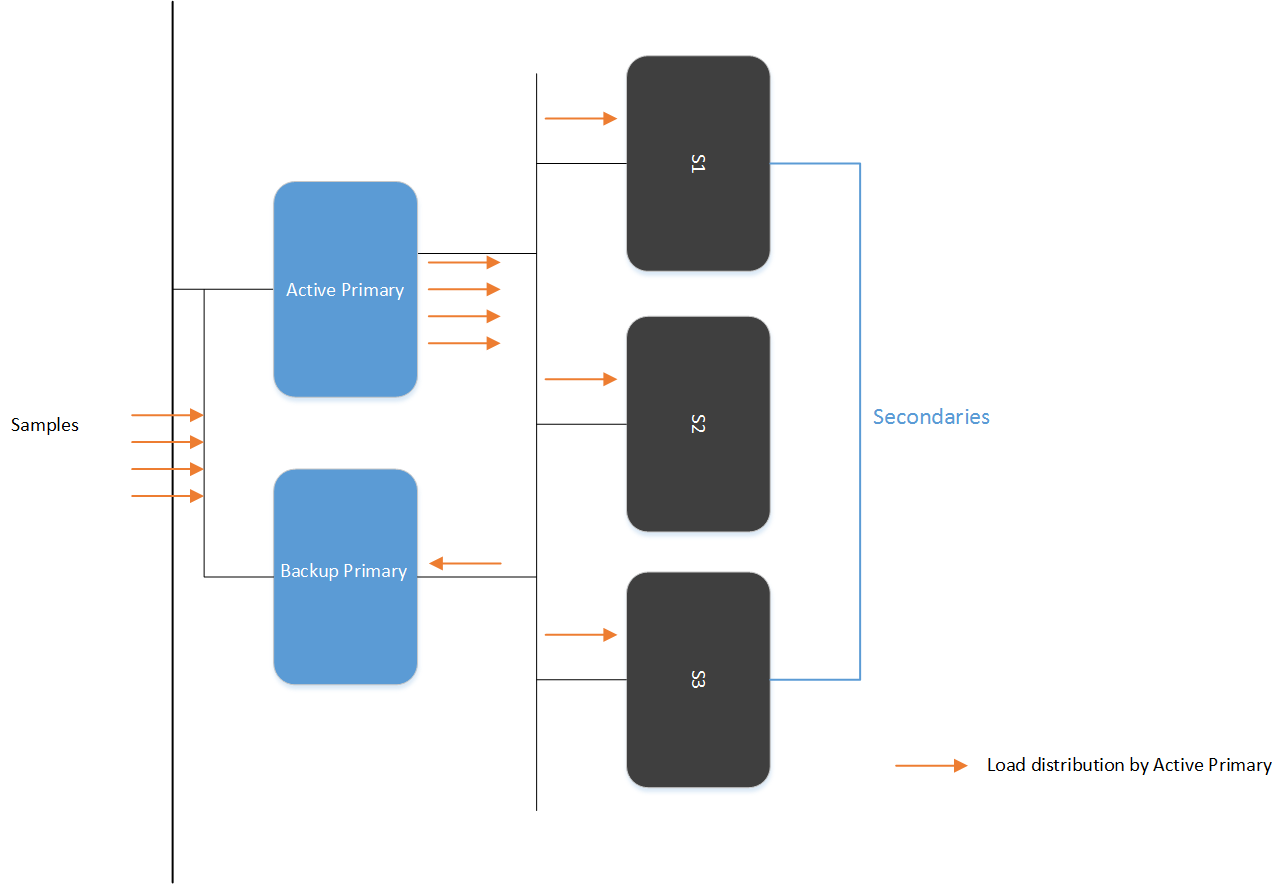
How are the individual files in a .zip file analyzed by an Intelligent Sandbox cluster?
When you submit a file or URL, Intelligent Sandbox assigns it a unique job ID and a task ID. These IDs are incremental integers. When you submit a .zip file, the component files are extracted and analyzed separately. The job ID for all component files of a .zip file is the same as that of the .zip file's job ID. But, the task ID varies for each component file.
When you submit a .zip file to an Intelligent Sandbox cluster, the primary node identifies the node to which it distributes the next file and sends the entire .zip file to that node. The node that received the .zip file extracts the component files and analyses them. This applies to .zip files within a .zip file as well.
- If a Sensor submits the .zip file, Intelligent Sandbox generates a cumulative report for the entire .zip file. That is, one report for one .zip file is sent to the Manager when it queries for the report. In Web Gateway, .zip files are supported for Web Gateway 7.6.0 and later.
- If you submit a .zip file to the primary node, using its web interface for example, individual reports are generated for the component files in the .zip file.
Then the primary node extracts the component files in the zip and distributes them all to the same node for analysis. The primary polls the corresponding secondary for analysis status and results using unique task ID.
How to upgrade the Intelligent Sandbox software for the nodes in a cluster?
Following is the recommended procedure to upgrade the Intelligent Sandbox software for the nodes in a cluster:
- In a typical load-balancing scenario, first upgrade software of Backup node. The node remains a part of the cluster, but due to version mismatch incoming samples are not submitted to this node. The samples are distributed only between Primary and secondary nodes. The status column of Backup node in the Load-balancing page displays the following message:
Node is on different software version
Then the primary node extracts the component files in the zip and distributes them all to the same node for analysis. The primary polls the corresponding secondary for analysis status and results using unique task ID.
96 Trellix Intelligent Sandbox 5.0.x Product Guide
7 | Clustering Intelligent Sandbox Appliances
-
Upgrade secondary nodes. After you upgrade more than 50 percent of the secondary nodes, upgrade Primary node.
-
Since Primary node remains down during upgrade, Backup node takes over the Active role and distributes the incoming samples between Backup node (Active) and the upgraded secondary nodes. Even after the upgrade of Primary node, Backup node continues to assume the Active role.
-
Upgrade the remaining secondary nodes.
Important
Do not select Reset Database when you upgrade any of the nodes. If this option is selected for the primary node, the cluster goes down after upgrade. If the Reset Database option is selected for a secondary node, it breaks away from the cluster after upgrade.
Important
Administrator needs to click Sync All Nodes tab when the nodes upgraded to 3.4.8 or later have different Max Wait-Time Threshold values configured. This synchronizes the Max Wait-Time Threshold value among all nodes. The Max Wait-Time Threshold value assigned for Primary node is configured to all nodes in the cluster.
Important
Using Troubleshooting page, when you delete the previously analyzed reports from all nodes present in the Intelligent Sandbox cluster, it is recommended to do so in a sequential manner. The reports present in all secondary nodes need to be deleted first and the reports present in Primary or Active node at the last.
Syslog events for Load Balancing
Syslog events are generated for state transition happening for Primary/Backup nodes. These events are generated in 5-minutes interval, once the state is changed.
Below is a sample output for syslog event generated when state of Primary/Backup node changes from Active to Health Bad and the opposite way:
Dec 13 02:20:01 MATDMIC1U-014 ATD2ESM[771]: {"LB Alert": {"ATD IP": "10.213.***.**", "Timestamp": "2014-12-13 10:17:39", "Old State": "ACTIVE", "New State": "HEALTH BAD"}}
Dec 13 10:00:02 MATDMIC1U-014 ATD2ESM[23873]: {"LB Alert": {"ATD IP": "10.213.***.***", "Timestamp": "2014-12-13 17:55:37", "Old State": "HEALTH BAD", "New State": "ACTIVE"}}
Similarly, syslog events are generated for the following scenarios:
- When Primary/Backup node has Load-Balancing services status Down / Up
- When Load-Balancing node state changes from Active to Down and the opposite way
- When there is a configuration mismatch on Backup node from Primary node
- When there is an SW version mismatch on Backup node from Primary node
Trellix Intelligent Sandbox 5.0.x Product Guide
97
How to remove Intelligent Sandbox clusters
Review the scenarios to remove Intelligent Sandbox clusters.
- Primary node is active - When the primary node is active, administrator logs on to Load Balancing page of Intelligent Sandbox. The administrator then remove all other nodes such as Backup or Secondary nodes, one by one. Once all nodes are removed except the primary node, the administrator can remove the primary node.
Note
Removal of primary node is not permitted unless other nodes are removed.
- Backup node is active (Active Primary) - In this case, the administrator first logs on to the Backup node, from the Load Balancing page of Intelligent Sandbox, then removes all node from the cluster in the following order:
- Secondary nodes
- Backup node
If the administrator logs on to the configured primary node, the nodes cannot be removed directly from the Load Balancing page. This is because the configured primary node is not serving as Active Primary node and since a cluster cannot be created without a primary node configured. After removing Backup node from cluster if primary node is active, primary node takes the active role, since the Backup node is not active. Now, to remove a cluster, primary node is removed followed by removal of Backup node.
Note
If the configured primary node is not serving as Active-Primary and Backup node is in active state, the removal of the configured primary node requires removing of the cluster.
Methods for removing nodes from the cluster:
- Remove Node from Active-Primary - This option facilitates removal of secondary or backup node from Active Primary. If the target node is up at the time of removal, the node changes itself to standalone state and Active Primary removes the entry of the node from the cluster. If the target node is down at the time of removal, the entry of the target node is removed from the cluster by Active Primary. Once that node comes up, the administrator needs to log on to the removed node and do a manual cluster withdraw in Load Balancing page of Intelligent Sandbox, using Withdraw from Cluster button. The role of removed node is then changed to standalone.
- Withdraw from Cluster at Secondary or Backup Node - This option is active for all secondary or backup nodes to withdraw that particular node from Load Balancing.
7 | Clustering Intelligent Sandbox Appliances
Note
After withdrawal, the entry of the removed node is not deleted from the primary node. The administrator needs to log on to the primary node and remove that node manually. This node comes to Down: Heartbeat not received state in primary only after Heart Beat (HB) times out and remains as is until removed, as it has been withdrawn from the secondary.
- CLI command: clearlbconfig - This command is used to remove a cluster using CLI command prompt. It is permitted to run at all nodes (Primary, Backup, or Secondary). It wipes out all cluster-related configurations from that node and makes it a standalone box. This command can be used in scenarios where a typical method of removing a node (Remove Node or Withdraw From Cluster) does not remove that node from cluster. When you execute the clearlbconfig command on Active or Primary nodes, you must also execute the command on all other nodes in the cluster.
Methods for configuring node to serve as a backup node:
- If Backup is not serving as Active Primary - The administrator deletes the previously configured Backup node and adds a new one.
- If Backup is serving as Active Primary - The administrator removes the cluster and reconfigures Intelligent Sandbox nodes with the new roles.
Process flow for Network Security Platform
Consider a scenario where a Sensor is between the endpoints on your network and the Web. The Sensor is integrated with a Intelligent Sandbox cluster consisting of 3 Intelligent Sandbox Appliances.
Network Security Platform integrated with an Intelligent Sandbox cluster
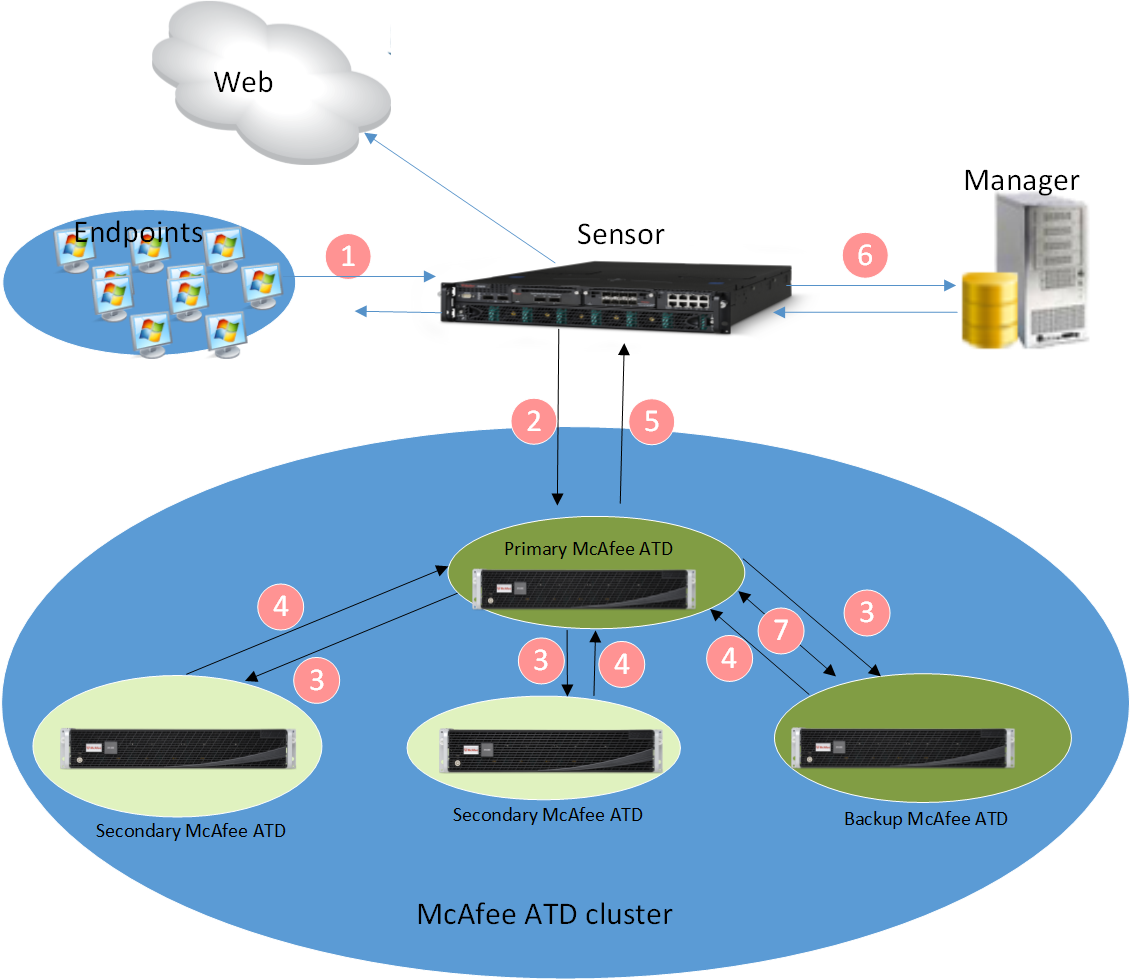
Trellix Intelligent Sandbox 5.0.x Product Guide 99
7 | Clustering Intelligent Sandbox Appliances
| Number | Description |
|---|---|
| 1 |
The endpoints attempt to download files from the Web. The inline monitoring ports detect this activity. |
| 2 |
For a given file, the Sensor withholds the last packet from being forwarded to the endpoint and simultaneously streams the file packets to the primary Intelligent Sandbox for analysis. For this purpose, the Sensor and the primary Intelligent Sandbox use their management ports. |
| 3 |
After the entire file is with the primary Intelligent Sandbox, it distributes this file to one of the appliances in the cluster. For all communication, the members in the cluster use their management ports. |
| 4 |
The corresponding secondary Intelligent Sandbox responds with a job ID to the primary and begins to analyze the file based on the user profile. If the file is detected by static analysis, the secondary Intelligent Sandbox sends the malware result (severity) to the primary Intelligent Sandbox. |
| 5 |
|
| 6 |
The Sensor forwards the job ID to the Manager. The Manager queries the primary Intelligent Sandbox Appliance management port for the analysis reports. The primary Intelligent Sandbox pulls the reports from the corresponding Intelligent Sandbox. |
7 | Clustering Intelligent Sandbox Appliances
|
Number |
Description |
|---|---|
|
Appliance based on the job ID. Then it forwards the reports to the Manager for display. Also, if the file is found to be malicious based on dynamic analysis, the alert in the Real-time Threat Analyzer is updated accordingly. | |
|
7 |
Backup Intelligent Sandbox assumes Primary Intelligent Sandbox role if Primary Intelligent Sandbox goes down for some reason. |
Process flow for McAfee Web Gateway
Consider a scenario where Web Gateway is between the endpoints on your network and the Web. The Web Gateway appliance is integrated with a Intelligent Sandbox cluster consisting of three Intelligent Sandbox Appliances.
Web Gateway integrated with an Intelligent Sandbox cluster
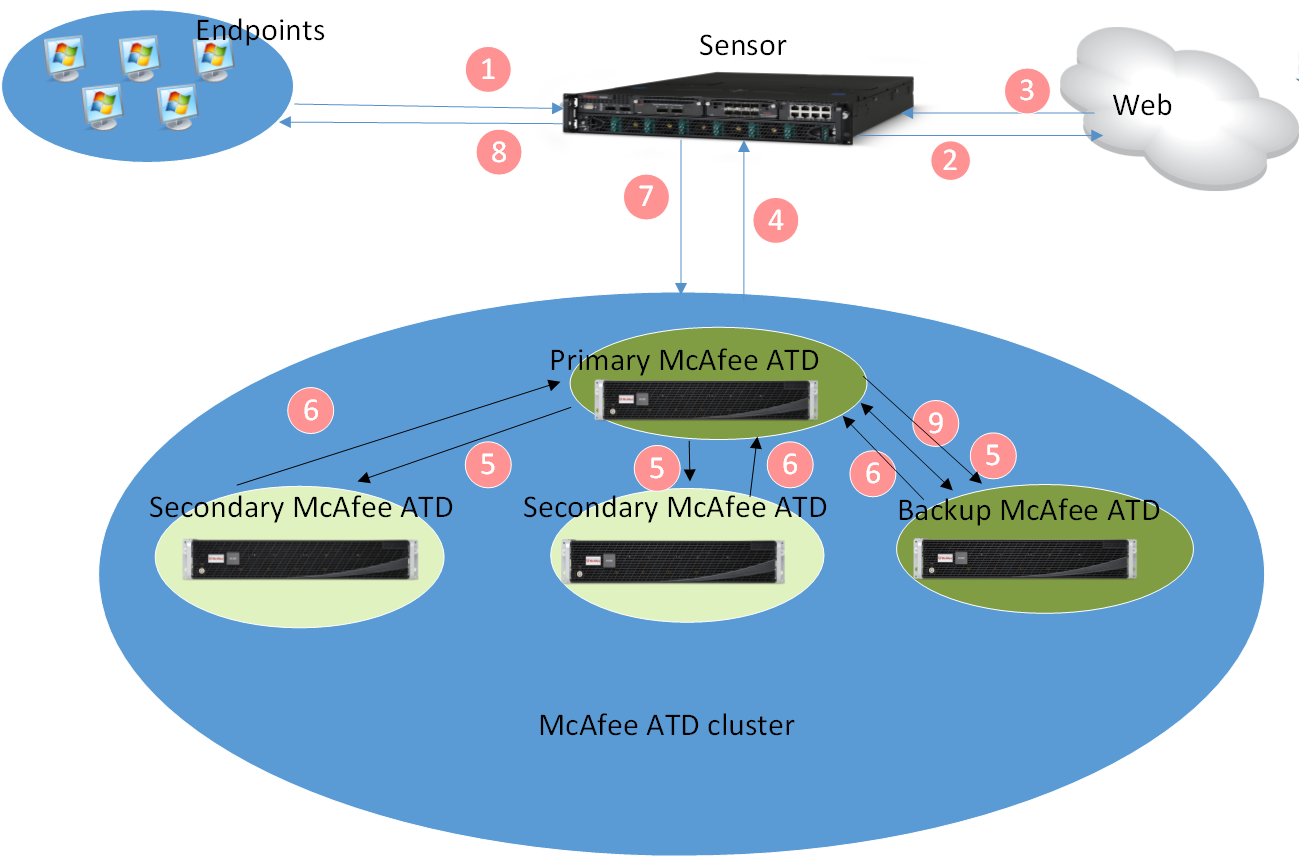
|
Number |
Description |
|---|---|
|
1 |
The endpoints attempt to download web objects. |
|
2 |
Web Gateway forwards these requests. |
Trellix Intelligent Sandbox 5.0.x Product Guide
101
7 | Clustering Intelligent Sandbox Appliances
|
Number |
Description |
|---|---|
| 3 |
When a file is downloaded, the native McAfee Gateway Anti-malware Engine on Web Gateway scans the file and determines the malware score. |
| 4 |
Based on the file type and the malware score, Web Gateway determines if the file needs to be sent to Intelligent Sandbox for analysis and, if needed, forwards the file to the primary Intelligent Sandbox's management port. |
| 5 |
The primary Intelligent Sandbox distributes such files among the nodes based on the number of files submitted to a node. A highly burdened node receives lesser number of samples for processing as opposed to a less burdened node. All communication between the members in a cluster is over their management ports. Assume that the file is sent to one of the secondary Intelligent Sandbox for analysis. The secondary Intelligent Sandbox returns the job ID and task ID to the primary node and begins to analyze the file. The primary node, in turn, returns the job ID and task ID to Web Gateway. |
| 6 |
For the analysis reports, Web Gateway queries the primary node with the task ID. Using the task ID, the primary node identifies the Intelligent Sandbox that analyzed the file and pulls the reports from it. |
| 7 |
In response to the query from Web Gateway, the primary Intelligent Sandbox forwards the reports. |
| 8 |
Based on the report from Intelligent Sandbox, Web Gateway allows or blocks the file accordingly. |
| 9 |
Backup Intelligent Sandbox assumes Primary Intelligent Sandbox role if Primary Intelligent Sandbox goes down for some reason. |
7 | Clustering Intelligent Sandbox Appliances
Note
When Web Gateway queries for an MD5 hash value with time period (without the job or task ID), the primary node checks the MD5 hash in its database. If there is no matching record, the primary node checks the secondary nodes where the file is analyzed and sends the report back to Web Gateway without analyzing the corresponding file again.
When Web Gateway queries for an MD5 hash value for a running task (without the job or task ID), the primary node checks the MD5 hash with status (pending or analyzing) in its database. If there is no matching record, the primary node checks the secondary nodes where the file is being analyzed or is in the queue. Then the primary node sends the task details back to Web Gateway without analyzing the corresponding file again.
High-level steps to configure clusters
Follow these high-level steps to configure an Intelligent Sandbox cluster.
-
Identify the Intelligent Sandbox Appliances that you want to use to create the cluster. You can add additional secondary nodes to a working Intelligent Sandbox cluster.
-
Make sure that the Intelligent Sandbox Appliances meet the requirements.
-
Identify an unassigned IP address, which is in the same L2 network as are Primary node and Backup node. This IP address is assigned to the cluster as "Cluster IP" address.
-
Out of the Intelligent Sandbox Appliances, identify the one that you plan to use as the primary node. All other Intelligent Sandbox Appliances are secondary nodes. Once you define the cluster, you cannot change the primary node without redefining the cluster itself. Similarly, once Backup node is added it cannot be changed unless it is removed from Cluster.
-
Factor in the following when you decide on the primary node.
-
Use the primary node's IP address to submit files and to manage the configuration.
-
Products such as Network Security Platform, Web Gateway and Email Gateway must be integrated with the primary node's IP address. Since the result and report retrieval is through the primary, connection between the integrated products and the secondary nodes is not mandatory. With 3.4.2 release, Cluster IP is point of contact for these integrated products, if user chooses to configure a Backup node.
-
The synchronized configurations of the secondary are overwritten with that of the primary node. Post cluster creation, you use the primary node to manage these configurations.
-
-
Make sure the secondary nodes and the primary node are able to communicate with each other using their management ports.
-
As a best practice, back up the configuration of all nodes, especially the secondary nodes, before you configure the cluster.
-
Make sure that the integrated products are configured to use the primary node. This includes the integrated Trellix products as well as any third-party application or script that use the Intelligent Sandbox REST APIs. With 3.4.2 release Cluster IP is point of contact for these integrated products, if user chooses to configure a backup node.
-
Create the Intelligent Sandbox cluster.
-
Submit files and URLs to the Intelligent Sandbox cluster.
-
View the analysis results for an Intelligent Sandbox cluster.
-
Manage configurations for the cluster.
Trellix Intelligent Sandbox 5.0.x Product Guide
103
7 | Clustering Intelligent Sandbox Appliances
Create the cluster
Create clusters of one or more Intelligent Sandbox Appliances.
Before you begin
Make sure that you have changed the password for your cliadmin credentials. The cluster will not function if you continue to create it with your default password.
Task
-
Identify the Intelligent Sandbox Appliance that you want to use as the primary node, then log on to the Intelligent Sandbox web interface.
-
Click Manage → Load Balancing.
-
Configure the primary node.
In the Node IP address field, enter the managing node IP address.
From the drop-down list, select Primary.
Click Add Node.
On the confirmation window, click Yes.
-
For each secondary node, complete the following.
In each cluster, you can configure up to 16 nodes.
Back up the configuration settings.
In the Node IP address field, enter the secondary node management port IP address.
From the drop-down list, select Secondary.
Click Add Node.
On the confirmation window, click Yes.
-
In the Cluster IP address field, enter the unassigned IP address, which is in the same L2 network as the primary and backup nodes, then click Save.
Note
When you click Yes on the confirmation message box, the primary node saves its configuration in a file and sends this to the secondary node. This file contains those configurations, which this document refers to as synchronized configuration. The secondary uses this configuration file to overwrite the corresponding configuration in its database. So, make sure that you have taken a backup of the secondary's configuration before you proceed. When you remove the secondary from the cluster, it retains the primary node's configuration.
Note
Configuring or changing the Cluster IP address, resets all SFTP services.
Note
To add cluster IP address, make sure that you configure the ATD MGMT port with a static IP address.
7 | Clustering Intelligent Sandbox Appliances
- Configure the backup node.
- In the Node IP address field, enter the backup node management port IP address.
- From the drop-down list, select Backup.
- Click Add Node.
- On the confirmation window, click Yes.
If you want to change the backup node, you must remove it from the cluster.
- Sort the columns and hide or display the required columns.
Note
Except for ATD ID, IP Address, Role, and Withdraw From Cluster, none of the options are available in the Load Balancing Cluster Setting page for the secondary nodes.

Results
You are unable to change the primary node without reconfiguring the cluster.
Clustering Virtual Intelligent Sandbox Appliance
You can cluster your Virtual Intelligent Sandbox Appliance (nodes) so that the analysis load is efficiently balanced.
Cluster Requirement
To create clusters of one or more Virtual Intelligent Sandbox Appliance, make sure your environment meets the requirements.
- Use the Virtual Intelligent Sandbox Appliance eth-0 interfaces, or management ports.
- For optimal performance, all the node eth-0 interfaces must be in the same layer-2 network of the OSI reference model.
Note
- When you set up a Virtual Intelligent Sandbox cluster, the Primary and Backup nodes must reside on same ESXi server. The Secondary nodes can be on same or a different ESXi server.
- Intelligent Sandbox Appliance requires the default gateway to be configured in the same subnet as the management port.
All nodes must have the same:
- Virtual Intelligent Sandbox software version
- Analyzer VMs
- Trellix Anti-Malware Engine DAT and engine versions
- Trellix Gateway Anti-Malware Engine DAT and engine versions
Create the Virtual Intelligent Sandbox cluster
Create clusters of one or more Virtual Intelligent Sandbox appliances.
Trellix Intelligent Sandbox 5.0.x Product Guide105
7 | Clustering Intelligent Sandbox Appliances
Before you begin
- You have admin-user rights for the primary node's web application.
- The primary and secondary nodes are not part of any other cluster.
- On Azure, ensure that you give the private IP address of your primary and secondary node VMs.
- The software version (active version) of all nodes that you plan to use are an exact match.
Task
-
Identify a Virtual Intelligent Sandbox Appliance as the primary node and log on to its web application.
Use a user name that has admin rights.
-
Select Manage → Load Balancing.
The Load Balancing Cluster Setting page displays.
-
In the Node IP address field, enter the management port IP address of the primary node, select Primary from the drop - down and click Add Node.
⚠️ Caution
If you are creating a cluster on Azure, ensure that you give the private IP address of the VM that you want to designate as the primary node.
-
Confirm if you want to create the cluster.
Virtual Intelligent Sandbox sets itself as the primary node for the cluster.
-
In the Node IP address field, enter the management port IP address of a secondary node, select Secondary, then click Add Node.
⚠️ Caution
If you are creating a cluster on Azure, ensure that you give the private IP address of the VM that you want to designate as the secondary node.
-
Click Yes to add the secondary node.
📝 Note
When you click Yes in the confirmation message box, the primary node saves its configuration in a file and sends this to the secondary node. This file contains those configurations, which this document refers to as synchronized configuration. See How does the Intelligent Sandbox cluster work? in the Trellix Intelligent Sandbox Installation Guide for information about synchronized configuration. The secondary uses this configuration file to overwrite the corresponding configuration in its database. So, make sure that you have taken a backup of the secondary's configuration before you continue. When you remove the secondary from the cluster, it retains the primary node's configuration.
7. Following a similar procedure, add the other secondary nodes.
7 | Clustering Intelligent Sandbox Appliances
-
In the Cluster IP address field, enter cluster IP address and click Save. Select Backup from the drop - down and enter the management port IP address of the Backup node in the Node IP address field. Click Add Node.
Note
Configuring or changing Cluster IP address resets all SFTP services.
-
The details of all nodes in the cluster are displayed in a table. Similar to other tables in the Virtual Intelligent Sandbox web application user-interfaces, you can sort , hide or display the required columns.
Note
Except for ATD ID, IP Address, Role, and Withdraw From Cluster, none of the options are available in the Load Balancing Cluster Setting page for the secondary nodes.
Option definitions
|
Option |
Definition |
|---|---|
|
Node IP address |
Enter the management port IP address of the Virtual Intelligent Sandbox Appliance that you want to add to the cluster. |
|
Drop - Down |
Select Primary / Backup / Secondary according to the requirement. |
|
Add Node |
Click to add the primary, secondary, and backup node to the cluster. |
|
Cluster IP address |
Enter the cluster IP address to be used by Active node (Primary node or Backup node). |
|
Save |
Click to save the cluster IP address before adding Backup node. |
|
|
Indicates the status of a node. |
Trellix Intelligent Sandbox 5.0.x Product Guide
7 | Clustering Intelligent Sandbox Appliances
|
Option |
Definition |
|---|---|
The primary node distributes files only to those nodes, which are in the green status. If the status of a secondary node turns red midway of a file transfer, the primary node allocates the file to the next node in queue. If all the secondary nodes are in overloaded state, samples get distributed among the nodes in round robin fashion, even when the nodes are in amber status. | |
|
ATD ID |
This is a system-generated integer value to identify the nodes in a cluster. The primary node generates this unique value and assigns it to the nodes in the cluster. This ID is displayed in the Analysis Status and Analysis Results left-hand-side tree structure on the primary node. This enables you to identify the node that analyzed a specific sample. The uniqueness of the ATD ID is based on the IP address of a node as stored in the primary node's database. Consider that you have 3 nodes in the cluster. You remove the secondary node with ATD ID 2 from the cluster and add it back again to the cluster. Then this secondary node is assigned the same ATD ID of 2 if all these conditions are met:
|


|
Option |
Definition |
|---|---|
| |
|
IP Address |
The management port IP address of the node. |
|
Model |
The Virtual Intelligent Sandbox appliance model type. It could be either 1008, 1016, 3032, or 6064. |
|
Role |
Indicates if a node is a primary or a secondary or a backup node. It also indicates which node is behaving as Active node. |
|
Config Version |
When you save any of the synchronized configurations, the primary node sends its configuration file to the secondary nodes and also versions this configuration file for reference. For each node, the version number of its latest configuration file is displayed. If the version number of a secondary node does not match with that of the primary, it indicates a possible difference in how the secondary node is configured. So, the status color for that secondary node turns to amber. The reason is also mentioned in the State column. Also, the primary node automatically pushes its configuration file to that node. This ensures that all nodes are configured similarly about synchronized configuration. |
|
S/W Version |
Indicates the Virtual Intelligent Sandbox software version of the nodes. The complete software version must exactly match for all nodes. If not, the status turns to amber for the corresponding nodes. |
|
State |
Indicates the status of node and any critical information related to that node. Some possible states are: |
| Option | Definition |
|---|---|
| |
| Remove Node |
Select a node and click to remove the node from the cluster. The configuration from the primary node is retained even when you remove a secondary node from the cluster. You cannot remove a primary node or a Backup node, if it is in active state, before you remove all secondary nodes. This option is not available for a secondary node. |
| Sync All Nodes |
Click Sync All to trigger the configuration-synchronization for all secondary nodes in the cluster.
Details of the configuration sync are displayed for each node based on the success or failure of the synchronization. |
7 | Clustering Intelligent Sandbox Appliances
Option | Definition |
|---|---|
|
Sync All VMs |
Manually triggers the synchronization of primary node and secondary node VMs in a cluster. This function is applicable only when you have a synchronization error between primary node and secondary node VMs.
|
|
Withdraw from Cluster |
This button is relevant only for secondary nodes. Click to withdraw a secondary node from the cluster and to use the secondary node as a standalone Virtual Intelligent Sandbox Appliance. Recall that if the primary and Backup nodes are down simultaneously, the load‑balancing cluster is down. In the previously mentioned case, click Withdraw from Cluster in the secondary nodes to withdraw from the cluster and to use the secondary nodes as standalone appliances. |

Deploying Virtual Intelligent Sandbox in Load balancing mode using Azure Load balancer
Once you load balance your Virtual Intelligent Sandbox using the private IP address of the Primary, Backup and, Secondary nodes with the cluster, you can pick an available cluster IP address from your subnet.
Task
- Log on to the Azure Portal (https://portal.azure.com).
- Click New. In the Search, the marketplace field, type 'load balancer'. Locate Load Balancer from the returned list.
- Click Load Balancer, then click Create then do the following:
- In Name, type a name for the Load Balancer.
- Under Type, select Public.
- Select Public IP address, then create a new public IP address.
This is the IP address through which you would communicate with the Intelligent Sandbox cluster.
- Select the appropriate subscription.
- In Resource Group, select Use existing. Type the resource group where you deployed your Intelligent Sandbox VMs.
Trellix Intelligent Sandbox 5.0.x Product Guide
111
7 | Clustering Intelligent Sandbox Appliances
-
- In Location, select the location where you deployed your Intelligent Sandbox VMs.
- Click Create.
- Once the load balancer is deployed, select the load balancer that you have created.
- On the right pane, select Backend pools, then do the following:
- Click Add.
- In Name, type a name for the backend pool.
- In Associated to, select Availability set.
- In Availability set, the availability set that you created for your VMs.
- Click Add a target network IP configuration.
- Under Target virtual machine, select your VM.
- Under Network IP configuration, select the network IP address configuration for the VM that you selected in the previous set.
Do this for all VMs that you would want in the load balancing mode.
- Click OK.
- Select the load balancer, then click Health probes, then do the following:
- Click Add.
- In Name, type a name for the health probe.
- Under Protocol, select TCP.
- In Port, type 7986.
Leave the default values for Interval and Unhealthy threshold.
- Click OK.
- Select the load balancer, then click Load balancing rules, then create three rules using the following values:
| Rule | Values |
|---|---|
| Rule 1 |
Name: 443rule IP Version: IPv4 Frontend IP address: Choose your Frontend IP address. Protocol: TCP Port: 443 Backend port: 443 Backend pool: Choose the Backend pool that you created. Health probe: Choose the Health probe that you created. Session persistence: Client IP and protocol. Idle timeout (minutes): 15 Floating IP address (direct server return): Disabled |
7 | Clustering Intelligent Sandbox Appliances
| Rule | Values |
|---|---|
|
Rule 2 |
Name: 80rule IP Version: IPv4 Frontend IP address: Choose your Frontend IP address. Protocol: TCP Port: 80 Backend port: 80 Backend pool: Choose the Backend pool that you created. Health probe: Choose the Health probe that you created. Session persistence: None Idle timeout (minutes): 4 Floating IP address (direct server return): |
|
Rule 3 |
Name: 2222rule IP Version: IPv4 Frontend IP address: Choose your Frontend IP address. Protocol: TCP Port: 2222 Backend port: 2222 Backend pool: Choose the Backend pool that you created. Health probe: Choose the Health probe that you created. Session persistence: None Idle timeout (minutes): 4 Floating IP address (direct server return): |
Results
Your load balancer is ready. Now you can use the public IP address of the load balancer to submit samples.
Monitor the cluster status
You can monitor the status of an Intelligent Sandbox cluster in the Load Balancing Cluster Setting page or by using the lbstats command. After configuring cluster IP address, we can login using cluster IP address to access Intelligent Sandbox interface.
Trellix Intelligent Sandbox 5.0.x Product Guide113
7 | Clustering Intelligent Sandbox Appliances
Task
-
Log on to the CLI of the primary or a secondary node.
-
Run
lbstatscommand.
Separate sections are displayed for each node.
Ibstats output from the primary node
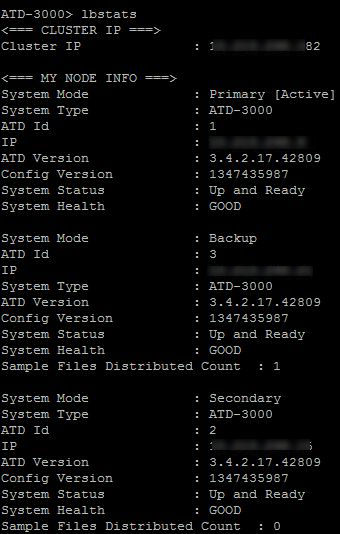
Above is the lbstats output from a primary node.
Ibstats output from a secondary node
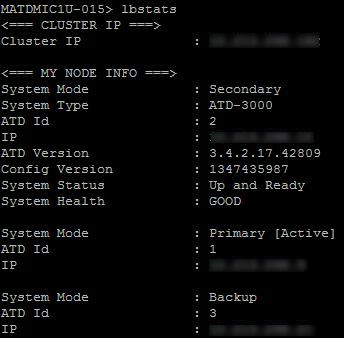
Above is the lbstats output from a secondary node.
114
Trellix Intelligent Sandbox 5.0.x Product Guide
7 | Clustering Intelligent Sandbox Appliances
Ibstats output from a backup node
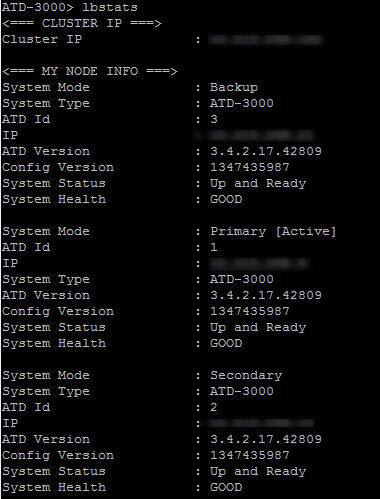 , Secondary), ATD Id values, IP addresses (redacted), System Type (ATD-3000), ATD Version, Config Version, System Status (Up and Ready), and System Health (GOOD).]
Above is the Ibstats output from a backup node.
Details of the Ibstats command
|
Output entry |
Description |
|---|---|
|
System Mode |
Indicates whether the Intelligent Sandbox Appliance is the primary or a secondary node. |
|
ATD ID |
The unique ID assigned to the node. |
|
IP |
The management port IP address of the Intelligent Sandbox Appliance. |
|
System Type |
The appliance model type. ATD-3000/3100/3200 or ATD-6000/6100/6200 or vATD. |
|
ATD Version |
Intelligent Sandbox software version currently installed on the node. |
|
Config Version |
The version of the configuration file currently on the node. |
|
System Status |
Whether the node is up and running. |
Trellix Intelligent Sandbox 5.0.x Product Guide 115
7 | Clustering Intelligent Sandbox Appliances
| Output entry | Description |
|---|---|
| System Health | Whether the node is in good or an uninitialized state. |
| Sample Files Distributed Count | The total number of samples distributed among the nodes, including the primary node. This count includes both files and URLs. This data is displayed only when you run ibstats on the active node (Primary node or Backup node). |
Submit files to the cluster
You use the primary node to submit samples to an Intelligent Sandbox cluster. The process is similar to how you use an individual Intelligent Sandbox Appliance.
Task
- Make sure the integrated products interface with the primary node. When you configure the integration, make sure you use the passwords as configured in the primary node. For example, for Web Gateway, use the mwg user name and its password as configured in the primary node. If Backup node is configured then cluster IP address should be the point of contact to for these integrated products.
- To submit files and URLs manually, log on to the primary node with admin rights and submit the files just like how you submit the files to a standalone Intelligent Sandbox Appliance.
-
Upload files for analysis using the Intelligent Sandbox web interface.
You can also use the REST APIs of the primary node to submit files and URLs. See the Intelligent Sandbox APIs Reference Guide for information.
You can also submit files using FTP or SFTP to the primary node.
Note
If cluster IP address is configured, we need to login / submit files using cluster ip.
Monitor the cluster status analysis
The Analysis Status page of the primary node displays the analysis status for files analyzed by each node. In a secondary node, only those files analyzed by that secondary node are displayed.
Task
- Using the primary node, log on to the Intelligent Sandbox web interface.
- Click Analysis → Analysis Status.
The Analysis Status expands to display the secondary nodes of the cluster. Analysis Status corresponds to the primary node. The secondary nodes are listed under Analysis status with their ATD ID and their management port IP address.
7 | Clustering Intelligent Sandbox Appliances
-
To view the status of the files analyzed by the primary node, click Analysis Status.
-
To view the status of files analyzed by a specific secondary node, click the corresponding ATD ID.
Monitor the cluster analysis results
The Analysis Reports page of the primary node displays the analysis results for files analyzed by each node. In a secondary node, only those files analyzed by that secondary node are displayed.
Task
-
As an administrator, use one of the cluster nodes to log on to the Intelligent Sandbox web interface.
-
Click Analysis → Analysis Reports.
The Analysis Reports expands to display the secondary nodes of the cluster. Analysis Reports corresponds to the primary node. The secondary nodes are listed under Analysis Reports with their ATD ID and their management port IP address.
-
To view the results of files analyzed by a specific secondary node, click the corresponding ATD ID.
Modifying cluster configurations
Regarding an Intelligent Sandbox cluster, configurations can be classified into two types:
- Settings that you configure only from the primary node. For the sake of explanation, these settings are referred as synchronized configuration in this document.
- Settings that you configure individually in each node of a Intelligent Sandbox cluster. These settings are referred as unsynchronized configuration.
Synchronized configuration — The following are the settings that fall under this category:
- Analyser profiles
- User management
- McAfee ePO integration details
- HTTP proxy settings
- DNS settings
- NTP server settings
Log on to the primary node with admin rights to configure these settings listed above. When you click Save in the corresponding pages, the primary node bundles the entire synchronized configuration in a file and sends it to all available secondary nodes. The secondary nodes save these settings in their database and use these settings later. This configuration file is assigned a version number. This version number is the Config Version listed in the Load Balancing Cluster Setting page.
The primary node sends the configuration file over a secure communication channel to the secondary nodes. You can verify the State column in the Load Balancing Cluster Setting page to verify if the configuration file was successfully applied on a secondary node. Alternatively, you can click Sync All Nodes in the Load Balancing Cluster Setting page for the primary node to send the configuration file to all available nodes. If a secondary node is down, it is indicated in the State column.
Trellix Intelligent Sandbox 5.0.x Product Guide
117
7 | Clustering Intelligent Sandbox Appliances
Note
When the primary node synchronizes configuration for the cluster, it sends the complete synchronized data to all available nodes in the cluster. That is, you cannot selectively synchronize secondary nodes. Neither can you select the configurations that you want sent to the secondary nodes. However, the configuration-synchronization process does not affect the load-balancing or file-analysis processes of a Intelligent Sandbox Appliance.
Unsynchronized configuration — The following are the settings that fall under this category:
- Analyzer VMs
- VM profiles
- DAT and engine versions of McAfee Anti-Malware Engine.
- DAT and engine versions of McAfee Gateway Anti-Malware Engine.
- Whitelist and blacklist entries.
- Custom YARA rules
- Database backup and restore configurations.
- Any configuration done using the CLI.
Log on to each node in the cluster to change these configurations. Make sure that these configurations are same in all nodes of the cluster.
Change the cluster configuration settings
Change the synchronized and unsynchronized settings in the Intelligent Sandbox cluster.
Task
-
Change the synchronized cluster settings.
- As an administrator, log on to the primary node.
- On each page, make changes to the synchronized settings, then click Save.
You can also select Manage → Load Balancing, then click Sync All Nodes.
-
To change the unsynchronized settings, log on to each node and change the settings.
Make sure that all changes are the same on each node in the cluster.
COPYRIGHT
Copyright © 2024 Musarubra US LLC.
Trellix and FireEye are the trademarks or registered trademarks of Musarubra US LLC, FireEye Security Holdings US LLC and their affiliates in the US and /or other countries. McAfee is the trademark or registered trademark of McAfee LLC or its subsidiaries in the US and /or other countries. Skyhigh Security is the trademark of Skyhigh Security LLC and its affiliates in the US and other countries. Other names and brands are the property of these companies or may be claimed as the property of others.