Last Updated: March 26, 2026
Preface
This guide provides an overview of the TrellixPacket Capture appliance and describes how to use the search capabilities. This guide is intended for security personnel responsible for operating a Packet Capture appliance. The Packet Capture appliance is designed for use by network operations and security personnel with an intermediate knowledge of Internet protocols.
Before you begin
Before using the Packet Capture appliance, read the Packet Capture Release Notes for the current release.
Overview
The PX series Network Forensics platform
Introduction
Getting started
The PX series Network Forensics platform
PX is an integrated solution for the ultrafast recording of and indexing of network traffic.
PX provides a powerful hardware-accelerated platform for capturing, searching, and analyzing packet and session information. The multithreaded software is tightly integrated with an intelligent capture adapter and high-performance SAS RAID or fiber channel HBA controller that offers sustained packet capture.
The Packet Capture software is built on a secured, locked-down Linux 3.2 distribution, CaptureOS. PX uses a Web UI and provides command-line interface (CLI) access for system administration and for file tasks that are not available from the Web UI.
Introduction
The Packet Capture User Guide describes the Packet Capture appliance and how to configure and use the system.
For information about configuring packet filters, see the Packet Capture System Administration Guide.
PCAP format
PX reads and writes packets in the industry-standard PCAP format.
By default, packets are saved in PCAP format using a nanosecond timestamp. PX sets the header of the PCAP file using the NSEC_TCPDUMP_MAGIC number, which is recognized and used by tools such as TCPDump and Wireshark.
Resources
To learn more about basic packet analysis and packet manipulation, consider these resources:
Practical Packet Analysis: Using Wireshark to Solve Real-World Network Problems by Chris Sanders
Conventions
Conventions used in this guide:
Code Examples
Code examples look like this.Notes
Note
Notes appear in boxes.
Dates
Dates should use UTC for start time (stime), end time (etime), and so on.
They can be represented like this:
yyyymmdd.hhmmss
second epoch
nanosecond epoch
now
0.hhmmss ("0" represents today)
Getting Started
This section describes how to use the Packet Capture application:
Browser support
Use a recent version of one of the following Web browsers to access the Web UI:
3 | Preface
Microsoft Edge
Google Chrome
Mozilla Firefox
Opera
Safari
Note
If you are using a Macintosh with certificates in your keychain, you cannot use the Safari browser. PX will try to use your keychain, but the certificates are not for the server.
Logging in to the web UI
To log in to the Web UI:
Important
For more information, see the PX Hardware Administration Guide.
Open a Web browser, and then enter https://appliance in the address line.
In place of appliance, enter the IP address or host name of the appliance. For example, if the configured IP address of the appliance is 10.1.0.1, enter https://10.1.0.1.
The IP address is configured at initial startup.
On the login page, enter the user name and password provided by your administrator.
Click Proceed to acknowledge the EULA and continue to the login screen.
The web UI
The user name of the logged-in user is displayed at the upper-right corner of the Web UI. The bar at the bottom of each screen displays these time details:
Time Type | Description |
|---|---|
Connection | The time of the first connection recorded on the appliance. |
Index | The time of the oldest connection packet index recorded on the appliance. |
Packet | The time of the oldest packet stored on the appliance. |
Local | The current local time, derived from user's local machine. |
UTC | The current UTC time derived from user's local machine. |
PX UTC | The current PX UTC time. |
If no data is sent to the box, then the times show as UNAVAILABLE.
Note
The current local and UTC times shown in the Web UI are derived from the local Web client, not from the Packet Capture appliance.
Web UI Menu
The Web UI contains these menu items.
Menu | Description |
|---|---|
Search | Search: Search based on time (UTC), IP address, filters, limits and VLAN. You can also view list of old searches. |
Capture | A live dashboard that displays the bit rate at which network interfaces are capturing data. |
System | PX status, including streaming data and disk usage. |
RAID | RAID status for each controller and each physical disk in the array. |
Trends | Statistics collected on PX in the last hour, day, week, month, or year. |
User profile
After logging into the PX Web UI, your active user profile is displayed in the top corner.
From the User Profile Settings menu, you can perform these actions:
Set the local time zone
Set your inactive timeout setting
Choose a Web UI theme
Set your account password
Log out of the PX appliance
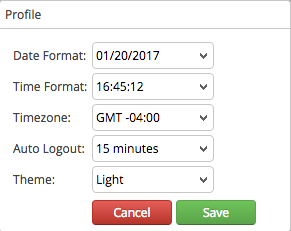
To configure the local time zone from the PX Web UI:
Note
The default timezone is EST (GMT -04:00)
Log in to the PX Web UI.
Click the User Profile button to access the settings menu.
Click Profile to access the time zone configuration fields.
In Date Format, make a selection.
In Time Format, make a selection.
In Timezone, set your local time zone.
Click Save to update your time and date settings and close the menu.
To configure the inactivity timeout setting in the PX Web UI:

Note
The default inactivity timeout setting is 15 minutes.
Click the User Profile button to access the settings menu.
Click Profile to access the Auto Logout field.
In Auto Logout, select your inactivity timeout settings.
Click Save to update your time and date settings and close the menu.
To configure the PX Web UI theme:
Click the User Profile button to access the settings menu.
Click Profile to access the Theme field.
In Theme, select Web UI theme settings.
Note
The default Web UI them is light.
Click Save to update time and date settings and close the menu.
Search and filter
These sections describe how to search and filter network data:
Search overview
When you search on the Packet Capture appliance, search criteria are compared against the Packet Capture appliance's flow index. These indexes contain references to packets that are found within flows.
Search processing on the PX
PX search results are processed in four stages: connection, indexing, packet, and session.
Each stage must be completed before the next stage begins. You can either analyze your session during your search, or you can do a connection search and analyze the session later.
Connection: A fast search of the connection (bidirectional flow) records produces a summary of the captured data matching the search criteria. Packet payload information is not available.
Indexing: Indexes search data.
Packet: Extracts payloads from the stored PCAP so original packets for the connection records are available.
Session: Reassembles extracted packets and payloads into sessions where analysis extracts artifacts. Session data is reconstructed using the packet results of a search. You can search using facets on user data, attachment data, and MIME types.
If packet payloads are not purged from PCAP storage, then additional processing can be performed later.
Viewing search data
You can perform the following tasks with the search data displayed on the History, Stored, and Triggered tabs on the page:
Cancel: Cancels the selected search in the queue.
Session Analysis: Runs session analysis on selected History search results.
Results: JSON results.
Download PCAP: PCAP of the selected the search results.
Store: Name and store search results.
Create a search
You can perform detailed searches based on numerous filters.
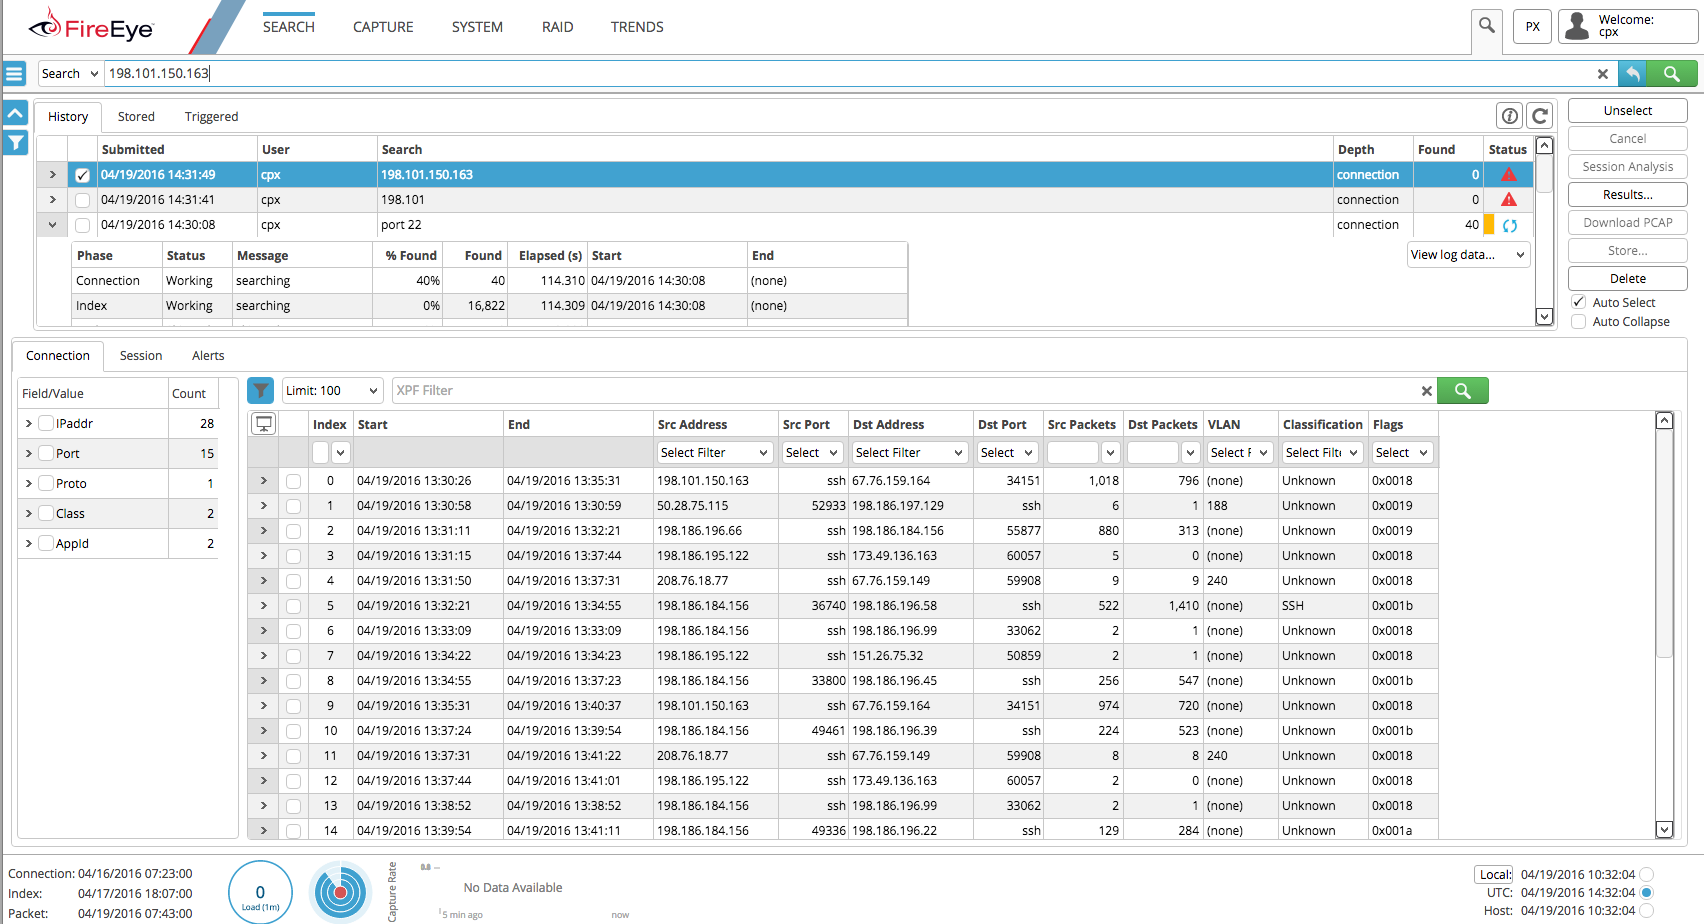
When you begin typing, the search bar populates with suggested search parameters. You can enter PX-specific XPF and BPF filter parameters, or you can click Builder to filter by common values, including:
Address
Application
Protocol
Port
Port Range
VLAN
MPLS
Connection metadata
Use the search bar to perform filtered packet searches.
IP Prefilter is a list of IP addresses that are used as a pre-filter on connections. IP Prefilter is specifically useful for sporadic traffic over a long period of time. XPF supports BPF along with PX-specific connection attributes defined in Connection Metadata Properties. See Connection metadata properties.
When performing searches that use the IP Prefilter or XPF fields, the PX first scans the connection index for packets present in the time period being searched. If no parameters are used, the PX returns all packets in the time frame listed.
Searches that use the IP Prefilter or XPF fields must start at or before the first packet in the connection. Connection records have a maximum time of five minutes. Network sessions longer than five minutes include multiple connection records. Search results are limited to 100 items.
Creating a search using the web UI
When performing a search, you can input the dates and times that you want to search, along with the number of connection records to search. You can search from 100 to 10,000 records.
Note
The behavior of the cancel button varies depending on the depth of the search. Certain searches in sessions mode cannot be canceled.
To create a search:
In the Web UI, go to the PX dashboard.
Use the search bar to search for a comma-delimited list of IP addresses.
To add filters, select the Builder link in the Search menu.
Setting the search start time
To create a search start time:
In the PX Web UI, go to the Search page.
Expand the blue side bar box.
Select the Start box.
In the time picker, select a start time.
Setting the search end time
To create a search end time:
In the PX Web UI, go to the Search page.
Expand the blue side bar box.
Select the End box.
In the time picker, select an end time.
Setting the search depth level
To perform a faster search that returns only connection and packet previews, you can filter using "connection."
If you need packets or analysis on those packets, then filter using "packet" or "session."
You can filter using "session," a slower search that returns and analyzes packet data.
To set the depth level for your search:
In the PX Web UI, go to the Search page.
Expand the blue side bar box.
Select the depth box.
Select the processing depth level: "connection," "packet," or "session."
Setting the search limit level
The limit level is used to select how many connections to return. Preloaded options: 25, 50, 75, 100, 150, 200, 500, 1000, 1,500, and 2,000 sessions. You can enter a custom number of connections to return.
To set the limit level for your search:
In the PX Web UI, go to the Search page.
Expand the blue side bar box.
Select the limit box.
Set the limit number.
Setting the search strict level
The strict level sets the variations for searching across VLANs and MPLS names.
If strict is set to Yes, then the search does not try variations on the provided XPF. If strict is set to No, the provided XPF is manipulated to check various VLAN and MPLS depths.
For example, if strict is Yes, an XPF of "port 80" would not match a packet in VLAN 123, even if the TCP port on that packet was 80. If strict is set to No, an attempt would be made, and the "port 80" PX would match a packet in VLAN 123.
To set the strict level for your search:
In the PX Web UI, go to the Search page.
Expand the blue side bar box.
Select the strict box.
Set the strict level to Yes or No.
Setting the search IP filter
To set the IP filter for your search:
In the PX Web UI, go to the Search page.
Expand the blue side bar box.
Select the IP Filter box.
Enter IP addresses, separated by commas.
Search history
The History tab displays information about previous searches, including:
Who searched
The date and time of the search
The overall progress and individual progress for the connection, indexing, packet, and session search stages
Results
Actions
To view details of a search, in the History tab, click any search. Details appear in the table below.
History
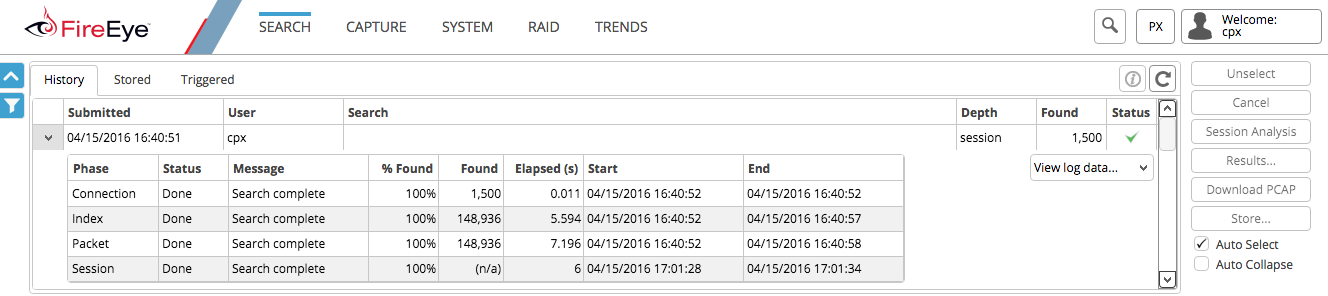
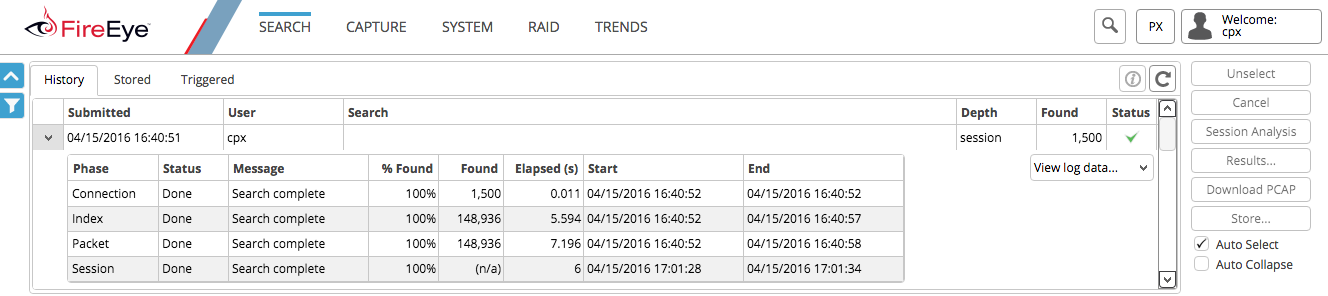
The History tab shows every search on the system. Columns in the History window display these details:
Submitted: The date and time the search was created.
User: Who created the search.
Search: The UUID given to the search.
Depth: The depth of the search.
Found: The number of items found in the search.
Status: The status of the search. A green check mark signals completion.
You can expand each search item to view this data:
Connection: The progress of the search and the number of records found.
Index: The progress of the index retrieval portion of the search.
Packet: The progress of the packet collection portion of the search.
Session: The progress of the session reconstruction portion of the search.
To view search history:
In the PX Web UI, on the Search page, select the History tab.
To view details, click the search.
Stored results
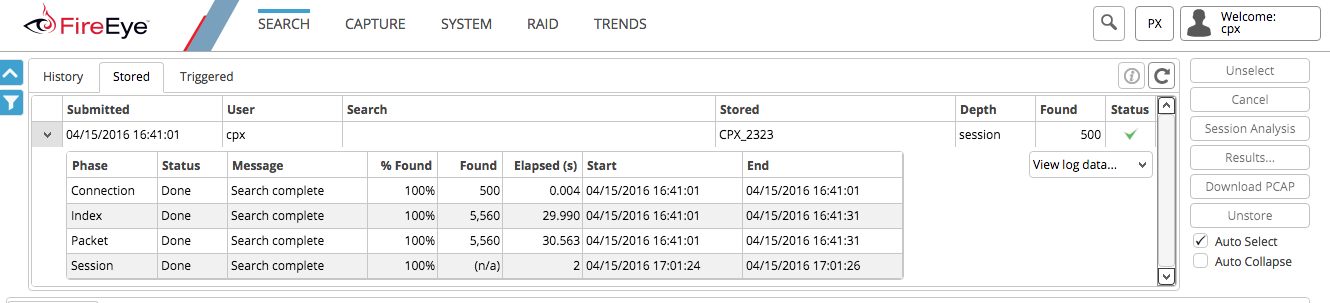
The Stored tab displays details about saved and labeled searches.
To view stored results:
In the PX Web UI, on the Search page, select the Stored tab.
To view details, click the search.
Triggered results
The Triggered tab displays details about saved and labeled searches that were triggered by an alert.
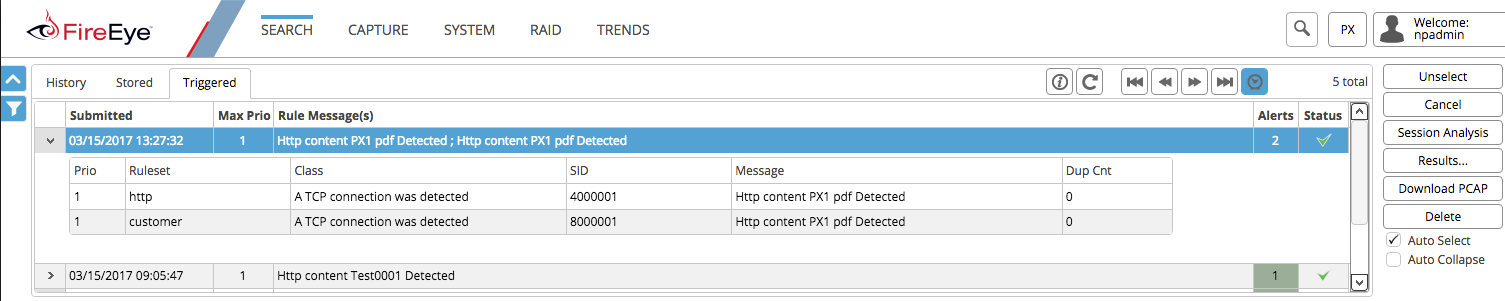
To view triggered results:
Note
The Ruleset field is empty for triggered alerts that occurred before the PX 4.5.0 upgrade.

In the PX Web UI, on the Search page, select the Triggered tab.
To view details, click a search.
Application identification in the Web UI
You can search based on Layer 7 application data. See Application Identification for applications identified in the application layer.
To view application layer data:
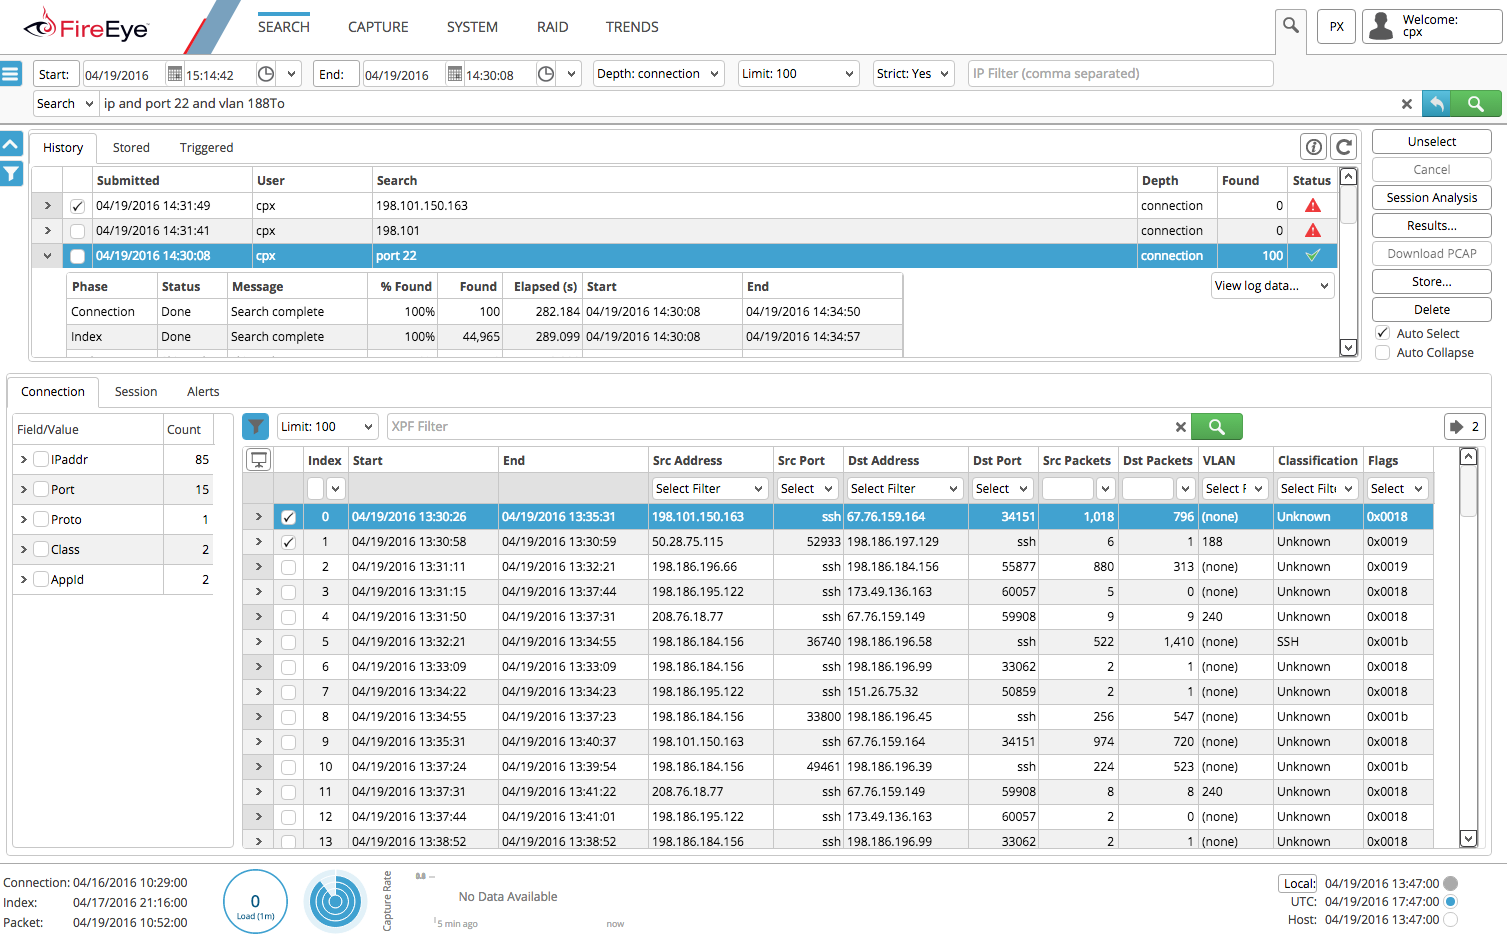
In the PX Web UI, on the Search page, select the Connection tab.
In connection results, the classification column displays the application type. If the application layer information is unavailable, then "unknown" is displayed.
Builder overview
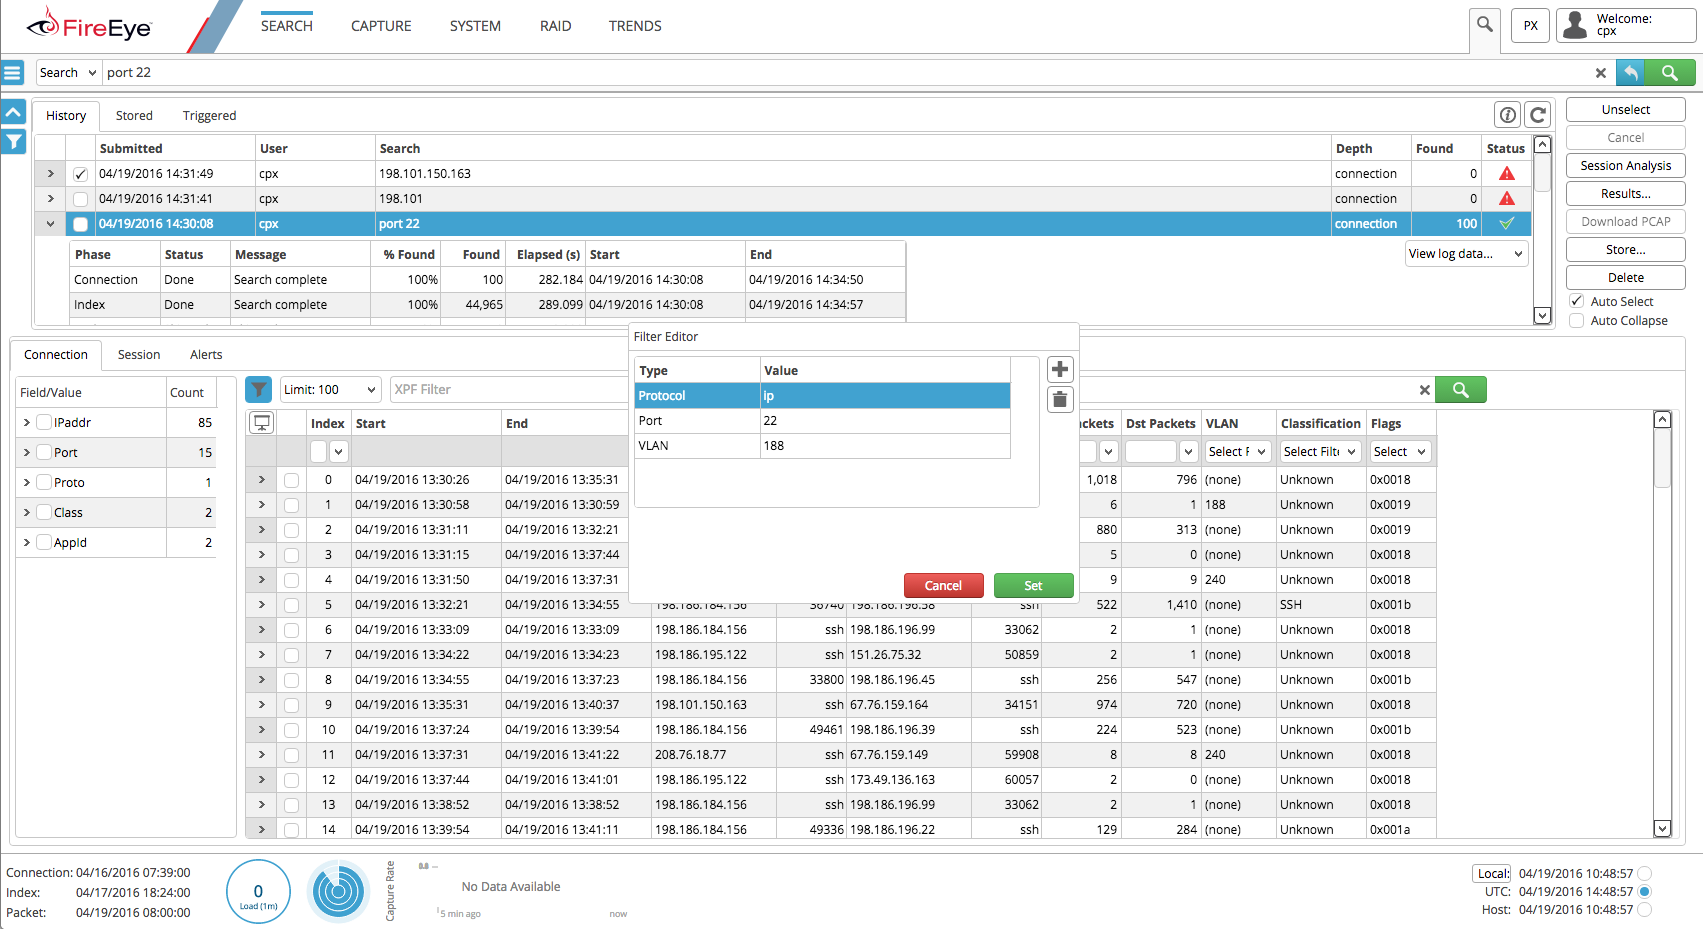
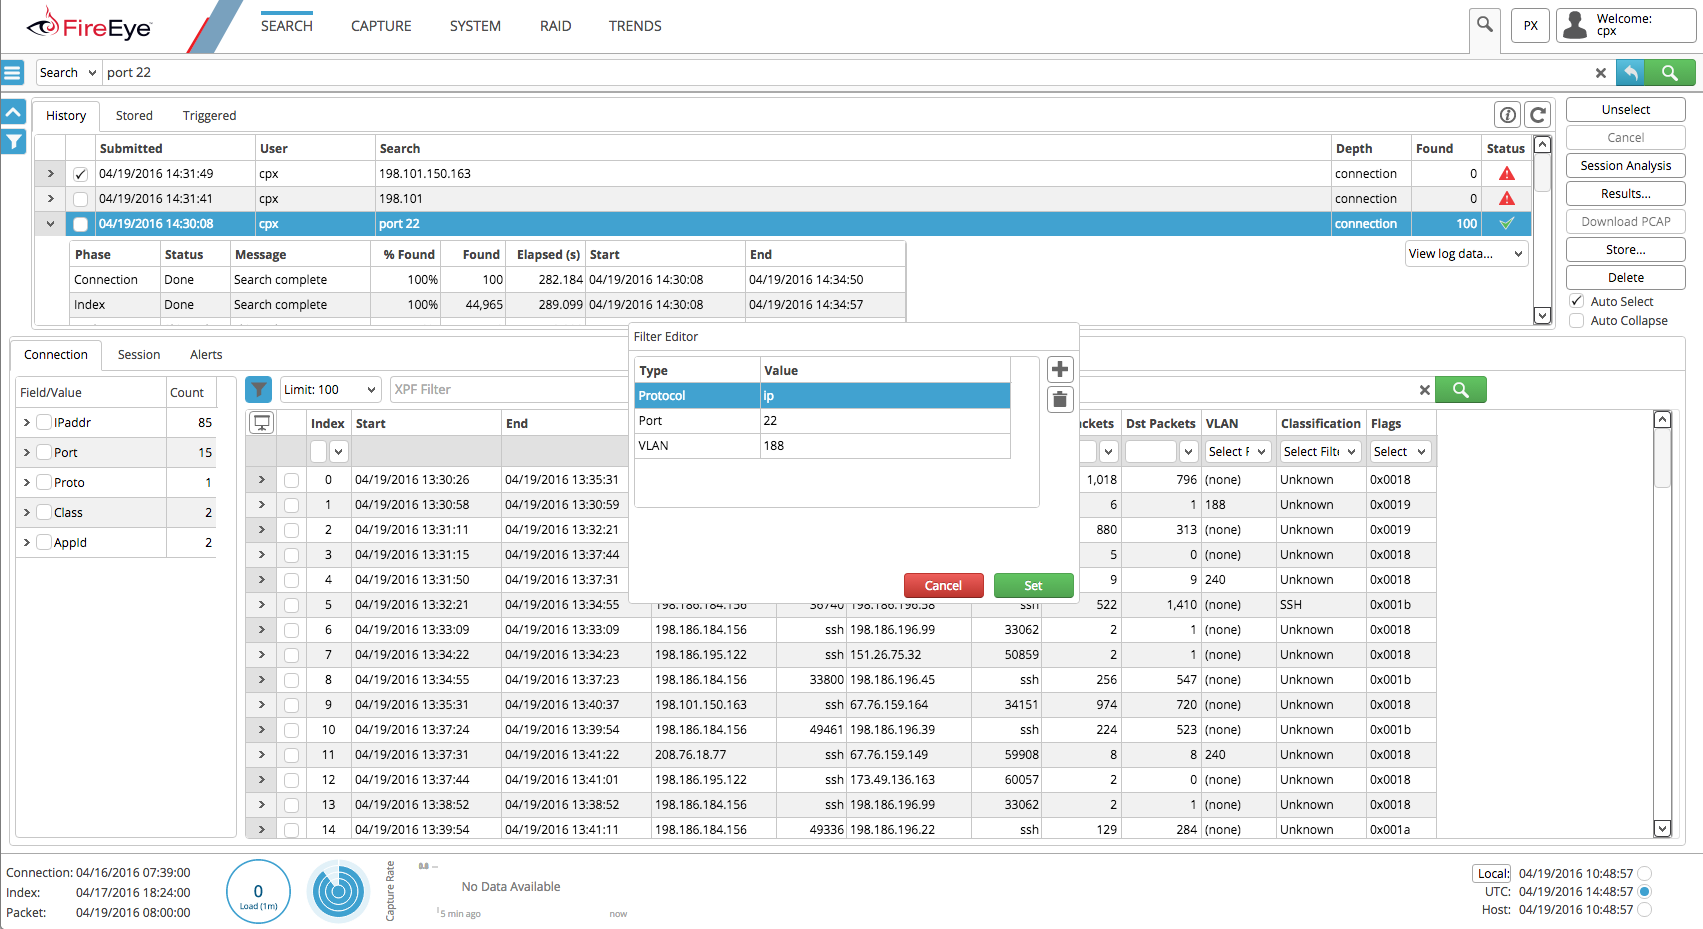
Builder can help you compose search filters. In the Search menu, select Builder to open the Filter Editor. Filter by common values, including:
Address
Application
Protocol
Port
Port Range
VLAN
MPLS
Connection Metadata
Creating a filter in the Web UI
To create a filter on the Search page:
In the Web UI, select Search.
In the Search menu, select Builder.
Choose a parameter to filter on, and then enter a value. For example, choose "port," and then enter the port number.
To add parameters, click "+."
Click Set to enter your filter in the Search bar.
Filter Using "Connection"
You can filter using "connection," for a faster search that returns only connection and packet previews.
If you need packets analyzed, then filter using "session." See Setting the Search Depth Level.
Viewing the connection results
In the search results, click the Connection tab to view connection and packet results data, such as the connections found, the start time and end time, the number of packets found, and additional information.
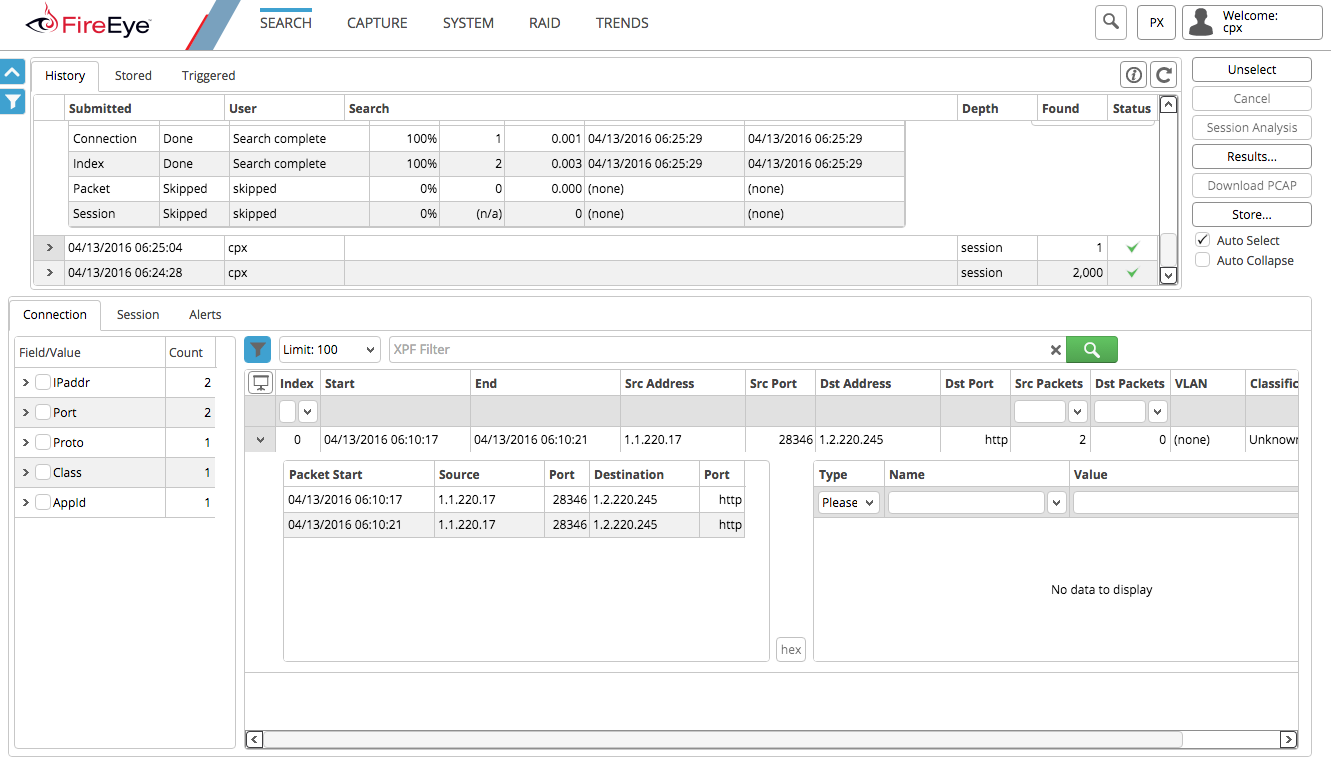
Connection Detail | Description |
Index | Index of the connection record in this result set. |
Start | Starting time of the connection |
End | Ending time of the connection |
Src Address | Source IP address |
Src port | Origination port |
Dst Address | Destination host |
Dst Port | Destination port |
Src Packets | Number of source packets in this connection |
Dst Packets | Number of destination packets in this connection |
VLAN | Virtual LAN IDs |
Classification | Application data classification. See Application Identification |
The left column displays connection details, including class, IP addresses, ports, and prototype information. Click any detail to further filter connection search results.
Check the box to download packets search results. The PX downloads the extracted PCAP file to your search results for further analysis.
Filter Using "Session"
You can filter using "session" for a slower search that returns and analyzes packet data.
For a faster search that returns only connection data, filter using "connection." See Setting the Search Depth Level.
Viewing session results
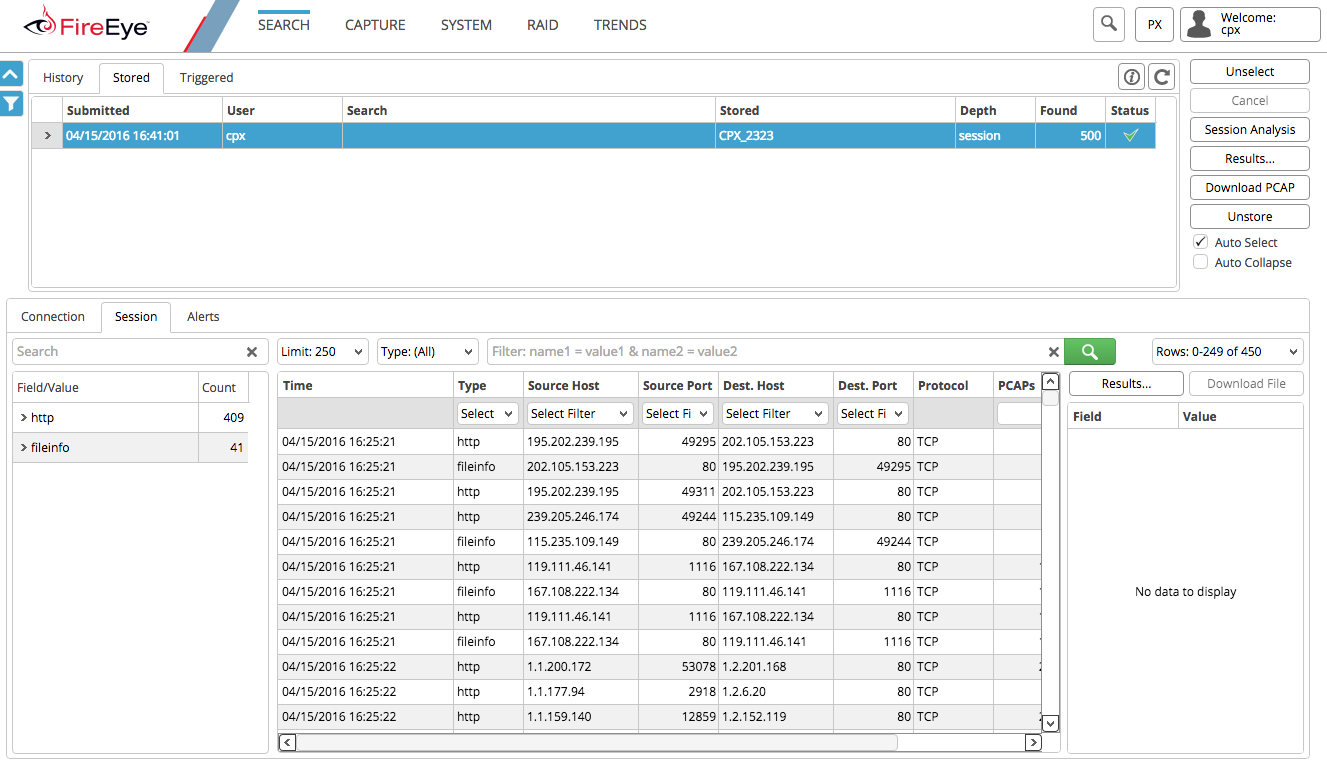
After session analysis, extracted files are compressed in a ZIP file. The file is password protected to prevent a malicious file being opened on your system. The password required for the archived file is password.
View detailed session information on the Session tab. To download session results, on the top bar, click Download File.
Session Analysis
Session Analysis Fields
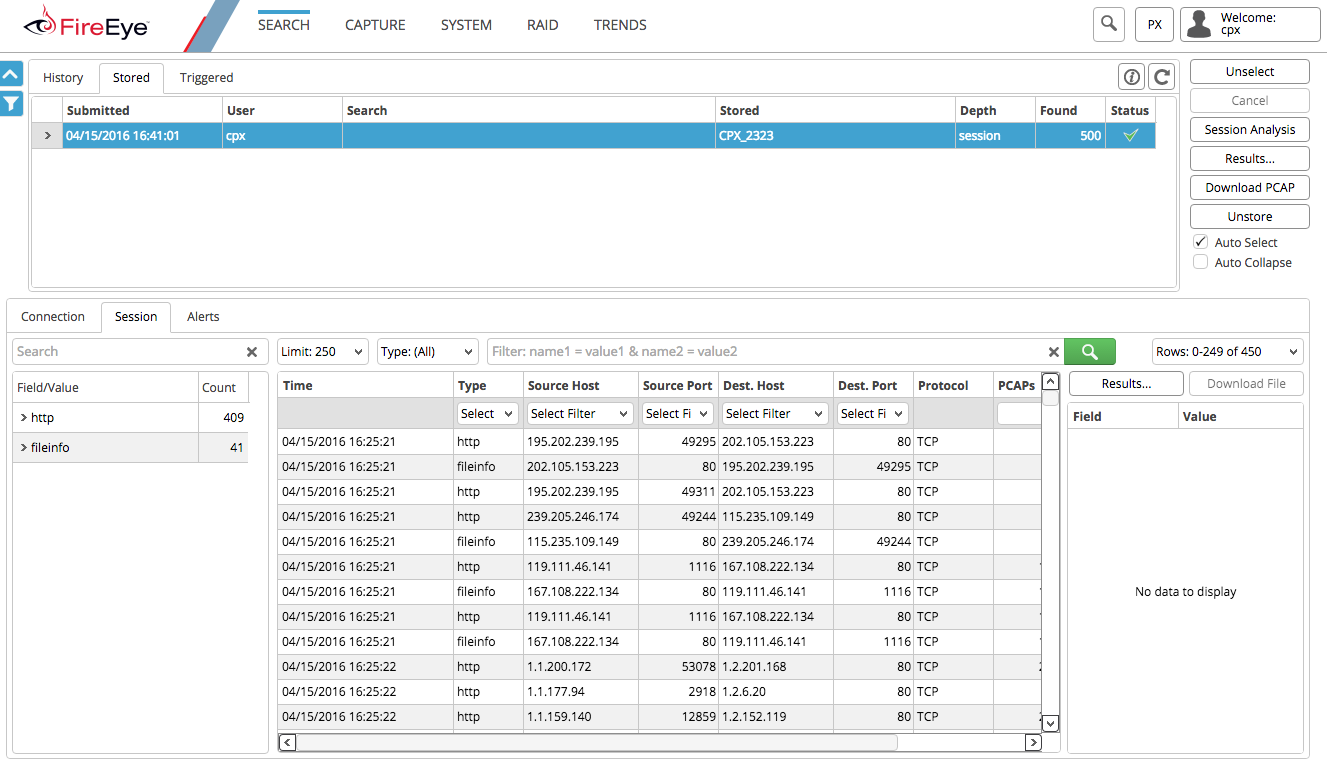
The Session tab shows the information available in the session-level connection records and the fields for filtering. You can filter the session attributes listed below in the Filter Bar using the format session attribute "value."
Connection Direction
You can set local_nets to a list of local networks:
L: Locally initiated
X: Not locally initiated
Connection State
The state of your connection is one of these:
SF Normal establishment and termination
REJ Connection attempt rejected
SO Connection attempt seen, no reply
RSTO Established, originator aborted
Connection State Meanings
Connection State | Meaning |
|---|---|
S0 | Connection attempt seen; no reply |
S1 | Connection established; not terminated |
SF | Normal establishment and termination. The same character as for state S1. For S1, there will be no byte counts in the summary |
REJ | Connection attempt rejected |
S2 | Connection established; originator attempted to close it; no reply from responder |
S3 | Connection established; responder attempted to close it; no reply from the originator |
RSTO | Connection established; originator aborted (sent an RST) |
RSTR | Connection established; responder aborted |
RSTOS0 | Originator sent a SYN followed by an RST; no SYN ACK from the responder |
RSTRH | Responder sent a SYN ACK, followed by an RST; no SYN from the (purported) originator |
SH | Originator sent a SYN, followed by a FIN; no SYN ACK from the responder (The connection was half open.) |
SHR | Responder sent a SYN ACK, followed by a FIN; no SYN from the originator |
OTH | No SYN seen; just midstream traffic. (A partial capture connection was not closed.) |
Connection
Connection | Meaning |
|---|---|
local orig |
|
missed bytess | Number of bytes missed in content gaps, which represents packet loss. A value other than zero usually causes protocol analysis to fail, but some analysis must be completed before the packet loss. |
origination bytes | Number of payload bytes the originator sent. For TCP, this is taken from sequence numbers and might be inaccurate because of large connections. |
origination city | Origination city from libgeoip |
origination country | Origination country from libgeoip |
origination ip bytes | Number of IP-level bytes that the originator sent (as seen on the wire, taken from IP total_length header field). |
origination packets | Number of packets the originator sent. |
origination port | Origination TCP/UDP port. |
Connection | Meaning |
|---|---|
origination region | Origination region from libgeoip. |
protocol | The transport layer protocol of the connection. |
response bytes | The number of payload bytes the responder sent. See "origination bytes." |
response ip bytes | Number of IP-level bytes that the responder sent (as seen on the wire, taken from IP total_length header field). |
response latitude | Response latitude from libgeoip. |
response longitude | Response longitude from libgeoip. |
response packets | Number of packets that the responder sent. |
response port | Response TCP/UDP port. |
response region | Response region code from libgeoip. |
ts | Time the first packet was sent. |
tunnel parents | If this connection was over a tunnel, indicate the "UID" values for any encapsulating parent connections used over the lifetime of this inner connection. |
uid | A unique identifier of the connection. |
HTTP
Session Attribute | Meaning |
|---|---|
filename | File name given in the Content Disposition header sent by the server. |
host | Value of the HOST header. |
info code | Last seen 1xx informational reply code returned by the server. |
info msg | Last seen 1xx informational reply message returned by the server. |
method | Verb used in the HTTP request (GET, POST, HEAD, etc.). |
password | Password if basic-auth is performed for the request. |
referrer | Value of the "referer" header. The comment is deliberately misspelled as the standard declares, but the name here is "referrer," spelled correctly. |
request body len | Actual uncompressed content size of the data transferred from the client. |
response body len | Actual uncompressed content size of the data transferred from the server. |
status code | Status code returned by the server. |
status msg | Status message returned by the server. |
tags | Attributes discovered and related to a request/response pair. |
uri | URI used in the request. |
Session Attribute | Meaning |
|---|---|
user agent | Value of the User-Agent header from the client. |
Username | Username if basic-auth is performed for the request. |
SMTP
Session Attribute | Meaning |
|---|---|
date | Contents of the Date header. |
first received | Contents of the First Received header. |
from | Contents of the From header. |
has client activity | Client activity has been seen but not logged. |
helo | Contents of the Helo header. |
in reply to | Contents of the In-Reply-To header. |
last reply | The last message the server sent to the client. |
mailfrom | Contents of the From header. |
msg id | Contents of the MsgID header. |
path | The message transmission path, as extracted from the headers. |
process received from | Indicates that the “Received:from” headers should still be processed. |
rcptto | Contents of the Rcpt header. |
Session Attribute | Meaning |
|---|---|
reply to | Contents of the ReplyTo header. |
second received | Contents of the second Received header. |
subject | Contents of the Subject header. |
to | Contents of the To header. |
user agent | Value of the User-Agent header from the client. |
x origination ip | Contents of the X-Originating-IP header. |
DHCP
Session Attribute | Meaning |
|---|---|
mac | Client's hardware address. |
assigned ip | Client's assigned IP address. |
lease time | IP address lease level. |
trans id | A random number chosen by the client for this transaction. |
DNS
Session Attribute | Meaning |
|---|---|
AA | The Authoritative Answer bit for response messages specifies that the responding ame server is an authority for the domain name in the question. |
Session Attribute | Meaning |
|---|---|
section. | |
answers | The last set of resource descriptions in the query answer. |
proto | The transport layer protocol of the connection. |
qclass | The QCLASS value specifying the class of the query. |
qclass name | A descriptive name for the class of the query. |
qtype | A QTYPE value specifying the type of the query. |
qtype name | A descriptive name for the type of the query. |
query | The domain name that is the subject of the DNS query. |
RA | The Recursion Available bit in a response message indicates that the name server supports recursive queries. |
rcode | The response code value in DNS response messages. |
rcode name | A descriptive name for the response code value. |
RD | The Recursion Desired bit in a request message indicates that the client wants recursive service for this query. |
ready | Indicates that this request/response pair is ready to be logged. |
rejected | The DNS query was rejected by the server. |
TC | The Truncation bit specifies that the message was |
Session Attribute | Meaning |
|---|---|
truncated. | |
total answers | The total number of resource records in a reply message’s answer section. |
total replies | The number of resource records in a reply message’s answer, authority, and additional sections. |
trans id | A 16-bit identifier assigned by the program that generated the DNS query. Also used in responses to match replies to outstanding queries. |
TTLs | The caching intervals of the associated Resource Records (RRs) described by the “answers” field. |
Z | A reserved field that should be zero in all queries and responses. |
SSH
Session Attribute | Meaning |
|---|---|
client | Software string from the client. |
direction | Direction of the connection. If the client is a local host logging into an external host, this is OUTBOUND. In the opposite situation it is INBOUND. |
done | Indicates that the SSH session is over. |
server | Software string from the server. |
status | Indicates whether the login was heuristically guessed to be “success,” “failure,” or “undetermined.” |
SSL
Session Attribute | Meaning |
|---|---|
analyzer ID | The analyzer ID used for the analyzer instance attached to each connection. It is an arbitrary number. |
cert | Full binary server certificate stored in DER format. |
cert chain | Chain of certificates offered by the server to validate its complete signing chain. |
cipher | SSL/TLS cipher suite that the server chose. |
client cert | Full binary client certificate stored in the DER format. |
client cert chain | Chain of certificates offered by the client to validate its complete signing chain. |
client issuer subject | Subject of the signer of the X.509 certificate offered by the client. |
client subject | Subject of the X.509 certificate offered by the client. |
issuer subject | Subject of the signer of the X.509 certificate offered by the server. |
last alert | Last alert that was seen during the connection. |
not valid after | NotValidAfter field value from the server certificate. |
not valid before | NotValidBefore field value from the server certificate. |
server name | Value of the Server Name Indicator SSL/TLS extension. It indicates the server name that the client requested. |
Session Attribute | Meaning |
|---|---|
session id | Session ID offered by the client for session resumption. |
subject | Subject of the X.509 certificate offered by the server. |
version | SSL/TLS version that the server offered. |
FTP
Session Attribute | Meaning |
|---|---|
arg | Argument for the command, if one is given |
capture password | Determines whether the password will be captured for this request |
cmdarg | Command waiting for a response |
command | Command given by the client |
cwd | Working directory for this session. The default value '.' indicates that unless something more concrete is discovered, the existing but unknown directory is OK to use. |
data channel | Expected FTP data channel |
file size | Size of the file, if the command indicates a file transfer |
mime type | Libmagic “sniffed” file type, if the command indicates a file transfer |
passive | Indicates whether the session is in active or passive |
Session Attribute | Meaning |
|---|---|
mode | |
password | Password for the current FTP session, if captured |
pending commands | Commands that have been sent but have not received a response |
reply code | Reply code from the server in response to the command |
reply msg | Reply message form the server in response to the command |
user | User name for the current FTP session. |
Connection metadata properties
Within the PX Filter Builder, you can search by Connection Metadata properties for an even more detailed session view. First, select the desired property from the Connection Metadata menu. Enter a user-specified value for your search.
The following is a list of operators and their definitions:
Operator | Description |
|---|---|
= | The value of the attribute must be equal to the value of the constant. |
!= | The value of the attribute must not be equal to the value of the constant; however, the attribute must exist. |
< | The value of the attribute must be less than the value of the constant. |
<= | The value of the attribute must be less than or equal |
Operator | Description |
|---|---|
to the value of the constant. | |
> | The value of the attribute must be greater than the value of the constant. |
>= | The value of the attribute must be greater than or equal to the value of the constant. |
AND | and | The value of the attribute must be equal to the value of each defined constant. |
OR | or | The value of the attribute must be equal to the value of one defined constant or another defined constant. |
~ | The value of the attribute must be like the value of the constant. |
!~ | The value of the attribute must not be like the value of the constant. |
Use the filter expression syntax in the table below to creating filter definitions:
Filter Expression | Description |
|---|---|
<expression> | ( <expression> ) | <booleanExpression> | <stringExpression> | <numericExpression> |
<booleanExpression> | <expression> <and> <expression> | <expression> <or> <expression> |
<stringExpression> | <key> <stringOperator> <regularExpression> |
<numericExpression> | <key> <numericOperator> <numericValue> |
XPF search parameters for connection metadata
You can perform a search using the XPF parameters.
Connection Metadata Property | Definition |
|---|---|
connectionReason | The reason for connection termination. Valid values are:
|
layer3FlagsIn | Combination of all IPv4 flags seen for packets from IP1 to IP2 for the connection |
layer3FlagsOut | Combination of all IPv4 flags seen for the packets from IP2 to IP1 for the connection |
layer4FlagsIn | Combination of all TCP flags seen for the packets from IP1 to IP3 for the connection |
layer4FlagsOut | Combination of all TCP flags seen for the packets from IP2 to IP1 for the connection |
layer7classification | Categorization of all traffic at the application layer for easier grouping and searching |
streamNumber | Logical number assigned to a stream of packets |
sortedHashValue | A hash of the 5-tuple information (source/ destination IP address, source/destination port & protocol) |
Connection Metadata Property | Definition |
|---|---|
roundTripTime | Amount of time in milliseconds that it took for one packet to be sent from IP1 to IP2 and for IP2 to send a packet back to IP1 |
connectionEndSeconds | Portion of the timestamp of the end of the connection. Units are seconds since Jan. 1, 1970. This field, combined with connectionEndNanoseconds, gives you the full nanoseconds timestamp of the end of the connection |
connectionEndNanoseconds | Fractional portion of the timestamp of the end of the packet. Units are in nanoseconds. This field, combined with connectionEndSeconds, gives you the full nanosecond timestamp at the end of the connection |
octetDeltaCountIn | Number of octets sent from IP1 to IP2 for this connection |
octetDeltaCountOut | Number of octets sent from IP2 to IP1 for this connection |
packetDeltaCountIn | Number of packets sent from IP1 to IP2 for this connection |
packetDeltaCountOut | Number of packets sent from IP2 to IP1 for this connection |
droppedOctetDeltaCountIn | Number of octets dropped from IP1 to IP2 for this connection |
droppedOctetDeltaCountOut | Number of octets dropped from IP2 to IP1 for this connection |
droppedPacketDeltaCountIn | Number of packets dropped from IP1 to IP2 for this connection |
Connection Metadata Property | Definition |
|---|---|
droppedPacketDeltaCountOut | Number of packets dropped from IP2 to IP1 for this connection |
Filter search parameters
This table lists the common BPF (Berkeley Packet Filter) search parameters in a packet search.
Search elements can be listed in any order. See http://www.tcpdump.org. The BPF can be combined with proprietary XPF connection metadata properties search parameters listed in the Connection Metadata Properties. See XPF Search Parameters for Connection Metadata.
Parameter | Description |
|---|---|
dst host | True if the IPv4 or IPv6 destination address field of the packet matches. The value is in standard IPv4 and IPv6 notation (for example, 192.168.1.1 and 2001:db8:aaaa:bbbb:cccc:dddd:eeee:aaaa). |
src host | True if the IPv4 or IPv6 source address field of the packet matches. The value is in standard IPv4 and IPv6 notation (for example, 192.168.1.1 and 2001:db8:aaaa:bbbb:cccc:dddd:eeee:aaaa). |
host | True if either the IPv4 or IPv6 source or destination address of the packet is host. The value is in standard IPv4 and IPv6 notation (for example, 192.168.1.1 and 2001:db8:aaaa:bbbb:cccc:dddd:eeee:aaaa). |
ether dst | True if the Ethernet destination address matches the value given in numeric format. The value can be hex string or colon-delimited hex string (for example, 0025b3a74382 or 00:25:b3:a7:43:82). |
ether src | True if the Ethernet source address matches the value given in numeric format. The value can be hex string or colon-delimited hex string (for example, 0025b3a74382 or 00:25:b3:a7:43:82). |
Parameter | Description |
|---|---|
string or colon-delimited hex string (for example, 0025b3a74382 or 00:25:b3:a7:43:82). | |
ether host | True if the Ethernet destination or source address matches the value given in numeric format. Value can be hex string or colon-delimited hex string (for example, 0025b3a74382 or 00:25:b3:a7:43:82). |
dst net | True if the IPv4 or IPv6 destination address of the packet matches the network number provided. IPv4 network number can be written as a dotted quad (for example, 192.168.1.0), dotted triple (192.168.1), dotted pair (172.16), or single number (10). The netmask is 255.255.255.255 for a dotted quad (which means that it's a host match), 255.255.255.0 for a dotted triple, 255.255.0.0 for a dotted pair, or 255.0.0.0 for a single number. An IPv6 network number must be written out fully; the netmask is ff:ff:ff:ff:ff:ff:ff:ff, so IPv6 “network” matches are always host matches. |
src net | True if the IPv4 or IPv6 source address of the packet matches the network number provided. See dst net description for format. |
netmask | True if the IPv4 address matches net with the specific netmask. May be qualified with src or dst. Note that this syntax is not valid for IPv6 net. |
net | True if the IPv4 or IPv6 address matches network with a netmask of specified length. May be qualified with src or dst. Format is network/len. |
dst port | True if the packet is ip/tcp, ip/udp, ip6/tcp or ip6/udp and has a destination port value that matches a given value. The port can be a number or a standard protocol name defined by http://www.iana.org. If a |
Parameter | Description |
|---|---|
dst port | name is used, both the port number and protocol are checked. If a number or ambiguous name is used, only the port number is checked. For example, dst port 513 will print both tcp/login traffic and udp/who traffic, and port domain will print both tcp/domain and udp/domain traffic. Any of the port or port range expressions can be prepended with the keywords, tcp or udp (for example, tcp dst port 25, tcp port 25, tcp dst portrange 5-25). |
src port | True if the packet is ip/tcp, ip/udp, ip6/tcp or ip6/udp and has a source port value that matches a given value. See dst port description for format. |
port | True if the packet is ip/tcp, ip/udp, ip6/tcp or ip6/udp and has a source or destination port value that matches a given value. See dst port description for format. |
dst portrange | True if the packet is ip/tcp, ip/udp, ip6/tcp or ip6/udp and has a destination port value between port1 and port2 values. Format is port1-port2 (dst portrange 5-25). Port1 and port2 are interpreted in the same fashion as the port parameter for port. |
src portrange | True if the packet is ip/tcp, ip/udp, ip6/tcp or ip6/udp and has a source port value between port1 and port2. Format is port1-port2 (src portrange 5-25). Port1 and port2 are interpreted in the same fashion as the port parameter for port. |
portrange | True if the packet is ip/tcp, ip/udp, ip6/tcp or ip6/udp and has a destination or source port value between port1 and port2. Format is port1-port2 (portrange 5-25). Port1 and port2 are interpreted in the same fashion as the port parameter for port. |
Parameter | Description |
|---|---|
ip proto | True if the packet is an IPv4 packet of a given protocol type. Protocol type can be a number or one of the names icmp, icmp6, igmp, igrp, pim, ah, esp, vrrp, udp, or tcp. Note that the identifiers tcp, udp, and icmp must be escaped via backslash (\), (ip proto \tcp, ip proto igmp, ip proto 4). These identifiers can be used without the ip proto key word (bpf:"udp"). |
ip6 proto | True if the packet is an IPv6 packet of a given protocol type. The ip6 proto should chase the header chain, but currently it does not. In order for your search string to work properly, you must use “ip6 protochain <protocol number>”. For example: ip6 protochain 58 and host 3130:3238:2e31:3731:302d:3137:3131:2e70 and host ff02::1. This search string does not work: proto 58 and host 3130:3238:2e31:3731:302d:3137:3131:2e70 and host ff02::1. |
ip6 protochain | True if the packet is IPv6 packet, and contains a protocol header with a given protocol type in its protocol header chain. For example: “ip6 protochain 6”. Matches any IPv6 packet with a TCP protocol header in the protocol header chain. The packet may contain, for example, an authentication header, routing header, or hop-by-hop option header, between the IPv6 header and the TCP header. This search is complex and can be somewhat slow. |
ip protochain | Equivalent to ip6 protochain protocol, but for IPv4. |
ether broadcast | True if the packet is an Ethernet broadcast packet. The ether keyword is optional. |
ether multicast | True if the packet is an Ethernet multicast packet. The ether keyword is optional. This is shorthand for |
Parameter | Description |
|---|---|
| |
ip multicast | True if the packet is an IPv4 multicast packet. |
ip6 | True if the packet is an IPv6 multicast packet. |
ether proto | True if the packet is of ether type protocol. Protocol can be a number or one of the names |
vlan | True if the packet is an IEEE 802.1Q VLAN packet. If a |
mpls | True if the packet is an MPLS packet. If a |
Parameter | Description |
|---|---|
For example: “mpls 100000 && mpls 1024” filters packets with an outer label of 100000 and an inner label of 1024, and “mpls && mpls 1024 && host 192.9.200.1” filters packets to or from 192.9.200.1 with an inner label of 1024 and any outer label. | |
pppoed | True if the packet is a PPP-over-Ethernet Discovery packet (Ethernet type 0x8863). |
pppoes | True if the packet is a PPP-over-Ethernet Session packet (Ethernet type 0x8864). The first pppoes keyword encountered changes the decoding offsets for the remainder of expression, if the packet is a PPPoE session packet. For example: “pppoes && ip” filters IPv4 protocols encapsulated in PPPoE. |
iso proto | True if the packet is an OSI packet of protocol-type protocol. The protocol can be a number or one of the names clnp, esis, or isis. |
The BPF parameters above can be combined using these operators:
Negation (! or not)
Concatenation (&& or and)
Alternation (|| or or)
Negation has highest precedence. Alternation and concatenation have equal precedence and associate left to right.
If an identifier is given without a keyword, the most recent keyword is assumed.
For example:
"not host 192.1.1.1 and 192.1.1.2"is short for
"not host 192.1.1.1 and host 192.1.1.2"ICMP fields
These ICMP type field values are available:
icmp-echoreply
icmp-unreach
icmp-sourcequench
icmp-redirect
icmp-echo
icmp-routeradvert
icmp-routersolicit
icmp-timxceed
icmp- paramprob
icmp-tstamp
icmp-tstampreply
icmp-ireq
icmp-ireqreply
icmp-maskreq
icmp-maskreply
Packet capture file format
The PX uses PCAP with nanosecond time format for all files.
File Header
The PCAP file starts with this file header:
#define NSEC_TCPDUMP_MAGIC 0xa1b23c4d
#define USEC_TCPDUMP_MAGIC 0xa1b2c3d4
typedef struct4 | Preface
{
uint32_t magic; /* NSEC_TCPDUMP_MAGIC or
USEC_TCPDUMP_MAGIC */
uint16_t version_major;
uint16_t version_minor;
uint32_t thiszone; /* UTC to local correction */
uint32_t sigfigs; /* accuracy of timestamps */
uint32_t snaplen; /* max length saved portion of each frame */
uint32_t linktype; /* data link type */
} PCAP_FILE_HDR;
Frame format
Following the file header, frames are stored sequentially with a frame header (PCAP_HDR) followed by the raw bytes of the frame. The header has three fields:
The time the packet was captured (ts)
The length of the portion captured (caplen)
The length of the packet on the wire (wirelen)
Your title goes here
If caplen is less than wirelen, then the packet was “sliced”. Packet slicing means that only a portion of the captured packet was saved: usually the header. This behavior reduces the storage and processing needed to inspect packets.
For example:
typedef struct
{
PCAP_TIME ts; /* time stamp */
uint32_t caplen; /* length of portion captured */
uint32_t wirelen; /* length of packet on wire */
} PCAP_HDR;
Timestamp format
The timestamp format (PCAP_TIME) has two components:
Seconds since January 1, 1970, 00:00:00 GMT (also known as “Unix time”)
Number of microseconds or nanoseconds within the second
For example:
typedef struct
{
uint32_t tv_sec;
uint32_t tv_nsec; /* nanosecond (or microsecond),
depending on the magic field */
} PCAP_TIME;The PX can timestamp frames to a 10-nanosecond resolution.
5 | Preface
Events and Capture
This part discusses these topics:
Local Event Logging
Event Based Capture
Capture File System
Capture OS
Capture Status
Local event logging
You can collect events and download data based on a time range. For example, you can filter based on HTTP events. The local event log includes these Layer 7 metadata types:
Protocol Decoders | ||
|---|---|---|
DCE-RPC | IPv6 | SMB |
DHCP | IRC | SMB2 |
DNS | MODBUS | SMTP |
ERSPAN | MPLS | SSL |
FTP | MSN | SSH |
GRE | POP3 | TCP |
HTTP | PPP | TEREDO |
ICMPv4 | RDP | TLS |
ICMPv6 | RTSP | UDP |
Protocol Decoders | ||
|---|---|---|
IMAP | SCTP | VLAN |
IPv4 | SIP | |
You can use the PX API to query for events within a time range. See the PX API Guide for details.
Example event log data
# Example SMTP record{"protocolIdentifier":6,"mailTo":"<nonexistential@oe-consulting.com>","mailSubject":"USPS: DELIVER
CONFIRMATION - FAILED
7367914","sourceIPv4Address":"112.184.40.237","sourceTransportPort":28727,"@timestamp":"2015-03-30T18:07:58.000Z","obs
Logistics Express <ups-shippingagency@ups.com>","mailToList":["<nonexistent@oe-consulting.com>"],"nested":[{"filename":["MYUPS_Na769376.htm"]}]}# Example DNS record{"dnsFlags":33152,"protocolIdentifier":17,"sourceIPv4Address":"8.8.8.8","sourceTransportPort":53,"@timestamp":"2015-03-30T18:07:58.000Z"}# Example HTTP record{"httpContentType":"text/html","protocolIdentifier":6,"httpReferer":"","httpUserAgent":"","httpGet":"/","sourceIPv4Address":"68.232.37.36","httpForwarded-For":"","httpResponse":200}# Example Alert{"protocolIdentifier":58,"destinationIPIPv6Address":"ff02::1:ff12:1","sourceTransportPort":135,"appType":4,"npulseStream":"ICMPIPv6 invalid checksum","ruleClass":"","rulePayload":"0x4C6934754C6941754C6934754C6934754C6949754C69343D"}Event-based capture overview
Event-Based Capture (EBC) uses defined rules to capture data around a specific event in network traffic. For example, you can use EBC to capture all packets for a blacklisted host address. When a rule matches an event in network traffic, the PX appliance creates a search on the data surrounding the event. Packets retrieved from event based searches are managed and stored differently than other packets. In the PX Web, EBC is displayed as Triggered.
Important
Event Based Capture can be configured only through the PX API. See "Event-based capture" in the PX Series API Guide.
If you are using PX with Trellix as a Service (FaaS), then you cannot access this data.
EBC rules overview
EBC rules are typically based on malware, data theft, and blacklists. The PX can load lists of IP addresses including subnets from threat feeds. The PX supports up to 3,000 rules for alerting and supports a combination of up to 10,000 IPv4 and IPv6 addresses for blacklist alerting.
The ebc-rules.tar file should contain *.rules, *.list, and categories.txt files.
EBC rules must use the naming convention ebc-rules.extension, with one of these extension formats:
• tar.gz | • tar.xz |
• tgz | • txz |
• tar.bz2 | • tar |
• tbz2 |
|
To capture packets when the rule is triggered, your rule must have metadata : ebc_pcap.
For example:
alert http any any -> any 80 (msg: "GET Method Found";content:"GET";nocase;http_method;classtype: tcp-connection; metadata: ebc_pcap; priority:1; sid:10000003;)Note
In 4.3.0, if the
metadata:ebctag is not in a rule, then EBC is active for that rule.In 4.3.1, the user must explicitly mark rules as being EBC. Therefore, if the tag does not exist, then the EBC is not done for that rule.
File processing order overview
EBC rules package processing is based on file extensions.
If two files have the same root name and different extensions, for example, ebc-rules.tar and ebc-rules.tar.gz in the same /capture/npscp/ location, then the extensions are processed in this order: tar.gz, tgz, tar.bz2, tbz2, tar.xz, txz, and tar.
When the first matching file is found, the other extensions are not processed. For example, in the case of ebc-rules.tar.gz and ebc-rules.tar, ebc-rules.tar is ignored, and the gzipped version is used.
In this example, the ebc-rules.tar is left in place, so if another import occurs, either manually or through cron, then the rules in ebc-rules.tar become the active rule set.
Note
EBC processes only flow-based alerts. Because flows are not defined for non-IP traffic, ICMP and other non-IP alerts are not supported.
Importing rules overview
When you import new EBC rules manually or through cron, existing rules are replaced. To add new rules to existing rules, you must add the existing rules and the new rules in the ebc-rules.tar file.
Creating IP address blacklists
MISSING FILE: Content/Topics/PX_User_Guide/Events & Capture/Event Based Capture/Creating IP Address Blacklists.htm
Enabling EBC prerequisites
Admin access to the PX appliance
Rules for event based capture
An uploaded archive containing *.rules, *.list, and categories.txt files
A license for Layer 7 metadata extraction
Enabling EBC in the CLI
To enable EBC:
SSH to the PX as npadmin. For example:
$ ssh npadmin@10.7.7.1Type
enableto enter privileged mode.Press Enter.
Type your npadmin password. The default password is hammerhead.
Type
configure pxto enter configuration mode.
Type ebc to open the Event Based Capture menu:
Periodic Rule Update: Off
Last Rule Update:
--------------------------------------------------------
P: Toggle Periodic Rule Update On/Off
U: Manually update the Event Based Capture Ruleset
X: Clear Event Based Capture Ruleset
Q: Save Changes and exit
C: Cancel Changes and exit
Select an option:
Type P to enable periodic rule updates.
This will look in the
/capture/npscp/folder every 15 minutes and automatically process any ebc-rules* package.To manually update rules, type U. The periodic rule update and manual update work congruently.
Type X to clear the Event Based Capture rule set.
Type Q to save changes and exit.
EBC in the Web UI
You can view event-based captures on the Triggered tab in the Web UI. The Triggered tab shows events that have matched an EBC rule and are automatically stored.
Item | Definition |
|---|---|
Submitted | The time the search was submitted. |
Item | Definition |
|---|---|
Search | The search string. |
Alerts | Number of alerts. |
Status | A green check mark indicates the capture is stored. |
EBC alerts
You can view the event-based capture alerts. The table below describes the alert details.
Item | Definition |
|---|---|
Time | The time the search was submitted. |
Src Addr | The alert source address. |
Src Port | The alert source port. |
Dst Addr | The alert destination address. |
Dst Port | The alert destination port. |
EBC | The capture type. |
Proto ID | The protocol ID. |
Proto Name | The type of protocol. |
Dup Cnt | Duplicate count. |
Rule Class | The rule that was defined in the rule configuration. |
Rule Message | The message that was defined in the rule configuration. |
5 | Preface
Item | Definition |
|---|---|
Priority | The rule priority. |
Rev | The rule revision number. |
SID | Unique number to identify the object. |
To view the EBC alert details in the Web UI:
Go to the PX appliance dashboard.
Select the Triggered tab on the Search page.
Select the search string in the Triggered table.
Select the Alerts tab under the Trigger table.
View the alert details for the selected search string.
Capture file system
Performance
The PX capture file system (/capture directory) is set up with high-performance XFS to achieve high throughput write-to-disk operations. PX systems are shipped with storage configured as RAID 6 and all supported RAID levels (0, 10, 5, 50, 6, 60) enabled.
The PX UI appliance default is set to RAID 5.
Note
Each PX model was verified to capture and process data at the claimed throughput rates using traffic composed of a representative mix of protocols commonly seen in an enterprise environment and searches using common criteria. Performance will vary depending on the network traffic composition and search requests. Consult with Trellix support to determine expected performance in a given environment.
Rebuilding
This section describes how to initialize the disk drives in the capture array on an initial installation or to reassemble the drive array when upgrading from a previous release. Several options are available and detailed below.
a previous release, use the reassemble command in the configuration options to preserve data currently stored on the capture array.
RAID 0 array – RAID 0 array provides the best performance and full use of all available storage and does not provide redundancy for hard disk failures.
RAID 5 array – provides a high degree of capacity and write speed with a limited degree of redundancy. RAID 5 stripes data across multiple drives, and distributes parity data. Due to the configuration of RAID 5, a single disk in the array may be lost without losing data in the array. If a second disk is lost before the array is rebuilt, then data will be lost. RAID 5 requires at least 3 disks as part of the array which can be conceptualized as 2 data, 1 parity.
RAID 6 array – provides a balanced approach to write speed and capacity with improved redundancy. RAID 6 stripes data across multiple drives, and double-distributes parity. Because parity information is double-distributed, up to two disks can be lost before there is no longer any redundancy in the array. If a third disk is lost before the array is rebuilt, then data will be lost. RAID 6 requires at least 4 disks as part of the array which can be conceptualized as 2 data, 2 parity.
RAID 10 array – RAID 10 array provides optimum redundancy using RAID 0 on top of multiple RAID 1 arrays. All data on RAID 1 arrays is mirrored to separate drives. The write-to-disk performance is decreased by about 33% and storage by 50% as it uses half of array for redundancy.
RAID 50 array – RAID 50 array provides optimized redundancy and storage capacity using RAID 0 on top of RAID 5. One drive from any RAID 5 array can be lost and recovery is possible. Write-to-disk performance is decreased by about 33% and storage by 1 drive on 1000 series systems.
RAID 60 array – RAID 60 array provides optimized redundancy and storage capacity using RAID 0 on top of RAID 6. Two drives from any RAID 6 array can be lost and recovery is possible. Write-to-disk performance is decreased by about 33% and storage by 2 drives on 1000 series systems, 2 drives on 2000 systems.
Rebuilding the disk using the CLI
To rebuild a disk:
$ ssh npadmin@10.7.7.10
[sudo] password for npadmin: <password>
hostname# raid rebuild.LVM modifications need to be performed. Do you want to continue? [y/n]: y
SSH to the PX appliance:
Enter the npadmin password:
Enter raid rebuild mode to generate a new storage configuration:
Enter y at the following prompt:
Identifying RAID volumes
PX 2000, 3000, and 4000 series appliances are equipped with two or more RAID controllers. To preserve the data associated with a capture file system, it is important you store the drives as a volume (group) if you remove them from the PX while it is powered off. Otherwise, data will be lost.
Before removing drives from the PX, run identify-raid in the /opt/px/scripts. This script will activate the LED lights of all the drives associated with a RAID controller. This lets you remove and store the drives as a set and preserve the RAID volume’s integrity.
The identify-raid command is a script that executes the identify command with the Adaptec uniform command-line interface. To use it, pass the parameter 1 or 2 as a command-line argument.
Identifying RAID volumes using the CLI
To identify a RAID volume:
Navigate to the command-line interface.
Run
identify-raidin the/opt/px/scripts.Type this command to light the LEDs associated with RAID controller 1:
/opt/npulse/scripts/identify-raid 1Type this command to light the LEDs associated with RAID controller 2:
/opt/npulse/scripts/identify-raid 2
Checking the RAID volume level
To check the RAID volume level:
Click on the RAID tab in the PX Web UI dashboard.
You will see the status for each RAID controller and each physical disk in the array.
For more details, see Capture File System on page 1.
Capture OS
The command-line interface allows you to configure and administer your PX Series appliance. This section describes the top-level CLI menu options available on your PX appliance. See the PX Series System Administration Guide for more information on how to use the CLI menu options to configure and administer your PX appliance for your network environment.
Important
To optimize performance of your PX appliance, you should only configure the number of capture interfaces that you intend to use.
Help
To obtain context-sensitive help information from any mode in CaptureOS, type the mode followed by > ?. For example, type configure ? at the command prompt to view more information about each menu option available in configure mode.
npadmin@hostname> configure ?
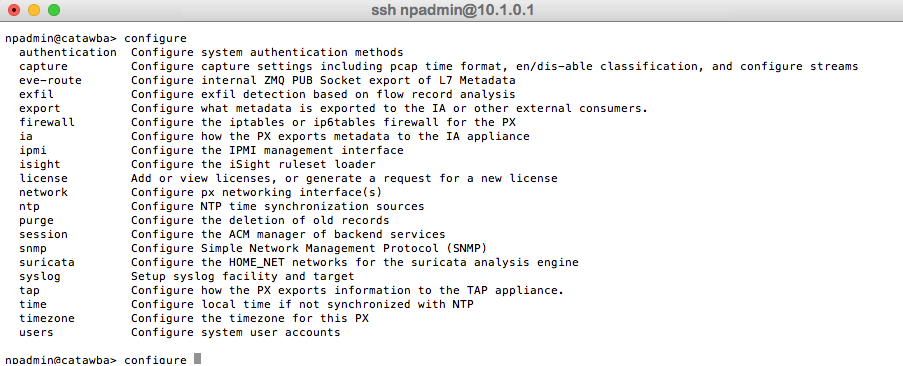
npadmin@catawba> configure
Top-level CLI menu
Enable
Typing >enable lets you access system configuration options. The PX will ask for your password. The default password is hammerhead. To learn more about your options when you issue the >enable command, see Show Commands - Unprivileged Mode.
Note
These commands are in unprivileged mode. A password is required to enable privileged mode. See Show Commands - Unprivileged Mode.
The following table describes the top-level CLI menu options available for the PX Series appliance.
CLI Menu Option | Function |
|---|---|
configure | Make system configuration changes. The PX API also allows you to make system configuration changes. |
exit | Exit from the CLI. |
netcat | Check connectivity to a remote host. |
ping | Send messages to network hosts. The>ping command gives you the option to ping an IP address and send messages to its IPv4 network host, send messages to an IPv6 network host, and provide a string of hostname or IP addresses to ping. |
raid | Adjust the RAID. |
reboot | Halt and perform a cold restart. |
restart | Stop and then restart the PX processes. |
shell | Exit to normal command line. |
show | Show information about the state of the system. |
shutdown | Shut down and halt the PX system. |
sysdump | Dump PX system configuration and statistics to file for debugging. |
traceroute | Print the route packets that are traced to the network host. |
Show command
The top menu-level show commands display system parameters and statistics. The following options are available:
The show disk command displays the filesystem, how much disk space is available, and how much disk space is being used on the PX.
The show hostname command displays the system hostname.
Typing show iostats will display the input/output statistics for devices and partitions on the PX.
Theshow network command displays network information, including IPv4 network assignment,IPv6 network assignment, and IPMI settings.
To get a list of active network connections on the PX, type show ports.
The show processes command displays information about the active processes and the CPU utilization running on the PX.
For RAID status on the controller, volumes, and disks, type the show raid command.
The current PX system time and date will be displayed when you type the show timecommand.
The show uptime command will display how long the PX has been working and available for use.
The version of each core component on the PX is shown when you type show versions.
Selecting show traceroute from the CaptureOS menu lets you discover the path a packet took from your computer to either an IPv4 orIPv6 address.
Capture status
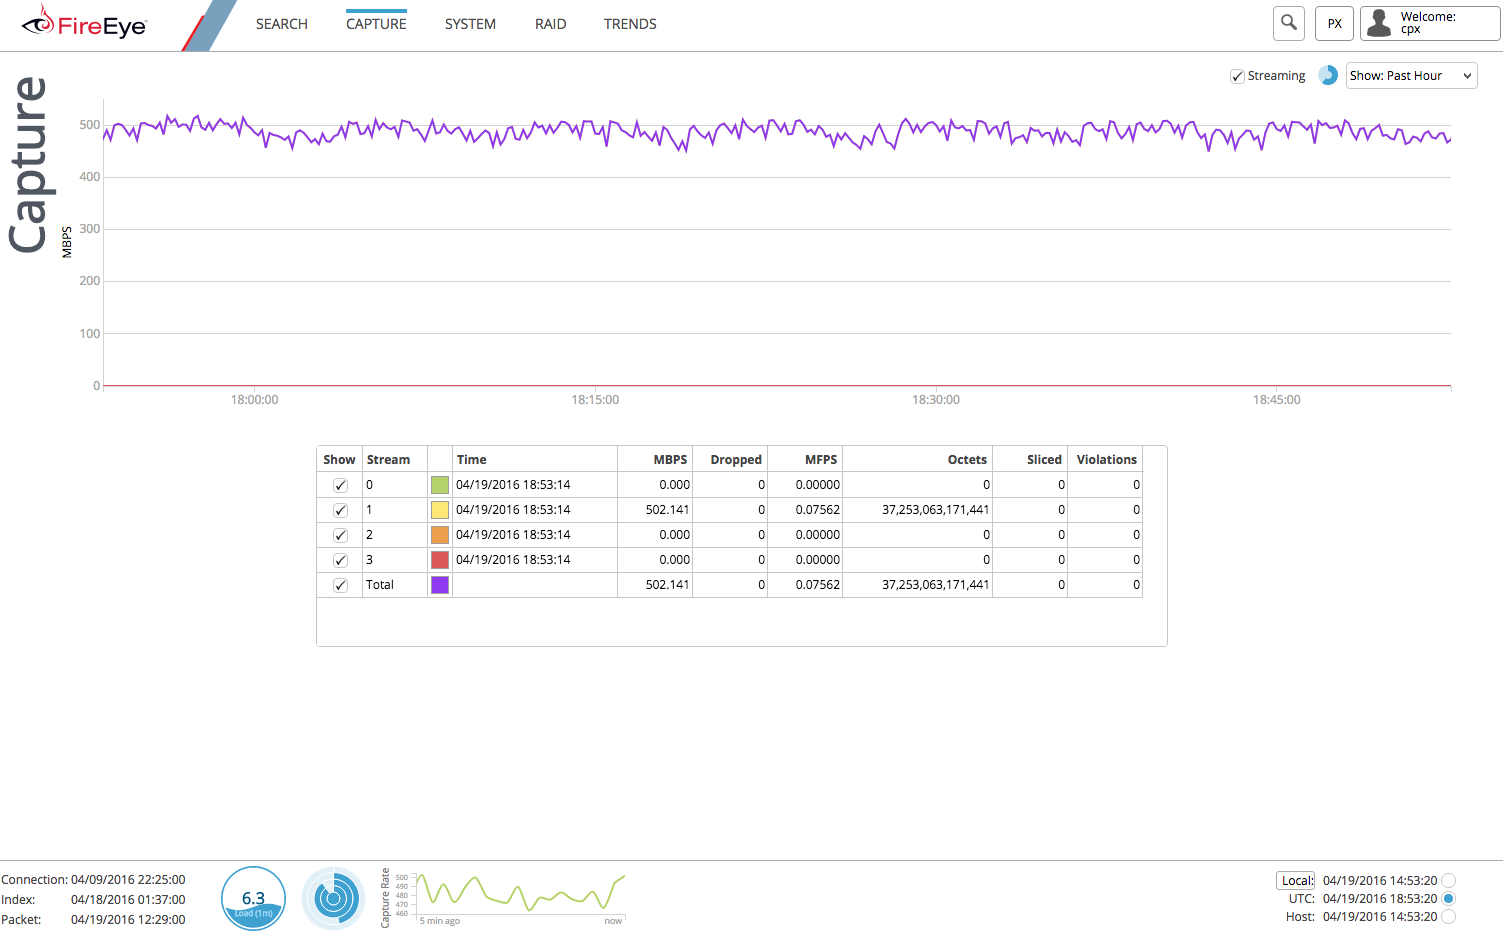
On the PX, you can view graphical and text representations of how the capture process is performing. Select Capture at the top navigation bar.
A large graph in the middle of the page indicates the amount of traffic captured in real time when the Live Streaming box is toggled.
To see if the PX is capturing data:
In the PX Web UI, select Capture in the in the Web UI.
View the streaming capture data to see if the PX is receiving data.
The Capture Status screen shows the bit rate at which the network interfaces are capturing data.
Tip
If the traffic volume for two consecutive hours is less than 50% of the last seven days' average, the following SNMP trap will be sent:
Sending Trap with OID: NPULSE-PX-MIB::traffic2HrRateLessThan7DayAverage and value dictionary: {'NPULSE_PX-MIB::portName.3': {'type': 4, 'value': 'napatech:2'}, 'NPULSE-PX-MIB::traffic2hrRateDropStatus.3': {'type': 2, 'value': 0}}
PX system
This part describes the PX system and more. The following topics are addressed:
System
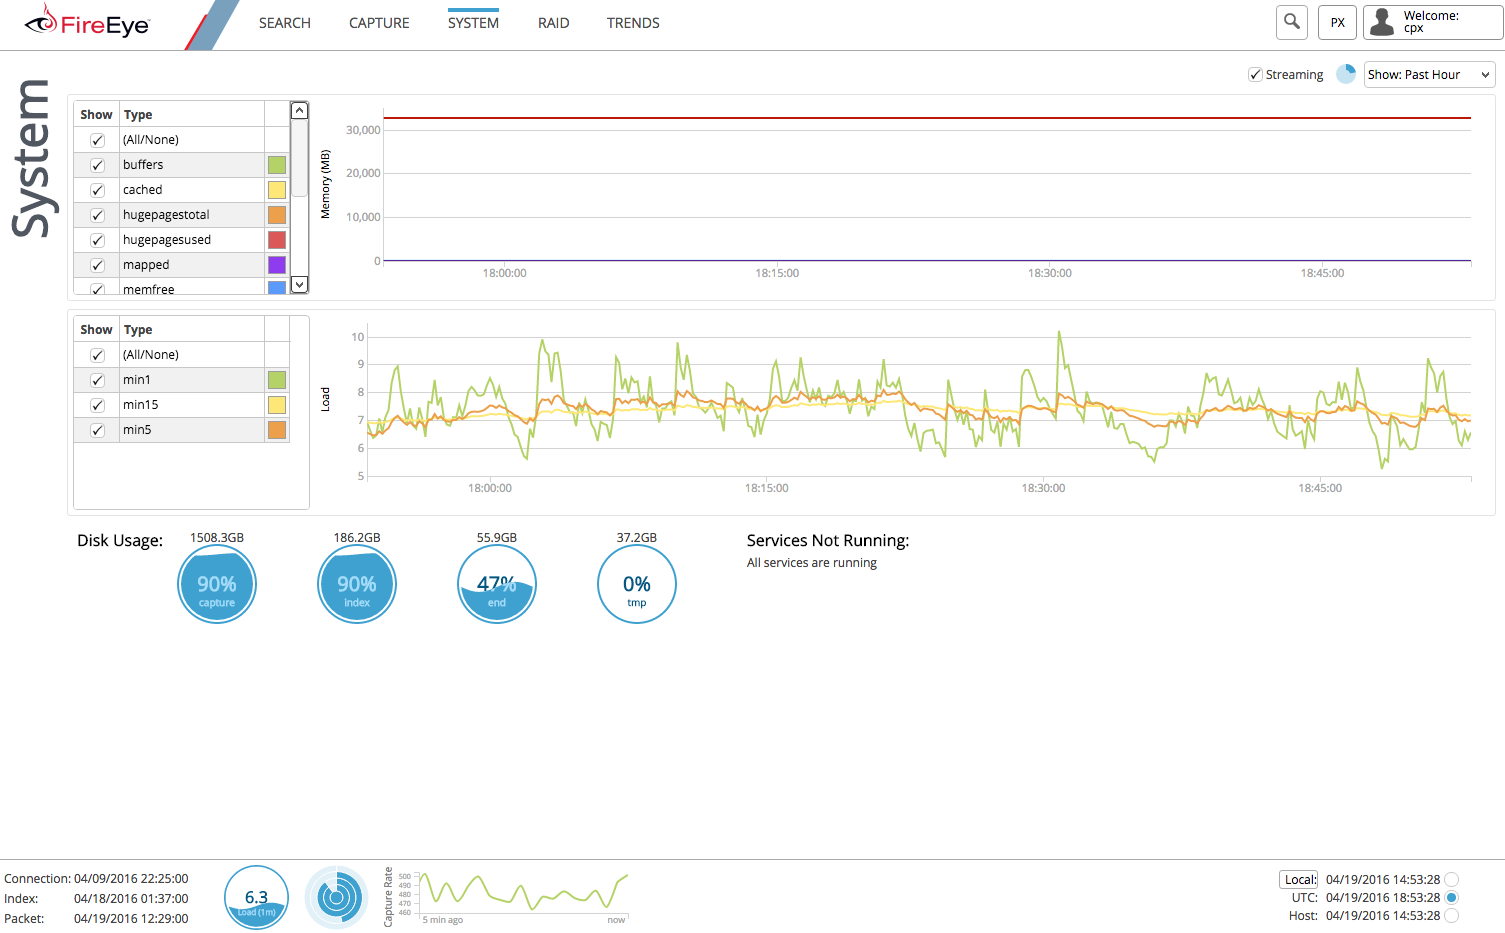
When you select the System menu, you’ll have the choice to view streaming data and disk usage.
Memory graph
On the System page in the Web UI, you can see the system Memory. This shows the amount of total memory (in megabytes), as well as what’s been used and cached, over time.
6 | Preface
Load graph
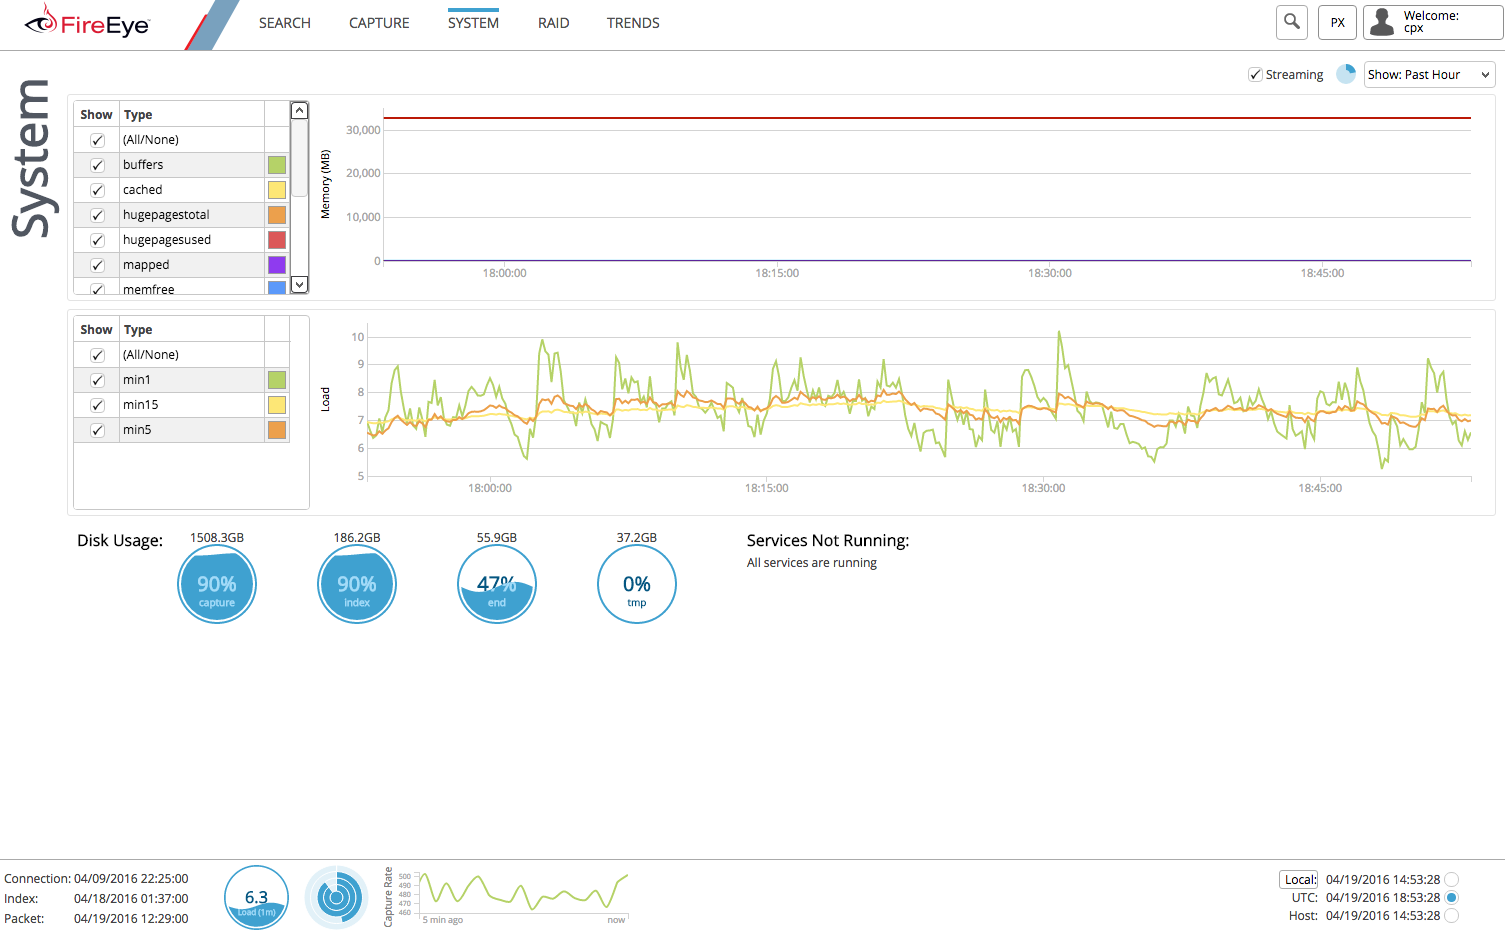
On the System page in the Web UI, the Load graph displays the percent of current resources in use over time. System load should not be above 32 for normal operation.
Stream statistics
You can view the individual stream statistical information on the PX. This enables you to validate that capture operations are performing as expected. By default, all traffic from a capture port is load balanced across two streams. Port 0 traffic would show up across stream 0 and 1, Port 1 traffic would show up across streams 2 and 3, etc. You can track capture speed in Mbps and Mfps, any errors, the size of packets (measured in octets), the number of packets that are “sliced,” or truncated for storage, and any violations. These are labeled per stream and the display begins with Stream 0.
For information on changing the default capture configuration or adding filter rules to capture traffic, please contact Trellix Technical Support ().
Disk usage
On the System screen in the Web UI, the Disk Usage displays the amount available and used of storage space. By default, as disk usage approaches 90% full, the older information will be purged to make room for the newer information.

Trends
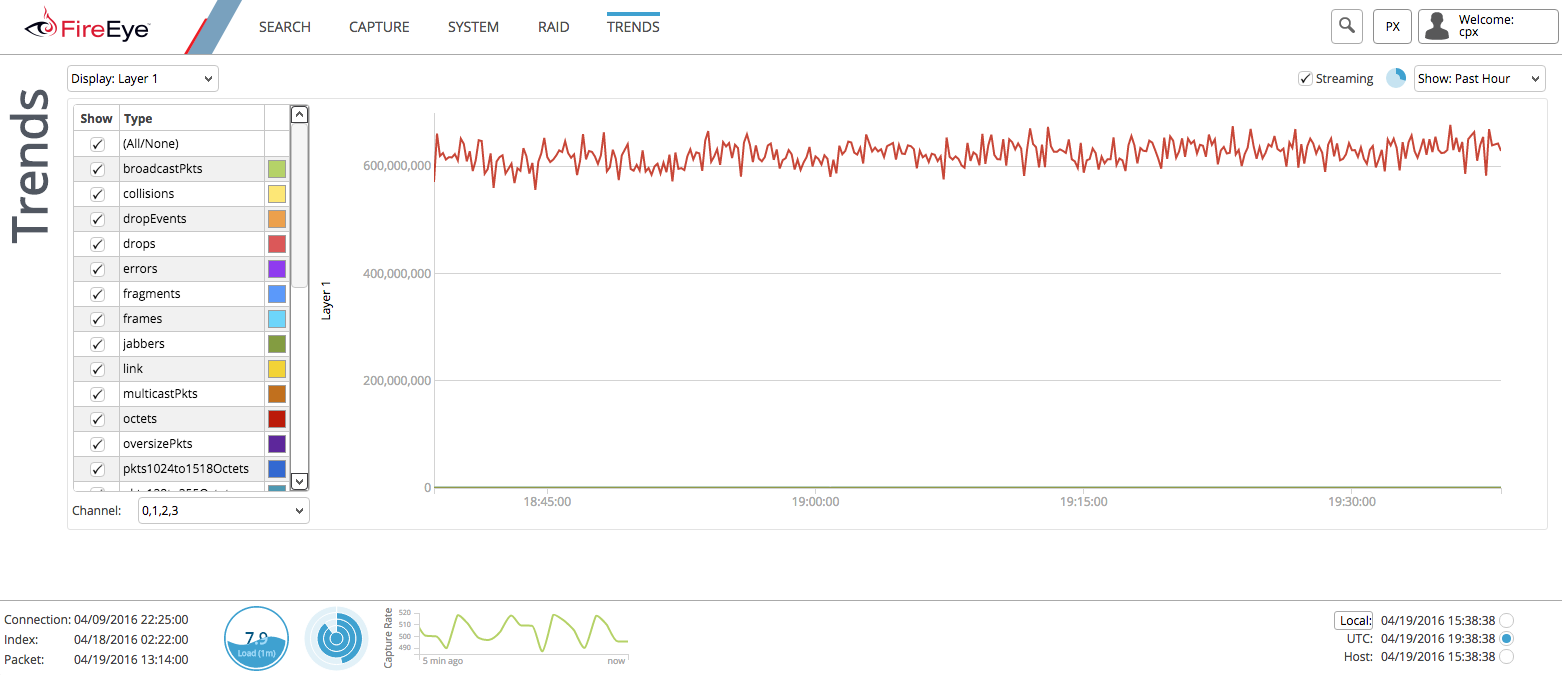
The Trends page displays a breakdown of media statistics and network protocols at the different OSI layers.
The view provides statistics collected on the PX for the past hour, day, week, month, or year. Check boxes on each tab let you toggle which attributes are graphed.
Note
All graphs on the PX are shown in UTC.
Layers 1-4
For layers 1-4 the graph shows transmitted bits and any drops. Drops indicate the memory buffer for that interface was full and frames were not saved in memory.
Flows
Graph of flow records generated per second. Flow records are generated for internal index and, if enabled, will also be exported to remote collectors configured in CaptureOS.
Temperature
Graph of system temperature. Temperature can be displayed in Celsius or Fahrenheit.
Load
Graph of system load in 1-minute, 5-minute, and 15-minute averages.
Memory
Displays a graph of system memory consumption. Statistics shown are Total, Cached, Free, Swapcached and Buffers. The Total statistic shows the total memory installed in the PX.
Cached shows the cached memory consumed. Buffers show the buffered memory consumed. FreeMem shows the total unused memory available on the system.
IOWait
Shows approximately how much time the CPU is waiting on IO (input/output) processes.
Application identification
Below is the list of applications found in the layer 7 data.
AFP
Aimini
Amazon
Apple
AppleiCloud
AppleiTunes
AppleJuice
Armagetron
AVI
Aviva
Ayiya
BattleField
BGP
BitTorrent
CiscoSkinny
CiscoVPN
Citrix
Citrix_Online
CNN
Collectd
Corba
Crossfire
DCE_RPC
DHCP
DHCPV6
DirectConnect
Direct_Download_Link
DNS
Dofus
DropBox
eBay
eDonkey
EGP
EPP
Facebook
FacebookChat
FastTrack
Fiesta
Filetopia
Flash
Florensia
FTP
FTP_CONTROL
FTP_DATA
GMail
Gnutella
Google
GoogleMaps
GRE
GrooveShark
GTP
Guildwars
H323
HalfLife2
HTTP
HTTP_Application_ActiveSync
HTTP_APPLICATION_VEOHTV
HTTP_Connect
HTTP_Proxy
IAX
IceCast
ICMP
ICMPV6
IGMP
IMAP
IMAPS
iMESH
IPP
IPsec
IP_in_IP
IRC
Jabber
Kerberos
Kontiki
LastFM
LDAP
LLMNR
LotusNotes
MapleStory
MDNS
Meebo
Megaco
MGCP
MMS
Move
MPEG
MSN
MsSQL
MySQL
NetBIOS
NetFlix
NFS
NOE
NTP
OggVorbis
OpenFT
OpenVPN
Oracle
Oscar
OSPF
Pandora
Pando_Media_Booster
PcAnywhere
POP
POP3
POPS
PostgreSQL
PPLive
PPStream
PPTP
QQ
QQLive
Quake
QuickTime
Radius
RDP
RealMedia
Redis
RemoteScan
RSYNC
RTCP
RTMP
RTP
RTSP
SAP
SCTP
sFlow
ShoutCast
SIP
SkyFile_PostPaid
SkyFile_PrePaid
SkyFile_Rudics
Skype
SMB
SMTP
SMTPS
SNMP
SOCKS4
SOCKS5
Socrates
Sopcast
Soulseek
Spotify
SSDP
SSH
SSL
SSL_No_Cert
Stealthnet
Steam
STUN
Syslog
TDS
TeamSpeak
TeamViewer
Telegram
Telnet
TFTP
Thunder
TOR
TruPhone
Tuenti
Tvants
TVUplayer
Twitter
UbuntuONE
Unencrypted_Jabber
Unknown
UPnP
Usenet
VEOHTV
VHUA
Viber
VMware
VNC
VRRP
Warcraft3
Webex
WebM
Whois-DAS
WhatsApp
Wikipedia
WindowsMedia
WindowsUpdate
WinMX
WorldOfKungFu
WorldOfWarcraft
Xbox
XDMCP
Yahoo
YouTube
Zattoo
ZeroMQ