Last Updated: March 26, 2026
About the PX series
The PX Series is an integrated solution for ultra-fast recording and indexing of network traffic. It provides a powerful, hardware-accelerated platform for capturing, searching, and analyzing packet and session information. With full disk encryption, you can encrypt all captured data and metadata on disk to ensure that your data is secure if the disk is taken from the appliance.
The multi threaded software is tightly integrated with a high-performance SAS RAID or fiber channel HBA controller that offers sustained PX.
The PX software is built on CentOS. PX uses a Web user interface (Web UI) and provides command-line interface (CLI) access for system administration and for file tasks that are not available through the Web UI.
The PX Web UI
These topics discuss the PX Web UI:
Browser support
The PX web UI menu
PX web UI time details
Logging in to the PX web UI
Browser Support
Use a recent version of one of the following Web browsers to access the Web UI:
Microsoft Edge
Google Chrome
Mozilla Firefox
Opera
Safari
Note
If you are using a Macintosh with certificates in your PX keychain, you cannot use the Safari browser. The will try to use your keychain, but the certificates are not for the server.
The PX Web UI menu
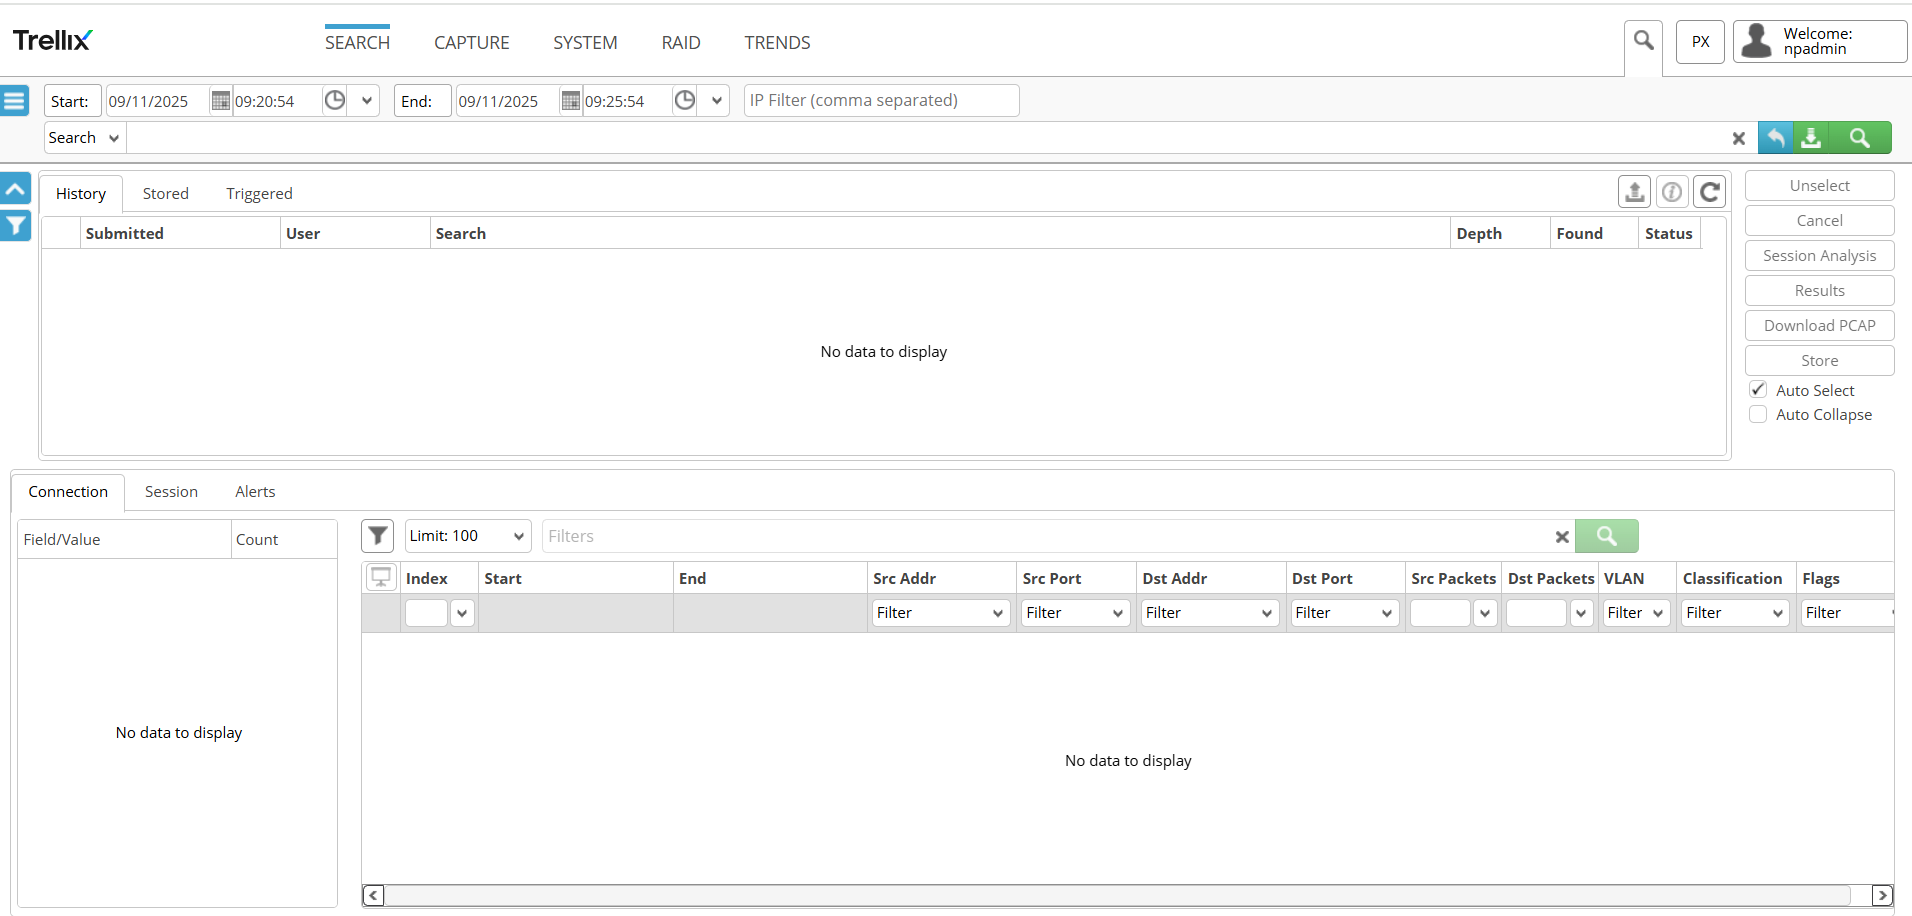
Security analysts use the Web UI interface. In the Web UI, you can apply filters, search network traffic, and perform other network forensic analysis tasks.
Menu | Description |
|---|---|
Search | Search: Start a search based on time (UTC, local, and system time), IP address, filters, limits, and VLAN. History: View the most recent 200 searches based on an event. View connection and packet results, JSON data, and session information. Stored: Displays EBC events that hit on a specific rule and are automatically saved. View connection and packet results, JSON data, and session information. You can also download EBC search results. If the EBC results were not analyzed previously, then you can analyze the session. Triggered: View active searches and searches in the queue. |
Triggered: View active searches and searches in the queue. | |
Capture | Shows the amount of captured data over the last hour, day, week, month or year. |
System | Displays PX appliance status and disk usage. |
RAID | Displays the RAID status for each controller and each physical disk in the array. |
Trends | Shows the statistics collected on the PX for the last hour, day, week, month, or year. Charts for file extraction and export statistics are also displayed on this page. |
PX | Help: Context-sensitive help for the page. About: License and version information. |
PX Web UI Time Details
In the PX Web UI, the user name is displayed in the upper right corner, and these time details appear at the bar at the bottom of each screen:

Time Type | Description |
|---|---|
Connection | The time of the first connection recorded on the appliance. |
Index | The time of the oldest connection packet index recorded on the appliance. |
Packet | The time of the oldest packet stored on the appliance. |
Time Type | Description |
|---|---|
| appliance. |
Local | The current local time derived from the user’s local machine. |
UTC | The current UTC time derived from the user’s local machine. |
PX UTC | The current PX UTC time. |
If no data is sent to the appliance, then Connection, Index, and Packet are UNAVAILABLE.
Note
The current and local UTC times in the PX Web UI are derived from the local Web client and not from the PX appliance.
Logging in to the PX Web UI
The PX Web UI uses the HTTPS secure connection for viewing network traffic and analyzing packet and session information.
To access the PX Web UI, browse to the management port's IP address or hostname using HTTPS. Your PX IP address and hostname are configured at startup. See Initial Configuration for details.
To log in to the Web UI:
Open a Web browser and type
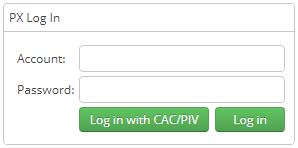
https://appliancein the address line. Replace appliance with the IP address or the appliance hostname. For example, if the configured IP address of the appliance is 10.1.0.1, then typehttps://10.1.0.1.On the login page, type the user name and password.
Select the theme color for the Web UI.
The appliance ships with self-signed SSL certificate and issues a warning the first time that you access the PX. After you see the "Private Computer System" message, click Proceed.
Note
User names and passwords are case sensitive.
Configuration
This part discusses these topics:
Initial configuration
This chapter discusses how to configure the basic network settings for your PX appliance using the CLI.
Important
IMPORTANT: Trellix highly recommends using the CLI to modify your PX appliance configuration settings. Trellix does not provide technical support for configuration changes made using the shell. (DOC-958)(DOC-2876)
End User License Agreement
At the initial appliance startup, review the End User License Agreement (EULA). While the EULA is displayed, you can press q to quit. After reading the EULA, choose an action:
Enter
acceptto accept the agreement and continue.Enter
eulato review the agreement again.Enter
noto halt the system.
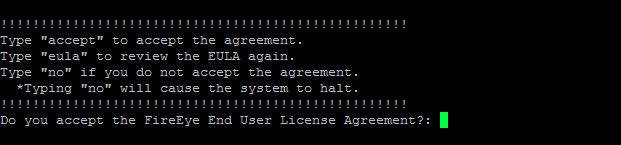
After you enter accept, you can customize the IP addresses, netmask, gateway, DNS settings, and IPMI IP settings.
Important
Restrict IPMI access to trusted internal networks. Restrict traffic from IPMI to a management VLAN segment with strong network controls.
Review and accept your changes. The system reboots and applies your settings.
Network Information Requirements
Network Item | Information Needed |
|---|---|
PX Appliance |
Optional:
|
Domain Name Service (DNS) | IP address of DNS servers |
Network Time Protocol (NTP) Service (Optional) | IP address of NTP servers |
Optional: | To access the appliance remotely using the IPMI.
|
Initial Configuration Procedure
For initial configuration, you need a USB keyboard and a monitor with a VGA connection to the PX.
Note
The PX is shipped with a default password. For security purposes, Trellix recommends changing your password.
Connect the USB keyboard and monitor.
Power up the PX.
Log in to the console with these credentials:
Username: npadmin Password: hammerheadYou can now access the KLISH menu to configure the console.
Enter configure users mode:
npadmin@px> configure usersEnter the password for npadmin:
[sudo] password for npadmin: hammerheadSelect the number that corresponds to the npadmin account.
Select a user by number or an action by letterSelect 3 to change the password.
Enter this information:
Enter current password for npadmin:
Enter new password:
Verify new password:
Note
The new password must meet these criteria:
It must eight characters or more.
It must contain one or more characters from each of these categories:
Uppercase alphabet (A-Z)
Lowercase alphabet (a-z)
Numbers (0-9)
Symbols (!,?,@, etc.)
9. Repeat steps 6 through 8 for the npscp account
Important
Starting in release 5.1.1, the cpx user is not created during firstrun of the PX Series appliance. New appliances shipped with version 5.1.1 or greater will not have cpx users created during firstrun. However, if your appliance was shipped with a version earlier than 5.1.1 and you upgrade to the 5.1.1 release, the existing cpx user on your appliance is not affected.
10. Select s to save and exit.
Time configuration and synchronization
The PX appliance uses Network Time Protocol (NTP) to synchronize the year, month, date, hour, and minutes.
Configuring the time
To configure an NTP server address:
SSH to the PX appliance:
$ ssh npadmin@10.7.7.10
Enter the npadmin password.
Enter configure NTP mode:
npadmin@px#> configure ntpSelect A to add an NTP server address.
Select S to save and exit.
Important
The time sets when you select S to save the update. FireEye recommends that you configure the time setting for the next minute. For example, if it is 2:00, then set your clock for 2:01. When your reference clock reaches the next minute, save the time setting.
If you do not want to synchronize time with an NTP server, then you can configure the local time on your PX appliance.
To configure the time zone using the CLI:
Enter configure time zone mode:
npadmin@px#> configure timezoneEnter the password.
Select the geographic area of your PX appliance, and then press Enter.
Select the city or region time zone of your PX appliance, and then press Enter. The current local time and UTC time appear onscreen.
Current default time zone: 'America/New_York'Local time is now: Fri Feb 16 10:25:10 EST 2017.Universal time is now: Fri Feb 16 15:25:10 UTC 2017.To configure the time and date using the CLI:
Enter configure time mode:
npadmin@px> configure timeSelect a number to change a time or date parameter:
Year:
Month:
Day:
Hour:
Minute:
Second:
Select a time component by number or an action by letter
3. Select X to save your changes and exit.
Time management
You can set the appliance date and time and then use Network Time Protocol (NTP) servers that synchronize the time. You can specify a secondary NTP server for when the primary NTP server is unavailable.
License management
Your license management system depends on your appliance type and the release version shipped with your appliance. If your PX appliance originally shipped with a release earlier than 5.1.0, you use a legacy licensing system. Appliances shipped with release version 5.1.0 or later require DTI-enabled licenses for the following models:
2060ESS120-PX
2060ESS96-PX
2060EXT20-PX
1004S-PX
Caution
If you renew support on your PX appliance or if you receive a replacement appliance through a Returns Materials Authorization (RMA), you will automatically receive a new DTI license from FireEye for your PX. However, the new license cannot be applied to a PX that was not originally manufactured with version 5.1.0 or later, and your existing license is still valid. Ignore the new license if you renew your support or receive a replacement appliance through RMA. For more questions, contact Trellix Customer Support.
This section contains the following:
DTI licensing system
Configuring a license expiry notification
Checking the license
You should be aware of your license information and expiration date. You can check license status through KLISH.
If your PX was manufactured with a version earlier than 5.1.0:
SSH to the PX ntp as npadmin. For example:
$ ssh npadmin@10.7.7.10or
$ ssh npadmin@<FQDN>Enter the npadmin password.
[sudo] password for npadmin: <password>Enter configure license mode:
npadmin@px#> configure licenseSelect 1 to view and manage your legacy license
License information is displayed. For example:
View, request, and upload a license
Issue : Wed Jan 25 14:34:36 EST 2017 Expire : Wed Oct 23 15:34:36 EDT 2019 Version : 4 Features: PX,CAP,SES,L7X
" alt="note icon" style="vertical-align:middle;width:20px;height:20px;margin-right:8px;">Note
The status of your license appears in the upper right corner of the Configure License menu.
5. Select X to exit
For more information on using a legacy PX license, see Legacy licensing system.
If your PX was manufactured with version 5.1.0 or later:
SSH to the PX as npadmin. For example:
$ ssh npadmin@10.7.7.10or
$ ssh npadmin@<FQDN>Enter the npadmin password.
[sudo] password for npadmin: <password>Enter configure
licensemode:npadmin@px#> configure licenseSelect 1 to view all installed DTI licenses.
In the index of licenses, select the license you want to view.
License information is displayed, for example:
feature: FIREEYE_APPLIANCE valid: true start date: 2019/10/31 end date: 2021/10/31 customer id: 90153200 customer name: jane.doe@customer.com
For more information on using a DTI PX license, see DTI licensing keys
Legacy Licensing System
PX appliances that do not come with release version 5.1.0+ installed include a legacy system license. When that license expires, you must install a new one to continue using the appliance. You can generate a license request and upload the new encrypted license key through KLISH.
This section includes the following:
Generating a license request
A license request must be generated by the administrator, and you must work with Trellix Support.
To generate a license request:
SSH to the PX as npadmin. For example:
$ ssh npadmin@10.7.7.10or
$ ssh npadmin@<FQDN>Enter the npadmin password.
[sudo] password for npadmin: <password>
Installing the license key
To upload the legacy license key to the PX appliance:
SSH to the PX as npadmin. For example:
$ ssh npadmin@10.7.7.10or
$ ssh npadmin@<FQDN>Enter the npadmin password.
[sudo] password for npadmin: <password>
DTI licensing system
PX appliances that come with release 5.1.0 or later installed must use the DTI network for license management. For more information about DTI, see The DTI network.
This section includes the following:
About Trellix Licenses
License keys are required for system operation and enabling of certain features.
The PX appliance requires these license keys:
License Key | Description |
|---|---|
FIREEYE_APPLIANCE | Required to register your system and use the product features. |
The following licenses are optional for PX appliances:
License Key | Description |
|---|---|
MD_ACCESS | Allows Trellix products to connect to the Managed Defense VPN. Without this license, Managed Defense cannot manage the server. |
PACKET_CAPTURE | Allows PX to process and store packets extracted from the network interface. |
METADATA_EXPORT | Allows PX to export flow records and other extracted metadata to other appliances. Without this license, you cannot export metadata, but you can search for it on the PX. |
SESSION_ANALYSIS | Allows PX to reconstruct sessions, then analyze and extract metadata from the reconstructed data stream. Without this license, only flow records are available as metadata. |
Manual license installation
If your Packet Capture is not yet connected to the DTI Network, you need to install license keys manually.
You can obtain your license keys from the Assets tab in the Trellix Customer Support Portal or by sending an email that includes the MAC address of your appliance to key_request@fireeye.com.
You can manually install licenses through the CLI:
SSH to the PX as npadmin. For example:
$ ssh npadmin@10.7.7.10or
$ ssh npadmin@<FQDN>
2. Enter the npadmin password.
[sudo] password for npadmin: <password>Automatic license updates
The license update option enables the Packet Capture appliance to initiate a request to automatically download the appropriate licenses from the DTI cloud and install them. This option provides the following benefits:
Simplified license management—There is never a need to contact Trellix for license keys when new features are added or when licenses are renewed, because new licenses are manually downloaded and installed.
Scalability—Organizations with a large number of appliances can benefit from updating them all, at the same time, instead of entering license keys manually on each appliance, one at a time.
Configuring a license expiry notification
By default, the PX appliance sends an SNMP trap message one week before your license expires. You configure when a license expiration SNMP trap is sent in KLISH. License expiry notifications function the same for both legacy and DTI licenses.
To change how far in advance a license expiration notification is sent out:
SSH to the PX as npadmin. For example:
$ ssh npadmin@10.7.7.10or
$ ssh npadmin@<FQDN>
2. Enter the npadmin password.
[sudo] password for npadmin: <password>The DTI network
This section covers the following information:
About the DTI network
Enabling or disabling the appliance to upload data using the configuration menu
About the DTI Network
The Trellix Dynamic Threat Intelligence (DTI) network (cloud) enables subscriber platforms to perform automatic license updates. The Packet Capture appliance can also upload system and diagnostic information to the DTI cloud.
License updates
Licenses need to be installed when a license expires or no longer meets your needs. In addition, replacement licenses need to be installed after a Return Material Authorization (RMA). The automatic license update option enables the Packet Capture appliance to initiate a request to automatically download the appropriate licenses from the DTI cloud and install them. This option provides the following benefits:
Simplified license management—There is never a need to contact Trellix for license keys when new features are added or when licenses are renewed, because new licenses are automatically downloaded and installed.
Scalability—Organizations with a large number of appliances can benefit from updating them all, at the same time, instead of entering license keys manually on each appliance, one at a time.
i
Important
If you do not properly configure the connection between your PX and the DTI Network, you cannot use the automatic license update feature and must manually install licenses. For more information on manual license activation, see Manual license installation.
System health monitoring
When connected to the DTI cloud, the Packet Capture appliance regularly provides system and diagnostic information to the DTI cloud. This information is then analyzed to ensure that the appliance is operating as expected.
The system and diagnostics checks include the following:
System Image Version
System Processes
Hardware State
Network State
If problems are found, the customer will be contacted by Trellix Technical Support.
Note
No customer-specific proprietary information is included in this system and diagnostic information exchange.
About DTI network communication
To communicate with the DTI network, the Packet Capture appliance needs the following information:
DTI server address
DTI network username
DTI network user password
This information is pre-configured on new physical appliances and by an activation code on virtual appliances. Communication with the DTI network is enabled during the initial appliance configuration if default values are accepted.
The appliance sends requests to the DTI network for the services described in the following table.
DTI Service | Description |
|---|---|
Upload destination | The destination for data about system statistics. |
Virtual | The destination for virtual appliance services, such as license token renewals and system entropy information. This service is used by virtual appliances. Marked hidden on 10/15/19 because of comment from Dennis on DOC-2434 |
Validating DTI status
Before using the features associated with the DTI network, you must establish communication between the appliance and the DTI network. Use the following procedure to verify this communication.
Prerequisites
Operator or Admin access
Access to the DTI network
Validating DTI access using the configuration menu
Use the commands in this topic to verify DTI communication.
To validate DTI status:
Enter configuration DTI mode.
npadmin@px> configure dtiEnter the default password for this appliance as provided by your administrator.
[sudo] password for npadmin: <password>Check the status of the DTI service.
npadmin@px> show dti ---------------------------------------------------------- Appliance ID: 0CC47A41048C Username: engtest Server: cloud.fireeye.com:443 Uploads Enabled: true Status: connected to DTI service ----------------------------------------------------------Confirm the following information:
Update source is online.
DTI service is enabled.
DTI service username is the name provided with DTI subscription license.
DTI service address is
cloud.fireeye.com.
Enabling or Disabling DTI Access Using the Configuration Menu
Use the menu options in this section to enable or disable the Packet Capture appliance to upload system statistics to the DTI cloud. Data will be uploaded to the DTI cloud by default.
Prerequisites
Admin access
To enable the appliance to upload data to the DTI cloud:
npadmin@px> configure dti[sudo] password for npadmin: <password>Enter configuration DTI mode.
Enter the default password for this appliance as provided by your administrator.
In the Configure DTI Settings configuration menu, select 1 to enable the appliance to upload system data to the DTI cloud.
Select S to save your settings and exit the menu.
To disable the appliance to upload data to the DTI cloud:
npadmin@px> configure dti[sudo] password for npadmin: <password>Enter configuration DTI mode.
Enter the default password for this appliance as provided by your administrator.
In the Configure DTI Settings configuration menu, select 1 to disable the appliance to upload system data to the DTI cloud.
Select S to save your settings and exit the menu.
Configuring the settings for a DTI server
The PX appliances use the ether1 port to communicate with the DTI network. In the default configuration, where you receive updates from the DTI network (cloud.fireeye.com), allow outbound access to all IP addresses on the HTTPS (TCP/443) port.
Prerequisites
Admin access.
Changing the settings for a DTI server using the configuration menu
Use the menu options in this section to change the DTI server address and port.
To change the DTI server settings:
Enter configuration DTI mode.
npadmin@px> configure dtiEnter the default password for this appliance as provided by your administrator.
[sudo] password for npadmin: <password>In the Configure DTI Settings configuration menu, select 2 to access the Configure DTI Address Setting menu.
================================================================== = DTI Address Config DTI Address ================================================================== Configure DTI Address Setting 1. DTI Address [cloud.fireeye.com] 2. DTI Port [0]
Configuring DTI Credentials
Virtual appliances have appliance-specific DTI credentials that are generated from the appliance's activation code and that cannot be changed. Physical appliances have factory-configured DTI credentials that should not be changed.
Prerequisites
Admin access
Configuring DTI credentials using the configuration menu
Use the menu options in this section to configure DTI username and password.
To configure DTI credentials:
Enter configuration DTI mode.
npadmin@px> configure dtiEnter the default password for this appliance as provided by your administrator.
[sudo] password for npadmin: <password>In the
Configure DTI Settingsconfiguration menu, select3to access theConfigure DTI Credentialsmenu. Press Enter.===================================================================== = DTI Credentials Config DTI Credentials ===================================================================== Configure DTI Credentials 1. DTI Username [engtest] 2. DTI Password [********]
Select
1to enter the username. Press Enter.Select
2to enter the password. Press Enter.Select
Sto save your settings and exit the menu.
Configuring the connection timeout using the configuration menu
Use the menu options in this topic to configure the connection timeout setting from the PX appliance to the DTI cloud. If the timeout value is reached when the PX appliance is enabled to upload system information to the DTI cloud, you must change the connection timeout setting. A warning is not displayed when the connection to the DTI cloud failed
Prerequisites
Admin access
To configure the connection timeout to the DTI cloud:
Enter configuration DTI mode.
npadmin@px> configure dtiEnter the default password for this appliance as provided by your administrator.
[sudo] password for npadmin: <password>In the
Configure DTI Settingsconfiguration menu, select5to set the connection timeout.Change the connection timeout and press Enter. The timeout value is in seconds. The range is from 1 to 3600 seconds. The default value is 600 seconds.
Select S to save your settings and exit the menu.
Specifying the DTI activation code
You can specify the DTI activation code that should be used on virtual appliances only. Virtual appliances have appliance-specific DTI credentials (username and password) and other DTI network information that are automatically generated from the appliance's activation code and that cannot be changed.
Prerequisites
Admin access
Specifying the DTI activation code using the configuration menu
Use the menu options in this section to specify the DTI activation code that should be used on virtual appliances only.
To specify the DTI activation code:
Enter configuration DTI mode.
npadmin@px> configure dtiEnter the default password for this appliance as provided by your administrator.
[sudo] password for npadmin: <password>In the Configure DTI Settings configuration menu, select 6 to apply the DTI activation code. Press Enter.
================================================================ = Apply Activation Code ================================================================ Enter or paste the code belowPaste the activation code you obtained from Trellix into the text field of the PX appliance configuration menu. Press Enter.
Select S to save your settings and exit the menu.
Sharing system data
The PX appliance can share system data with the DTI cloud. No customer-specific proprietary information is exchanged.
Prerequisites
Admin access
About Sharing System Data With the DTI Cloud
The Packet Capture appliances automatically push system data to the Dynamic Threat Intelligence (DTI) cloud.
Note
The Packet Capture appliance uploads information using a secure (HTTPS) connection to
cloud.fireeye.com.
No customer-specific or proprietary information is exchanged. Real-time system statistics are shared between the appliance and the DTI cloud.
Real-Time Statistics
The following real-time statistics are uploaded to the DTI cloud:
License information—Status of the FireEye licenses on the device.
Appliance health—Environmental information relating to all components such as fans and hard disk drive with System Activity Report data.
Traffic Measurements—Traffic throughput statistics and capacity monitoring.
Statistics of critical sub-systems capacity—Interface status, packet counts, number of flows, broken or asymmetric flows, binaries, packet loss, protocol-based stats, memory usage, and kernel-level information.
Information That Is Not Uploaded to the DTI Cloud
The following information is NOT uploaded to the DTI cloud:
Customer-specific information
Proprietary information
Packet captures
Benefits of Sharing Data With the DTI Cloud
Uploading data to the DTI cloud allows the Trellix Customer Support team to provide you with proactive operational monitoring and support. This monitoring and support includes the identification of targeted attacks.
Note
You are not required to upload data in order to receive the benefits of the DTI cloud.
Uploading System Data Automatically Using the Configuration Menu
Use the menu options in this topic to specify how often the Packet Capture appliance uploads system information to the DTI cloud. No customer-specific or proprietary information is exchanged.
To configure automatic system information updates:
[sudo] password for npadmin: <password>Enter configuration DTI mode.
npadmin@px> configure dtiEnter the default password for this appliance as provided by your administrator.
In the Configure DTI Settings configuration menu, select 4 to set the automatic update schedule.
Set the hourly frequency when the update is triggered and press Enter. The range is from 1 to 24 hours. The default value is 3 hours.
Select S to save your settings and exit the menu.
Configuring and managing user roles
This section describes the access rights associated with user account types and how to configure and manage user accounts using the PX appliance CLI.
User account roles
Each role contains permissions that enable users to perform certain operations in the PX appliance. Roles give system administrators control over which actions users can perform. Each user account has one or multiple roles. For example, by default, only users with the admin role can add and remove users.
PX Appliance Roles
PX Role | Expected Use Case | Description |
|---|---|---|
uiapi | User | Allows access to the UI and the API. Direct access to the API using a utility such as cURL is allowed. This user is not allowed to log in directly to access the CLI menu system, and access to restricted commands such as configuration changes is not allowed. This group is recommended for most users who will have access to the captured and extracted data but not to the underlying operation of the appliance. |
klish | Manager | Allows access the appliance through the the CLI menu system. Access to restricted commands such as configuration changes is not allowed. Membership in this group does not provide access to the UI or API and prevents access to the capture and extracted data. This group is recommended for users monitoring the health of the appliance. |
sudo | Administrator | Allows access to the UI, API, and restricted commands. Shell access is provided for complete control of the system. |
Configure user accounts
You can add a user account using the appliance CLI.
To configure a user account:
Log in to the console.
Enter configure users mode:
npadmin@px> configure users Add, delete, and edit local users Select a user by number or an action by letter. A - Add X - Exit menuThis menu appears:
Select A to add a user.
Enter the user name:
User:Enter the user real name:
Real Name:Enter the user access group:
Groups:uiapi
Y/n
klish
Y/n
wheel
Y/n
Enter a new user password, and then reenter the password to verify it:
Password: Verify password:
Management interface settings
Management interface configuration settings:
IP Version: The management interface can communicate with Internet Protocol version 4 (IPv4) addresses, Internet Protocol version 6 (IPv6) addresses, or both.
IP Address: The IPv4 and IPv6 address of the management interface. You can configure both types of addresses.
Subnet Mask: The network portion of the IP address. For example, 255.255.255.0 indicates that the first 24 bits of an IPv4 address are used for the network portion of the address.
Default Gateway: For an IPv4 address, the IPv4 address of the default router. For an IPv6 address, the IPv6 address of the default router or next-hop device.
Selecting an authentication method using the CLI
By default, the PX uses PAM authentication. You can select a different authentication method using the CLI configure authentication menu.
Note
RADIUS/TACACS+ authentication is supported when a "dummy" user account is present in
/etc/passwdand in/etc/group. This behavior facilitates authorization for all access (Web UI, CLI, and REST API).
To modify the authentication for user logins:
SSH to the PX as
npadmin.
For example:$ ssh npadmin@10.7.7.1Enter the
npadminpassword.Enter the
configure authenticationmenu:npadmin@hostname#> configure authenticationSelect 1 to select an authentication type (PAM, LDAP, RADIUS, TACACS+, or Active Directory), and then enter the number of your selection.
Select
sto save and exit.
After you select an authentication method, you must configure the PX to properly connect to the selected authentication server.
This section includes the following:
Configuring a dummy user
You can add a dummy user using the PX appliance CLI.
Note
Configuring a dummy user is also possible via API.
To configure a dummy user:
= Users
Add, delete, and edit local users
Select a user by number or an action by letter.
A - Add
X - Exit menu
Real Name:
Groups:uiapi | Y/n |
klish | Y/n |
wheel | Y/n |
Remote user | Y/n: Y |
Log in to the console.
Enter configure users mode:
npadmin@px> configure usersThis menu appears:
Select A to add a user.
Enter the user name:
User:
Enter the user real name:
Enter the user access group:
You see the following:
=====================================================
= Users Page 1 / 1
=====================================================
Add, delete, and edit local users
1. npadmin [wheel,klish,uiapi]
2. cpx cpx [uiapi]
3. npscp [klish]
4. dummy1 Dummy One [uiapi]
Select a user by number or an action by letter
A - Add |
|
|
X - Exit menu |
>9. Type x to exit.
Configuring radius authentication
To configure RADIUS:
Note
Only IP addresses are permitted for RADIUS servers. DNS hostnames are not supported.
SSH to the PX as npadmin.
For example:
$ ssh npadmin@10.7.7.1Enter the npadmin password.
Enter the configure authentication menu:
npadmin@hostname#> configure authenticationSelect N to access page 2 of the authentication menu.
Select 1 to access the RADIUS server menu.
Select 1 to enter a space-separated list of RADIUS server addresses.
Select 2 to access the RADIUS secret menu.
Enter a value between 1 and 255 for length.
Minimum length: 1, Maximum length: 255 Enter value [<cancel>] >Type S to save and exit.
Configuring TACACS+ Authentication
To configure TACACS+Authentication:
Note
Only IP addresses are permitted for TACACS+servers. DNS hostnames are not supported.
RADIUS/TACACS+ authentication is supported when a "dummy" user account is present in /etc/passwd and in /etc/group.
This behavior facilitates authorization for all access (WebUI, KLISH, and REST API).
SSH to the PX as npadmin.
For example: $ ssh npadmin@10.7.7.1Enter the npadmin password.
Enter the configure authentication menu:
npadmin@hostname#> configure authenticationSelect N to access page 2 of the authentication menu.
Select 3 to access the TACACS+ server menu.
Select 1 to enter a space-separated list of TACACS+ server addresses.
Press 2 to access the secret TACACS+ menu.
Enter a value between 1 and 255 for length.
Minimum length: 1, Maximum length: 255 Enter value [<cancel>]Press S to save and exit.
Configuring LDAP authentication
Note
PX LDAP Authentication requires the LDAP Server to use the RFC 2307 NIS schema including posixGroup groups with the gidNumber attribute.
LDAP Configuration are listed in 3 pages. It is only applicable till the 3rd step of page 2. Rest of the options are appropriate for different authentication types.
To configure LDAP:
Press 1 to enter the Authentication Type
Press 2 to enter the LDAP Encryption Type.
Press 3 to enter the LDAP Host.
Press 4 to enter the LDAP Group Base DN.
Press 5 to enter the LDAP User Base DN.
Press 6 to enter the LDAP Bind DN.
Press 7 to enter LDAP Bind PW.
SSH to the PX as npadmin.
For example: $ ssh npadmin@10.7.7.1Enter the npadmin password.
Enter the configure authentication menu:
npadmin@hostname#> configure authenticationLDAP configuration settings are listed:
Select N to continue to page 2 of the LDAP Configuration menu.
Select 1 to enter the LDAP/AD UIAPI Group.
Select 2 to enter the LDAP/AD Sudo Group.
Select 3 to enter theLDAP/AD Klish Group.
Press x to save and exit.
Configuring Active Directory (AD) authentication
The PX appliance can authenticate users through an AD server.
Important
This document assumes some familiarity with Microsoft Active Directory Domain Services. For more detailed information, see the Microsoft Active Directory Domain Services documentation online or contact your Active Directory administrator.
What you need:
MS Active Directory version 2003 or newer
Information about the AD server, including:
Resolvable hostname or IP address
The port used by the server for authentication requests
Type of encryption (none, STARTTLS, or SSL) to use when communicating with the directory server
The distinguished name (DN) of a user that can search the directory (commonly called a “bind DN”)
The base DN to use when performing LDAP queries
Select Active Directory as the authentication method. See Selecting An Authentication Method Using the CLI for more information.
Enter the type of encryption used during authentication.
Enter identifying information about the AD server(s).
Enter information about the LDAP user search base.
Enter information about the LDAP user credentials.
Enter information about the AD group that will map to the PX UIAPI, Administrative, and Monitor roles.
Enter information about the AD Domain Security Identifier (SID).
To configure AD authentication:
SSH to the PX as npadmin. For example:
$ ssh npadmin@10.7.7.10
or
$ ssh npadmin@<FQDN>2. Enter the npadmin password.
[sudo] password for npadmin: <password>The following table shows the access permissions available for each role:
Role-based access control to allow fine-grained access to the AD users
AD User | UI API Group | Sudo Group | Clish Group | Access Allowed |
|---|---|---|---|---|
NOC_SVC | Yes | No | No | The customer can access the Web UI and run API calls. |
NOC-USER01 | Yes | No | Yes | Same access as NOC_SVC, plus ability to connect to the appliance via SSH and view the configuration using the CLI. |
SOC01 | Yes | Yes | No | Full Web UI/API access including the ability to modify configuration via the API. |
Full Admin | Yes | Yes | Yes | FireEye Admin with full privilege. |
Admin | No | Yes | Yes | Full access to view and change the configuration via the CLI as well as a root shell. |
AD User | UI API Group | Sudo Group | Clish Group | Access Allowed |
|---|---|---|---|---|
User_New | No | No | Yes | Access to the appliance via SSH and permission to view the configuration and some health statistics. |
User01 | No | Yes | No | No access is granted for this configuration. |
Configuring SAML authentication
You can enable SAML authentication on your Packet Capture appliance (service provider) so that remote users are authenticated by a SAML server (identity provider), before the users can access the Packet Capture Web UI.
Prerequisites:
Access to the SAML server
Configure the SAML server for Packet Capture application
To configure SAML authentication on your Packet Capture appliance:
SSH to the PX as npadmin.
For example: $ ssh npadmin@10.7.7.1Enter the npadmin password.
Enter the SAML configuration menu:
npadmin@hostname#> configure samlEnter the npadmin password.
The SAML Config menu is displayed.
= SAML Config===========================================
Configure SAML Authentication
1. State [disabled]
2. Attribute for username []
3. IDP metadata
4. Download SP metadata
5. TLS settings
6. Reject users with roles []
Select a menu choice by number or an action by letter
|
|
|
X - Exit menu |
>
5. Press 1 to change the state of the SAML authentication to one of the following supported states:
disabled: This mode allows the users to authenticate only though PX. This is the default mode.
allowed: This mode allows the users to authenticate either through PX or SAML.
required: This mode allows the users to authenticate only through SAML.
required-force: This mode automatically redirects the users to the SAML authentication page. As long as the IDP session remains active, you cannot log out of your PX appliance.
6. Press 2 to set the attribute for the user name. Select a letter corresponding to the action you wish to perform.
The user name attribute is used to get the username of the logged-in user. By default, the username is read from the NameID attribute.
7. Press 3 to configure the IDP metadata settings for SAML authentication:
To download the IDP metadata file to your Packet Capture appliance, press 1 and enter the metadata fetch URL at the prompt.
You need to get this URL from the SAML server configuration settings.
(Optional) To upload the IDP metadata file to your Packet Capture appliance, press 3 and enter the filename of the IDP metadata file that you downloaded and is made available in the transfer directory.
To set the IDP connection timeout, press 2.
8. Press 4 to download the SP metadata file to the transfer directory. Use SCP to copy the SP metadata file to your Packet Capture appliance.
You need to upload this XML file to the SAML server.
9. (Optional) You can also download the SP metadata file using the following URL: https://px-url/saml/metadata.
Press 5 to configure the TLS settings for IDP connection for metadata download.
These TLS settings are used only while downloading the IDP metadata and these validate the SSL certificate of the IDP while connecting to it.
Press 6 to specify roles to restrict SAML authentication for users with specified roles.
Press A to add the roles.
Specify the user role.
The only relevant role you can specify is wheel.
Press S to save the changes and exit.
Post-requisite: Configure the attributes for the users in the SAML server. We have the following roles: "appliance.role", "px.role" and "ia.role". The "appliance.role" can be used if the roles for a user are the same for both IA and PX. The "px.role" provides a finer role assignment for a PX appliance. The possible values for these attributes are "uiapi" and "wheel".
A user will now see a SAML option in the login screen. When a user clicks Login with SAML, the sign-in screen of the SAML server is displayed, where the user needs to enter the SAML account credentials to access the Packet Capture Web UI.
Performing disk-mirroring
Trellix x600 appliances ship with a secondary SSD installed, which enables you to have a more streamlined disaster-recovery plan. You can perform disk-mirroring using the CLI to mirror files present on the primary SSD to the secondary SSD. Disk-mirroring enables you to use the secondary SSD as a fallback operating system drive.
If you opt to mirror the disks during the first-run, the entire primary disk will be copied to the secondary SSD. After the initial copy, you should be able to boot the appliance through the secondary disk by changing the BIOS boot order. Disk-mirroring is not done automatically at any point.
To mirror disks using the CLI:
SSH to the PX as npadmin:
$ ssh npadmin@hostnameEnter the npadmin password.
To mirror disks at any point of time:
hostname # storage mirror-diskPress y to confirm the mirroring of the primary SSD to the secondary SSD.
Press y to acknowledge disk-mirroring wipes the data on the secondary SSD.
Managing custom rule sets
You can upload custom Suricata rule sets using the Packet Capture API. For details on the endpoints available, see the Packet Capture API Guide. After you upload a rule set through the API, you can configure the rule set using the CLI. You can not add new attributes to the rule set in KLISH, but you can delete attributes. You can only configure attributes you have already added using the API.
Configure a custom rule set
To configure a custom rule set:
SSH to the PX as npadmin. For example:
$ ssh npadmin@10.7.7.10or
$ ssh npadmin@<FQDN>Enter the npadmin password.
[sudo] password for npadmin: <password>Open the Rulesets menu:
npadmin@hostname > configure rulesetsEnter the npadmin password.
Select the ruleset you want to configure.
A list of rule set attributes and their current configurations appears.
Select the number of the attribute you want to edit.
Press S to save your changes and exit the menu.
To delete a custom rule set attribute:
In the Rulesets menu, press D.
Select the ruleset attribute you want to delete.
Configure an emerging threats open rule set
You can also configure emerging threats open rule set in Suricata and update them periodically in KLISH.
To configure an emerging threats open rule set:
SSH to the PX as npadmin. For example:
$ ssh npadmin@10.7.7.10or
$ ssh npadmin<FQDN>Open the Emerging threats open rule set menu.
configure emerging threats rulesA list of rule set attributes and their current configurations appears.
Select the rule set you want to configure.
Modify the selected ruleset.
Press s to save your changes and exit the menu.
Press x to exit the menu.
Administration
This part discusses these topics:
Administration
This part covers the following topics:
Prerequisites
Configuring the Hostname
Configuring the DNS name server
Configuring the NTP time server
Configuring the DNS search domain
Configuring the IP network parameters
Configuring capture ports
Configuring data exfiltration detection
Testing connectivity
Configuring the IPMI interface
Configuring the firewall
Configuring packet filters with intelligent capture
Configuring metadata export over HTTP
Enabling full disk encryption
Backing up PX system configuration
Restoring PX system configuration
Resetting npadmin and npscp passwords
Prerequisite
Admin access
Configuring the DNS name server
To configure the DNS name server:
Note
Before using a fully qualified domain name (FQDN) for any configuration setting, you must first configure a DNS server.
SSH to the PX as npadmin. For example:
$ ssh npadmin@10.7.7.10or
$ ssh npadmin@<FQDN>Enter the npadmin password.
[sudo] password for npadmin: <password>Enter configure network mode:
npadmin@hostname> configure networkType the npadmin password.
Press N for next.
Select 1 to configure DNS name servers.
Select A to add a DNS server address.
At the prompt, type a DNS name server address, and then press Enter.
Type X to save your settings and exit.
Caution
You must not add more than three DNS server addresses to your Packet Capture.
Configuring the NTP time server
To configure the NTP time server:
SSH to the PX as npadmin. For example:
$ ssh npadmin@10.7.7.10or
$ ssh npadmin@<FQDN>Enter the npadmin password.
[sudo] password for npadmin: <password>Enter configure network mode:
npadmin@hostname> configure ntpSelect A to add an NTP server address.
At the prompt, type an NTP server address, and then press Enter.
Select X to save your settings and exit.
Configuring the NTP authentication
NTP authentication enables the Packet Capture appliance to check whether an NTP server can be trusted before synchronizing the PX appliance's time with that of the NTP server.
To configure the NTP authentication:
SSH to the PX as npadmin. For example:
$ ssh npadmin@10.7.7.10or
$ ssh npadmin@<FQDN>Enter the npadmin password.
[sudo] password for npadmin: <password>
Press 1 to configure an authentication-enabled NTP server on the network.
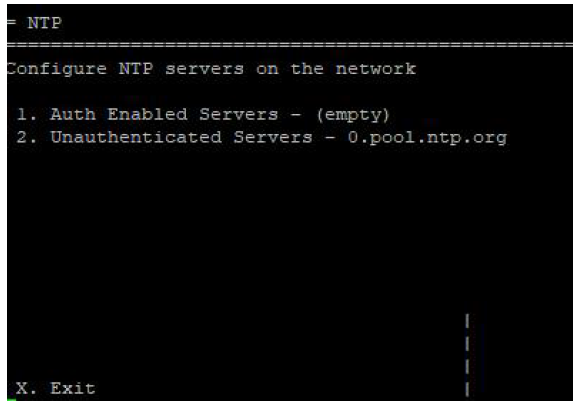
4. Specify the following details to configure an authenticated NTP server in the Configure Authenticated NTP Servers menu:
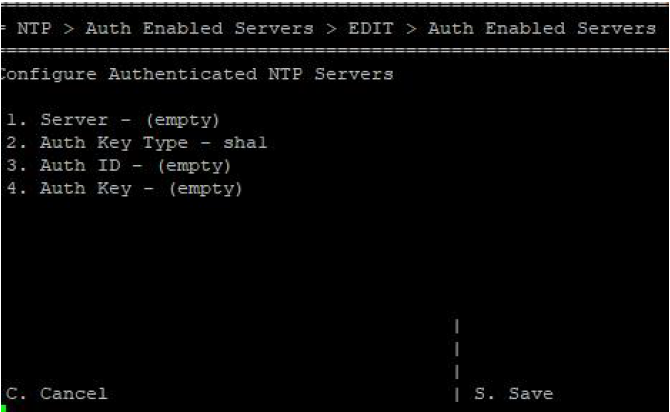
Press 1 to add an NTP server.
At the prompt, type an NTP server IP address, and then press Enter.
Press 2 to select the Authentication Key Type.
You can choose SHA1 or MD5. Press 2 to toggle between SHA1 and MD5.
Press 3 to enter the Auth ID.
Auth ID specifies the numeric key ID to authenticate the NTP packets (received from the NTP server) by the Packet Capture appliance. The NTP server administrator provides the Authentication ID.
After configuring all the settings, press S to save.
The Packet Capture appliance establishes the connection with the NTP server.
To verify the NTP authentication status of the Packet Capture appliance, run the following command from shell:
[root@px44-100 npadmin]# ntpq -c as
The value displayed in the auth column specifies the NTP authentication status. The following table describes each auth value:
Auth Value | NTP Authentication Status |
|---|---|
none | Disabled |
ok | Enabled; connection with the NTP server is active |
bad | Configured NTP-authentication credentials are invalid |
Configuring the DNS search domain
To configure the DNS search domain:
SSH to the PX as npadmin. For example:
$ ssh npadmin@10.7.7.10or
$ ssh npadmin@<FQDN>
Enter the npadmin password.
[sudo] password for npadmin: <password>Enter configure network mode:
npadmin@hostname> configure networkType the npadmin password.
Select 2 to configure DNS search domains.
Select A to add a network domain.
At the prompt, type a search domain, and then press Enter.
Select x to save your settings and exit.
Configuring IP network parameters
To configure IP network parameters:
SSH to the PX as npadmin. For example:
$ ssh npadmin@10.7.7.10or
$ ssh npadmin<@FQDN>Enter the npadmin password.
[sudo] password for npadmin: <password>Enter configure network mode:
npadmin@hostname> configure networkSelect 4 to configure the IPv4 gateway.
Select 5 to configure the IPv6 gateway.
Select type to configure the
eth0IP address.Select type to configure the
eth1IP address.Type x to save your settings and exit.
Configuring capture ports
By default, all available capture ports on the Packet Capture appliance are enabled for capturing network traffic. You can disable the use of any capture port and configure other elements of network traffic capture in the CLI.
To configure capture ports:
SSH to the PX as npadmin. For example:
$ ssh npadmin@10.7.7.10or
$ ssh npadmin@<FQDN>Enter the npadmin password.
[sudo] password for npadmin: <password>Enter configure px-capture mode.
npadmin@hostname> configure captureConfigure the capture port settings.
Press 1 to switch the time format from nanoseconds to microseconds when capturing network traffic.
Press 2 to disable Capture Stream 0.
Press 3 to disable Capture Stream 1.
Press 4 to disable Capture Stream 2.
Press 5 to disable Capture Stream 3.
Press 6 to enter a Virtual eXtensible Local Area Network Identifier (VNID).
Press 7 to disable nDPI classification of flow records. By default, nDPI classification is enabled to organize flow records using a deep packet inspection library. For more information, see the ntop nDPI User's Guides online.
Press N to view the next page.
In the second page of capture port settings, press 1 to enable tunnel decoding
Press S to save your changes.
Configuring PCAP compression
You can configure PX appliance to store PCAPs in a compressed format. This reduces the storage cost, allows you to store large amounts of data, and improves the performance of the PX appliance. You can also switch between the compressed approach and the non-compressed(traditional) approach at any time.
To configure PCAP compression:
SSH to the PX as npadmin. For example:
$ ssh npadmin@10.7.7.10or
$ ssh npadmin@<FQDN>Enter the npadmin password.
[sudo] password for npadmin: <password>Enter configure PX-capture mode.
npadmin@hostname> configure captureType N to view the next page.
Type 2 to enable PCAP Compression.
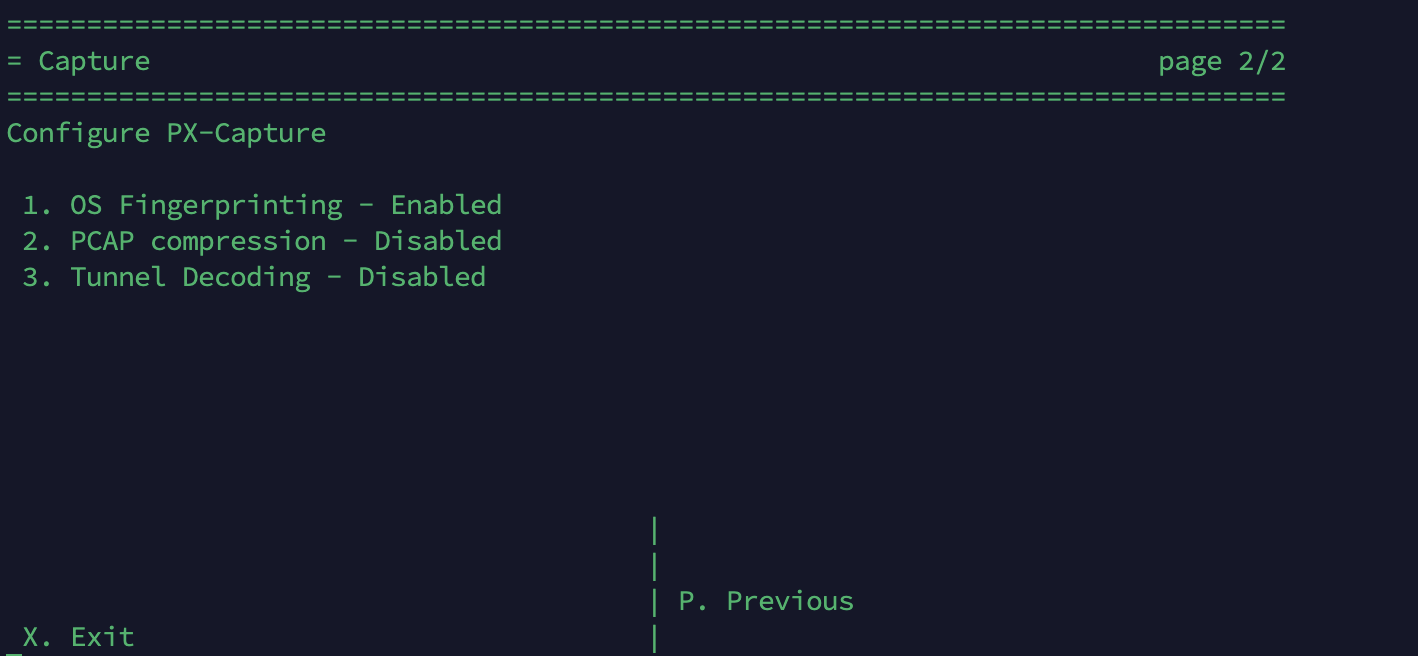
Type S to save the configuration.
If you want to disable PCAP Compression type 2 and then type S to save the configuration.
Configuring data exfiltration detection
Data theft is usually the last stage in the attacker life cycle. Generally, an attacker breaks into a computer network with the goal of stealing data. This is often referred to as “data exfiltration”, or in the context of the attack life cycle, “completing the mission.” Assuming the attacker does not have physical access to the victim’s infrastructure there are generally two ways data will leave a network.
Data is uploaded to attacked-controlled or shared infrastructure. Often times in this case, the data is chunked into uniform blocks. In this situation, the attacker's implant will connect out from victim infrastructure to attacker infrastructure (outbound) and upload the data.
Data is staged on a victim's existing infrastructure such as HTTP and FTP servers. The attacker will then just download the data. In this situation, the attacker will connect into the victim's infrastructure (inbound).
The Packet Capture has two methods to identify data extraction patterns in your network that indicate a possible malicious data exfiltration attack.
You can enable and disable exfiltration detection and configure your home network IP addresses through the configure exfil KLISH command. For more information, see Configuring Data Exfiltration Detection Through the CLI.
You can also manage data exfiltration detection by writing and uploading Suricata rule sets through the API. Suricata rule sets must include the HOME_NET and EXTERNAL_NET variables. You can configure the HOME_NET address variable in the CLI. For more information, see Configuring the HOME_NET Address for Suricata Analysis.
When the PX appliance detects a potential data extraction pattern, it generates an alert in the Web UI. For more information on alerts, see the PX User Guide.
Configuring Data Exfiltration Detection Through the CLI
To configure exfiltration detection in the CLI:
SSH to the PX as npadmin. For example:
$ ssh npadmin@10.7.7.10or
$ ssh npadmin@<FQDN>Enter the npadmin password.
[sudo] password for npadmin: <password>Enter configure exfil mode:
Packet Capture System Administration Guide 6.3.0 53
3 | Getting started
npadmin@hostname#> configure exfilSelect 1 to enable exfiltration detection.
Select 2 to enter the home network addresses in CIDR notation.
Important
You must use CIDR notation <IP_address/routing_prefix> to enter your home network addresses.
Press s to save your changes.
Configuring the HOME_NET Address for Suricata Analysis
You can enable data exfiltration detection and define the HOME_NET IP address through the Packet Capture API. After you enable functionality in the API, you can use the CLI configure suricata to manage HOME_NET IP addresses used in the Suricata analysis engine.
Note
For information on enabling data exfiltration detection through the API, see "Configure Data Exfiltration Detection Request" in the Packet Capture API Reference.
To configure HOME_NET address:
SSH to the PX as npadmin. For example:
$ ssh npadmin@10.7.7.10or
$ ssh npadmin@<FQDN>Enter the npadmin password.
[sudo] password for npadmin: <password>
Configuring real-time file extraction using API
The Packet Capture appliance can selectively extract files from live traffic in real time using Suricata. The extracted files saved to the Packet Capture appliance can then be submitted to configured third-party tools such as VirusTotal and ReversingLabs for further analysis.
To configure real-time file extraction using API:
Create custom Suricata rules for file extraction. See the "Upload a Custom Rule Set" topic in the Packet Capture API Guide.
Enable file extraction. See the "Configure File Extraction" topic in the Packet Capture API Guide.
Check the status of file extraction to confirm whether the feature is enabled. See the "File Extraction Status" topic in the Packet Capture API Guide.
Configure targets to submit the extracted files to third-party tools for further analysis. See the "Create Target for File Export" section in the Packet Capture API Guide.
Verify the status of the configured target. See the "Target Status" section in the Packet Capture API Guide.
(Optional) Configure vLAN filters.
(Optional) Create a domain filter.
Configuring real-time file extraction using the CLI
The Packet Capture appliance can selectively extract files from live traffic in real time using Suricata. The extracted files saved to the Packet Capture appliance can then be submitted to configured third-party tools such as VirusTotal and ReversingLabs for further analysis.
Prerequisites:
Generate an API authentication key in platforms such as VirusTotal and ReversingLabs where you intend to create a target.
Upload domain CSV files to the
/home/npscp/transferdirectory if you wish to upload a domain filter.
To configure real-time file extraction using the CLI:
SSH to the PX as npadmin. For example:
$ ssh npadmin@10.7.7.10or
$ ssh npadmin@<FQDN>Enter the npadmin password.
[sudo] password for npadmin: <password>Open the Configure file carving menu:
npadmin@hostname#> configure file-carvingPacket Capture System Administration Guide 6.3.0
3 | Getting started
Enter the npadmin password.
Configure file carving menu is displayed.
Configure file carvingEnabled [false]
Targets
Filters
Failed Export Retry [Interval:30 Count:1]
Press 1 to toggle the status of real-time file extraction.
By default, the file carving feature is disabled.
Press 2 to configure targets to which you wish to export the extracted files.
In the Configure targets menu, press A to add a target. You can add multiple targets based on your requirement.
In the Add target information menu, press the number corresponding to an option you want to configure for the target server:
Press 1 to specify the host name or IP address of the target server.
Press 2 to specify the port of the target server to which the export request is sent.
Press 3 to set the status of the export. If set to true, the export is enabled; If set to false, the export is disabled.
Press 4 to set the destination on the target where the extracted files are saved. For example: /api/v3/files.
Press 5 to set the timeout for the export request.
Press 6 to set the platform to which the files are exported. Currently, Packet Capture appliance supports two platforms—VirusTotal and ReversingLabs.
Press 7 to specify a name for the target.
Press N to access the next page and press 1 to specify the scheme used to send the request. Possible values are HTTP and HTTPS.
Press N to access the next page and press 2 to enable verify HTTPS request option. When enabled, the target's SSL certificates are validated during the export.
Press N to access the next page and press 3 to enter the API token generated in platforms such as VirusTotal and ReversingLabs.
Press s to save and exit the menu.
Press 3 to configure filters for the files exported to the target. Filters enable you to block or allow files matching the specified parameters.
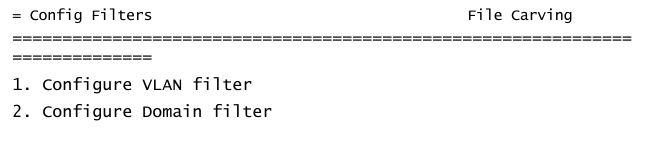
Press 1 to configure the VLAN filter.
Press A to add a new VLAN filter.
Press 1 and then press A to add a list of VLAN IDs to be used by the filter. IDs need to be between 1 and 4095.
Press 2 and then press A to add a list of file types to be included in the export.
Press 3 and then press A to add a list of file types to be excluded in the export. You can add either an inclusion or an exclusion list but not both in a filter.
Press 4 to specify a cluster name for the VLAN filter.
Press s to save and exit the menu.
Press 2 to configure the domain filter.
Press 1 to upload a new domain filter file.
The CSV files that are available at /home/npscp/transfer are displayed. Press the number corresponding to the CSV file with the desired domains you wish to upload. A success message is displayed when the upload succeeds.
Press 2 to download the available domain filters.
The file will be downloaded to the /home/npscp/transfer directory. The complete download path is displayed when download succeeds.
Press 3 to delete all the available domain filters and press Y to confirm.
Press 4 to configure the retry values.
Press 1 to set the duration in minutes after which the failed exports will be retried. You can enter any value between 3 and 1440.
Press 2 to set the number of times after that the failed exports will be retried.
Viewing real-time file extraction statistics
You can view the stats of the targets configured for real-time file extraction of your Packet Capture appliance through KLISH.
To view the real-time file carving statistics:
SSH to the PX as npadmin. For example:
$ ssh npadmin@10.7.7.10or
$ ssh npadmin@<FQDN>Enter the npadmin password.
[sudo] password for npadmin: <password>Open the Configured targets for file carving menu:
user@hostname> show file-carving-statsThe targets to which the files are exported are displayed.
Press a number corresponding to the target whose stats you need. The following window is displayed:
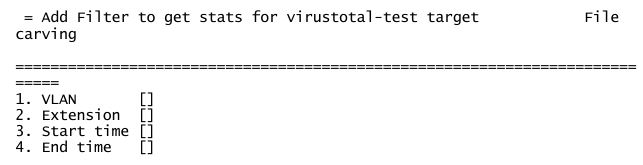
To add a filter to the stats of the selected target, press a number corresponding to the filter you wish to add.
Press 1 to add a VLAN ID to view the stats for a particular VLAN.
Press 2 to add a file extension to view the stats for a particular file type.
Press 3 to add the start time for the duration for which you need the data. You need to enter year, month, day, and time as prompted.
Press 4 to add the end time for the duration for which you need the data. You must specify the start time if the end
time is specified.
Testing connectivity
To test connectivity:
SSH to the PX as npadmin. For example:
$ ssh npadmin@10.7.7.10or
$ ssh npadmin@<FQDN>Enter the npadmin password.
[sudo] password for npadmin: <password>
Ping a machine with a fully qualified hostname to test your PX appliance connectivity and name resolution. For example, use ping from the CLI to ping a FQDN.
npadmin@hostname> ping www.google.comor
npadmin@hostname> ping Trellix.com
Configuring the IPMI Interface
The PX IPMI enables you to perform these tasks remotely from a Web browser:
Cycle the power on your appliance when it is unresponsive.
Reset the server.
Access the serial console when the management interface is unavailable or unresponsive.
Access the IPMI interface, which uses a network connection to the IPMI port of the appliance, through a secure Web browser session.
The IPMI interface is disabled by default.
To configure the IPMI interface on the PX appliance:
SSH to the PX as npadmin. For example:
$ ssh npadmin@10.7.7.10
Enter the npadmin password.
Enter configure IPMI mode:
npadmin@hostname> configure IPMISelect 1 to enable or disable DHCP.
Select 2 to enter the gateway address.
Select 3 to enter the IP address.
Select 4 to enter the netmask address
Select s to save your settings and exit.
Default IPMI credentials:
User name: ADMIN
Password: ADMIN
To view the IPMI configuration:
Enter configure IPMI mode:
hostname # configure IPMI
You will see the following sample output:
IPMI DHCP: ENABLEDIPMI IP ADDRESS: 10.61.64.146 00:25:90:8F:E2:E0IPMI Netmask: 255.255.255.128IPMI Gateway: 10.61.64.129To log in to the PX appliance using the IPMI interface in a Web browser:
Open a Web browser on a computer that is connected to the same network as the PX appliance.
Navigate to the IP address that was configured for the IPMI interface.
Important
The IPMI interface requires an HTTPS connection.
3. Log in to the IPMI Web UI using the default user name and password: ADMIN/ADMIN.
To change the ADMIN password:
Log in to the IPMI interface as described above in steps 1-3.
To open a list of users, in the top navigation bar, select Configuration, and then select Users.
Select the ADMIN user, and then select Modify User.
Check the box to change the password.
Enter the new password, and then confirm it.
Select Modify to set the new password.
Configuring the firewall
To configure firewalls:
You will see this menu:
IP Tables configuration
1. Nagios - Disabled
2. Nagios Port - 5666
3. OpenVPN - Disabled
4. OpenVPN Port - 1194
5. Puppet - Disabled
6. Puppet Port - 8140
7. SNMP - DisabledSSH to the PX:
$ ssh npadmin@10.7.7.10Enter the password.
Enter configure firewall mode:
npadmin@hostname> configure firewallSelect the index number of the item that you want to configure.
Enter the port number.
Select x to save changes and exit.
Configuring packet filters with intelligent capture
The Packet Capture appliance uses intelligent capture to selectively process, analyze, and record network traffic based on multiple filters.
Intelligent capture improves search performance, storage use, and reduces CPU and IO requirements by removing unwanted packets, encrypted traffic, and payloads for streaming data. It terminates session analysis for streaming data and encrypted traffic. Filtered PCAP data is distributed to the Suricata analysis engine, to the PX file management system, and to flow processing.
You can enable intelligent capture to only generate flow data for a selected traffic type without capturing packets, which is helpful for monitoring encrypted traffic. You can also capture a select number of packets or filter for packet headers only. You configure and view intelligent capture filters using the PX API or CLI.
ⓘ Important
Configuring more capture interfaces than you need affects the performance of your PX appliance. Trellix strongly recommends that you do not create more than 10 packet filters per appliance. This behavior applies only to new PX hardware. PX appliances with Napatech cards are not affected.
When your PX appliance encounters tunneled traffic, it applies packet filters only to the encapsulation headers and not to the tunneled payload.
Defining Packet Filters Using the CLI
You can configure and view packet filters from the CLI. This data is supplied to the px-filter component, where it is translated into a shared, loadable object module for use in the packet acquisition and packet capture components. You can also configure and view packet filters using the API. See the PX Series API Reference for more information.
Prerequisite
Admin access
To configure packet filters:
SSH to the PX as npadmin. For example:
$ ssh npadmin@10.7.7.10or
$ ssh npadmin@<FQDN>Enter the npadmin password.
[sudo] password for npadmin: <password>Enter configure network mode:
npadmin@px#> configure packet-filterEnter the npadmin password.
Select A to add a packet filter.
Enter a name for the new filter, then press Enter. The Add filter information menu appears:
1. Expires []2. Description []3. Discard PCAP [false]4. Discard L7 Metadata [false]5. Source MAC Address []6. Destination MAC Address []7. VLAN ID (1-4095) []Select a filter attribute by number or an action by letter|N - Next set |X - Exit menu |Press N to view the next page of configuration options:
1. Ethertype (0x####) []2. Proto (1-255) []3. Source IP Address []4. Destination IP Address []5. Source Port []6. Destination Port []Select a filter attribute by number or an action by letter
|
| P - Previous set
X - Exit menu |Add packet filter information. All fields are optional.
Select 1 to enter what time the filter will expire. You separately enter the year, month, day, hour, minute, and second.
Select 2 to enter a description of the filter.
Select 3 to configure the filter to discard, or ignore PCAP [true]. By default, the filter applies to PCAP [false].
Select 4 to configure the filter to discard, or ignore L7 metadata [true]. By default, the filter applies to L7 metadata [false].
Select 5 to enter a source MAC address to filter.
Select 6 to enter a destination MAC address to filter.
Select 7 to enter a VLAN tag to filter.
Add packet filter information in the second set of options. All fields are optional.
Select 1 to enter what EtherType to filter.
Select 2 to enter what protocol to filter.
Select 3 to enter a source IP address to filter.
Select 4 to enter a destination IP address to filter.
Select 5 to enter what source port to filter.
Select 6 to enter what destination port to filter.
After configuring the packet filter, enter s to save your settings and exit.
Full disk encryption
The Packet Capture appliance stores captured network traffic and metadata in plaintext by default. You can enable full disk encryption to ensure your data and metadata are secure if the disk is removed from the PX. Full disk encryption is disabled by default and can be enabled through the PX KLISH menu.
Configuring FDE from the Web UI
To configure full disk encryption from the Web UI:
After network configuration, follow the following message and perform the neccessary action:
"Generating server SSL certificates, No configured data storage found - rebuild required. Do you want to encrypt storage? [Y/N]:"
Enter Y.
For the message "Please enter a password for the encryption keyfile:" Enter a password.
Verify your password or passphrase.
Enabling FDE from the PX KLISH Menu
To enable full disk encryption from the PX KLISH menu:
SSH to the PX as npadmin. For example:
$ ssh npadmin@10.7.7.10or
$ ssh npadmin@<FQDN>Enter the npadmin password.
[sudo] password for npadmin: <password>Enter the configuration menu:
npadmin@px # configEnter the encryption menu:
npadmin@px # encryptionEnter the npadmin password.
You see the following menu:
[IMAGE PLACEHOLDER: PX KLISH encryption menu showing available encryption options and prompts]
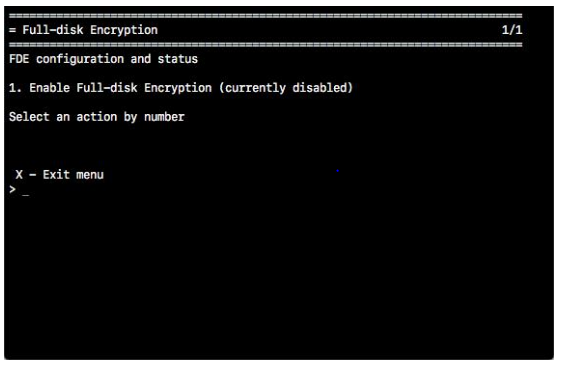
To enable full disk encryption, enter 1.
You see the following warning:
THIS WILL ERASE ALL APPLICABLE FILE SYSTEM DATA. Do you want to continue [y/N]? Enter Y to enable full disk encryption.Enter and verify a new key passphrase.
Your Packet Capture appliance disk is now encrypted
Important
Your passphrase must be at least eight characters long. Trellix recommends creating a passphrase at least 108 characters long.
Backing up PX system configuration
You can perform system configuration backups for later restoration, including after reimaging, RMA restoration.
Backups include a variety of configuration files, users, Suricata rules, Postgres tables, and Redis data.
To back up via Klish:
SSH to the PX as npadmin. For example:
$ ssh npadmin@10.7.7.10
or
$ ssh npadmin@<FQDN>2. Enter the npadmin password.
[sudo] password for npadmin: <password>1. Enter the backup configuration menu:
npadmin@hostname> backup2. Enter the npadmin password.
npadmin@hostname> <password>You see the following:
npadmin@px> backup
[sudo] password for npadmin:
==================================================================
= Backup 1/1
==================================================================
Backup and Restore.
1. Backup configuration
2. Restore from backup
Select a action by number or an action by letter
|
|
|
X - Exit menu |
>3. To generate a backup file using unix timestamps as filename, press 1.
==================================================================
= Backup Status 1/1
==================================================================
Backup Status.
Backup created successfully: 1586875291.tar.gz
Press any key to continueRestoring PX system configuration
You can restore the system configuration to roll back to any backed-up configuration available on your appliance.
You can restore the system configuration as follows:
The same appliance where the backup was created, including after reimaging.
During restoration, the serial number of the backed-up PX appliance is compared with the serial number of the restoration appliance to determine whether the backup is being restored on the same appliance where it was created. When serial numbers match, a few extra files are restored, including files that contain the DTI configuration.
A replacement appliance—RMA restoration.
During RMA restoration, the PX software version saved in the backup configuration file is compared with the PX software version on the replacement appliance. If the PX software version is not an exact match, the backup is not restored and the following error message is displayed:
"status":"failed","message":"Backup and PX versions do not match, restore halted". This prevents damaged configurations and errors due to configuration data that does not match the restoration appliance's PX software version.
Important
Do not restore a backup from one PX model on a different model. For example, do not restore a backup from PX 4000SX440 to PX 2060EXT20.
Prerequisite
To restore a backup on a reimaged appliance or on a replacement appliance, you need to upload the backup file (you made earlier) to your PX appliance from your local machine to make it available for restoration. You can download a backup file to your local machine and upload a backup file from your local machine to a PX appliance through APIs only. For details, see the "Backup and Restore" section in the PX Series API Reference.
To restore via Klish:
SSH to the PX as npadmin. For example:
$ ssh npadmin@10.7.7.10or
$ ssh npadmin@<FQDN>Enter the npadmin password.
[sudo] password for npadmin: <password>
Enter the backup configuration menu:
npadmin@hostname> backupEnter the npadmin password.
npadmin@hostname> <password>You see the following:
npadmin@px> backup
[sudo] password for npadmin:
======================================================================
= Backup 1/1
======================================================================
Backup and Restore.
1. Backup configuration
2. Restore from backup
Select a action by number or an action by letter
|
|
|
X - Exit menu |
>To restore an available backup configuration:
Press 2 to list the available backups for restoration.
Press a number corresponding to the backup file that you wish to restore.
Press y to confirm restoration. The PX appliance reboots after 10 seconds.
Resetting npadmin and npscp passwords
This section explains how to reset your passwords.
To reset the npscp and npadmin passwords:
SSH to the PX as npadmin. For example:
$ ssh npadmin@10.7.7.10or
$ ssh npadmin@<FQDN>Enter the npadmin password.
[sudo] password for npadmin: <password>Press 1 to select the npadmin user.
npadmin@hostname> configure users
[sudo] password for npadmin:=====================================================================
= Users Page 1 / 1
=====================================================================
Add, delete, and edit local users
1. npadmin [wheel,klish,uiapi]
2. cpx cpx [uiapi]
3. npscp [klish]
Select a user by number or an action by letter
A - Add
X - Exit menu
>4. Edit the user information for npadmin:
=====================================================================
= User Edit npadmin
=====================================================================
Edit user information
Name []
Groups [wheel,klish,uiapi]
3. Password [*****]
Select a user attribute by number or an action by letter
X - Exit menu |
>5. Press 3 to select the npscp user.
6. Edit the user information for npscp:
=====================================================================
= User Edit npscp
=====================================================================
Edit user information
Name []
Groups [klish]
3. Password [*****]
Select a user attribute by number or an action by letter
X - Exit menu
>7. Enter x to exit.
Upgrading the PX
You must manually upgrade your PX using the IA web UI or the PX API. Shell access and menu interaction are not required.
To access the PX software patch, log in to the Trellix Support Portal, click the Help menu, and then click the Version tab. If you have an older version of PX software or encounter issues accessing the patch, contact FireEye Support ( ) before upgrading the appliance.
Important
Your PX appliance must be running software version 6.0 to upgrade to software version ADD LONG SW RELEASE. Verify the current release of your PX software before using this procedure.
Note
Installing the ADD LONG SW RELEASE upgrade automatically reboots the PX at completion. Packet capture is interrupted during the upgrade. If the PX ADD LONG SW RELEASE upgrade fails, contact FireEye Customer Support for assistance.
Upgrading the PX using the Network Detection and Response Web UI
Important
Starting in IA version 1.4.0 and PX 4.5.1, the Network Detection and Response appliance Web UI uses the Software Update tool to support upgrades. You must upgrade your Network Detection and Response to 2.0 before upgrading your PX to ADD LONG SW RELEASE. Your PX Series appliance must be running software version 6.0 to upgrade to software version ADD LONG SW RELEASE.
Contact Trellix Customer to request access to the software release image.
Log in to the Network Detection and Response appliance Web UI.
Click the Manage menu, and then select Configure System > Software Update.
Click MANAGE SOFTWARE.
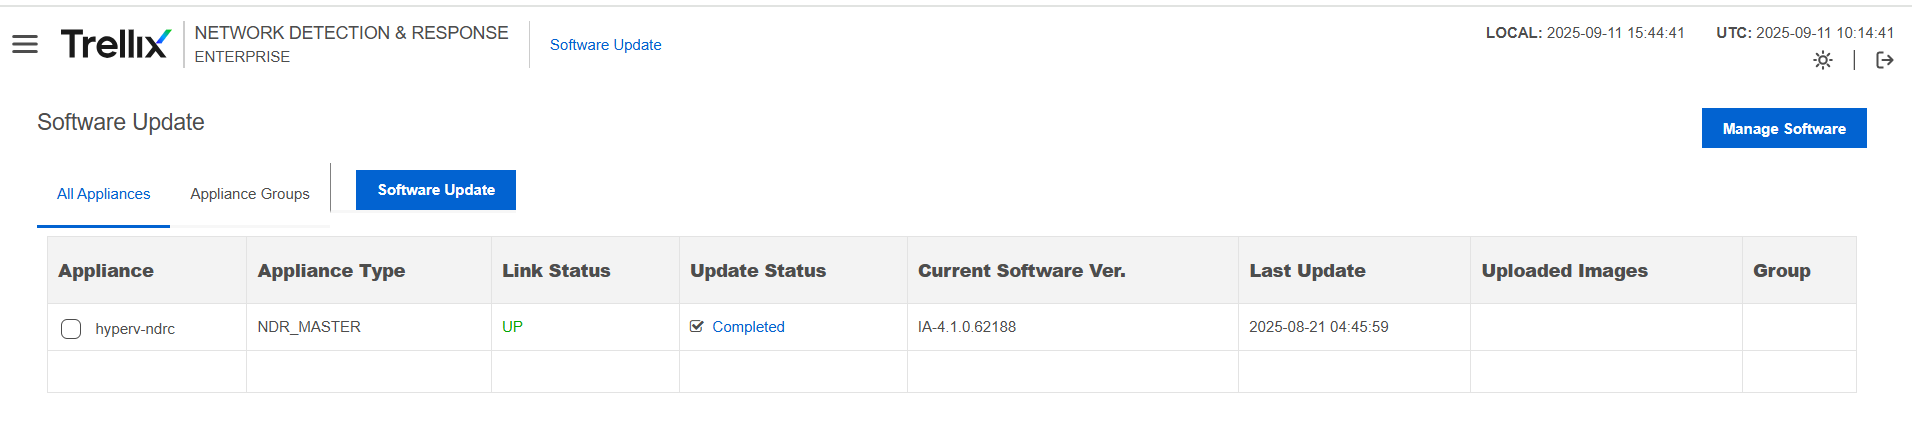
In the Upload Software window, click CHOOSE FILE to upload the .fe software image file that you received from FireEye Customer Support.
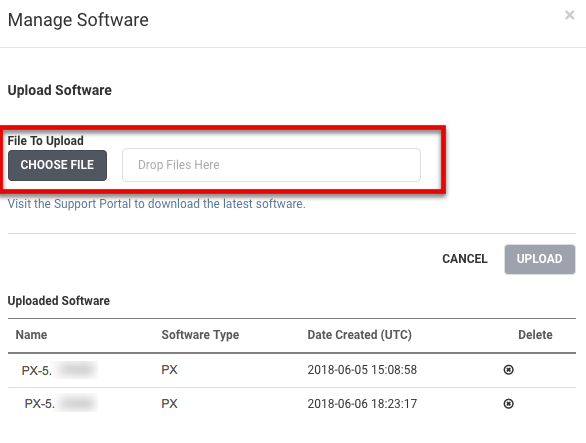
Click the UPLOAD button to upload the software image to your PX appliance.
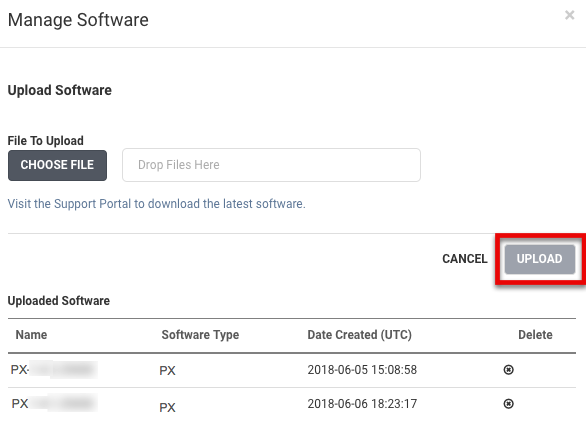
Click All Appliances. In the list of connected PX appliances, select the appliances that you want to upgrade.
Software Update
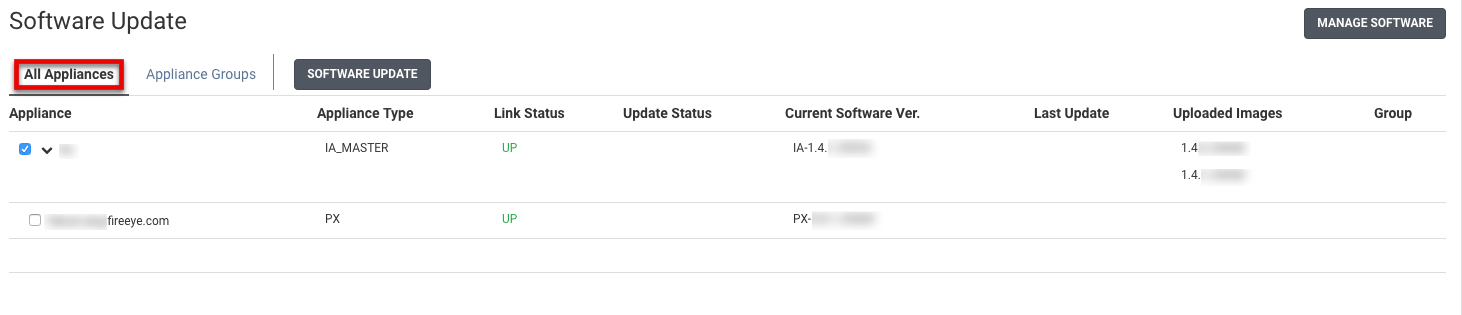
Click SOFTWARE UPDATE.
In the SOFTWARE UPDATE window, in the PX Software list, select the PX software you uploaded in step 4 and step 5.
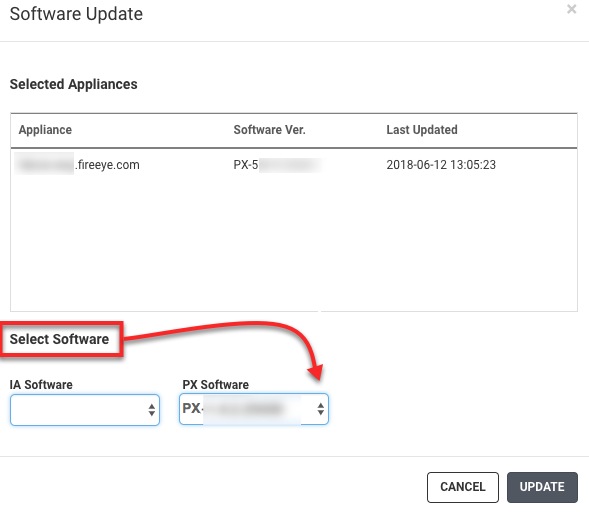
Click Update to upgrade your selected PX appliances with the latest software image.
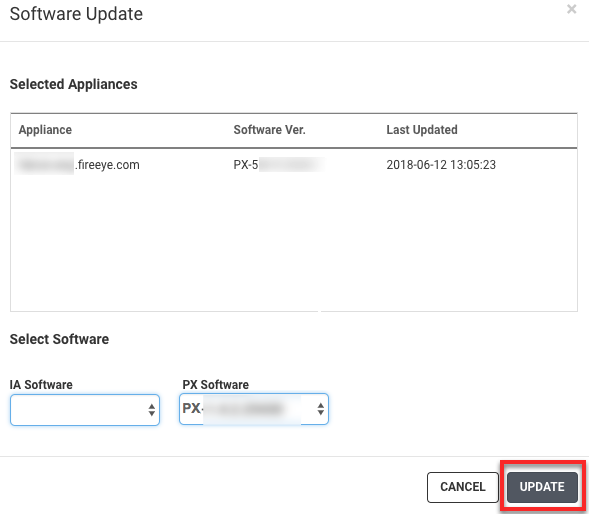
You are redirected to the update page, where you can monitor upgrade status. The stages of upgrade process including informational statuses such as initiation of upgrade, disks being copied, installing packages, errors, success, and failures are logged into the upgrade log file. You can now see the upgrade status messages in the Upgrade status page on the PX Web UI.
You are redirected to the update page, where you can monitor upgrade status. The stages of upgrade process including informational statuses such as initiation of upgrade, disks being copied, installing packages, errors, success, and failures are logged into the upgrade log file. You can now see the upgrade status messages in the Upgrade status page on the PX Web UI.
You are redirected to the update page, where you can monitor upgrade status. You can now see the stages of upgrade process including informational statuses such as initiation of upgrade, disks being copied, installing packages, errors, success, and failures in the Software Upgrade History page in the IA Web UI.
Upgrading using the PX API
Note
The PX Series API supports software upgrades for PX 5.1.0 and later.
Applying the PX upgrade
Enter this cURL command to upload the PX build to your PX appliance using the API:
curl -X POST -u <username:password> -k -F "update=@/path/to/PX-5.1.2.xxxxx.fe" https://<PX>/api/4.0/updatesEnter this cURL command to apply the PX upgrade:
curl -X POST -u <username:password> -k https://<PX>/api/4.0/updates/PX-5.1.2.xxxxx/apply
You can monitor the upgrade process of the Packet Capture appliance in the Software Update page of the PX Web UI. The stages of upgrade process including informational statuses such as update process starting, disks being copied, installing packages, errors, success, and failures are logged into the upgrade log file. You can now see the upgrade status messages in the Upgrade status page in the PX Web UI.
Managing logs
From the CLI, you can view and manage logs and change the default log level.
Prerequisite
Admin access
Setting the logging level
Change the logging level to specify the minimum severity level of messages to save to the local disk or to send to a centralized syslog collector.
Selecting one level encompasses all of the higher levels in the list. For example, if you set the logging level to crit, logging also includes the alert and emerg levels.
Severity Level | Description |
|---|---|
emerg | System failure |
alert | Immediate action required |
crit | Critical condition |
err | Error condition |
warning | Warning condition; the default level |
notice | Normal but significant condition |
info | Informational message |
debug | Debug-level message |
To set the system log level:
This menu appears:
1: Component syslog definition
2: Forwarded Logs - Component syslog definition: {...}, Facilities: {...}
3: Level - info
4: Protocol - upd
5: Remote Targets - Disabled
6: TLS Settings
7: Targets - (empty)
SSH to the PX as npadmin:
$ ssh npadmin@10.7.7.10Enter the npadmin password.
Enter the configure syslog menu:
npadmin@px> configure syslogEnter the npadmin password.
Press 3 for log level.
Select the severity level.
Press S to save the changes and exit.
To view the logs:
SSH to the PX as npadmin:
$ ssh npadmin@10.7.7.10Enter the npadmin password.
Enter the shell:
npadmin@px# shellEnter the directory where the log files are stored:
cd /var/log/The logs are in a text file. Choose how to view them:
tail npulse.log
tail syslog
Configuring syslog settings for an application
You can configure the syslog settings of any application to save the logs of a specific severity level and higher to the local disk.
To select an application and save its log data in the local disk:
This menu appears:
1: Component syslog definition2: Forwarded Logs - Component syslog definition: {...}, Facilities: {...}3: Level - info4: Protocol - upd5: Remote Targets - Disabled6. TLS Settings - TLS: [Disabled], TCP Framing: [default], Verify Certificat...
7: Targets - (empty)
SSH to the PX as npadmin:
$ ssh npadmin@10.7.7.10Enter the npadmin password.
Enter the configure syslog menu:
npadmin@px> configure syslogEnter the npadmin password.
Press 1 to select a component or an application whose log data is saved to the local disk.
By default all the components are set at info level. Here are the components and their descriptions:
Component | Description |
|---|---|
acm | ACM is an authentication system for PX. It controls external access over HTTP to PX resources. It will generally log session information, the data it is monitoring, connection close information and errors. |
asap | asap is Automated Search and Processing. It is the main EBC (Event Based Capture) daemon. It matches up Suricata alerts with flowrecords. When a match is found, it issues a search via the PX API that will then be stored as an EBC search hit for later analysis by an analyst. It will generally log start/stop of stats publishing, sleep message, startup message, errors. |
flow-export | PX Flow data to NetFlow exporter. It will generally log exporter configuration, start message, flows stats, export messages, errors. |
px-alert-monitor | Monitors alert hit frequencies to automatically |
Component | Description |
|---|---|
shut down rules and rulesets in danger of stressing the PX. It will generally log service start/stop, errors and rules regenerate message. | |
px-api | The PX API leverages standard RESTful web services to allow simple integration with existing frameworks, applications, and architectures. It will log general information like add/restore configuration, invalid operation, general error message, successful operation, errors etc. |
px-capture | Captures the network traffic and session information. It will log init/start/stop messages of several processes, statistics, wait message and errors. |
px-collect | It's a PX flow record collector It will log start/stop, errors, linux signals handle and general operation messages. |
px-eve-route | PX EVE Route (PER) routes metadata from Suricata and other sources to ZMQ sockets or files on disk. It will log errors and general operation messages. |
px-event-filter | This program reads EVE formatted JSON records and applies regular expression filters. Records are read from a ZMQ socket and written to a different ZMQ socket. It will log filter info, errors and general operation messages. |
px-flow2eve | It translates binary flowrecords to JSON. It will log errors and general info. |
px-http-exporter | Exports metadata via HTTP to configured targets. |
Component | Description |
|---|---|
It will log errors and general info. | |
px-mom | PX System Configuration Daemon. It logs configuration update and error messages |
px-packet-filter | This process is responsible for the creation of packet filter shared objects and deletion upon expiration. It will log start/stop, error, linux signals handle and general operation messages. |
px-purge | The px-purge watches several folders and keep them clean. Some of the folders are stream type folders which have a 0-n "top-level" non-deleteable folders. All the folders have "timestamp" based folders below that. It also cleans the files extracted by file-carving feature. It will generally log useful information like service start/stop, configuration assumptions, disk utilization. |
px-search | Search daemon of PX pcap. It will log start/stop, error, linux signals handle and general operation messages. |
px-stat-collect | Exports timeseries statistics into InfluxDB. It will log connection status with influxDB, ZMQ, errors. |
px-sys-stats | Publishes system statistics over ZMQ. It will log errors. |
reversetunneld | PX Reverse SSH Tunnel Daemon. It will log service start/stop and error messages. |
6. Choose a value to select the severity level.
Selecting one level encompasses all of the higher levels in the list. For example, if you set the logging level to crit, logging also includes the alert and emerg levels.
(Optional) To select other applications and specify the severity level, repeat steps 5 and 6.
Select s to save the changes and exit.
Forwarding syslog data
You can forward the syslog data for any selected facilities and applications of a specific severity level and higher to a remote host. Facilities are general categories to which the log messages belong.
To forward syslog data:
This menu appears:
1: Component syslog definition2: Forwarded Logs - Component syslog definition: {...}, Facilities: {...}3: Level - info4: Protocol - udp5: Remote Targets - Disabled6. TLS Settings - TLS: [Disabled], TCP Framing: [default], Verify Certificat...
7: Targets - (empty)
SSH to the PX as npadmin:
$ ssh npadmin@10.7.7.10Enter the npadmin password.
Enter the configure syslog menu:
npadmin@px> configure syslogEnter the npadmin password.
Press 2 to select the applications or facilities logs that you wish to forward to a remote host. By default the setting for all the components is set as None.
Press 1 to select a component or an application for which the logs corresponding to the application of the specified severity level and higher are forwarded to a remote host.
Press 2 to select a facility for which the logs corresponding to the facility of the specified severity level and higher are forwarded to a remote host.
Here is the description for each facility:
facility | Description |
|---|---|
Auth | Authorization or security messages |
Authpriv | Private authorization or security messages |
Cron | Cron is a clock daemon that runs commands at specified dates and times |
Daemon | System daemons without separate facility value |
FTP | FTP daemon |
Kernel | Kernel messages |
LPR | Line printer system |
News | USENET news |
PX | All PX application logs |
Syslog | Internal messages from rsyslogd |
UUCP | UNIX-to-UNIX Copy Protocol |
User | Generic user-level messages |
PX-audit | PX application audit logs |
suricata-alerts | Suricata alerts |
6. Choose a value to select the severity level.
Selecting one level encompasses all of the higher levels in the list. For example, if you set the logging level to crit, logging also includes the alert and emerg levels.
7. Select s to save the changes and exit.
Exporting suricata alerts to syslog
By default, PX alerts are logged via syslog, but are not exported off of the appliance until remote targets are configured. You can export alerts to Syslog from the CLI.
Note
Remote targets must be enabled and a remote target must be configured before alerts can be exported.
To forward alerts to syslog:
SSH to the PX as npadmin:
$ ssh npadmin@10.7.7.10Enter the privileged mode:
npadmin@px> enableEnter the npadmin password.
Enter syslog configuration menu:
npadmin@px> configure syslogThe following menu appears:
1: Component syslog definition 2: Forwarded Logs 3: Level - info 4: Protocol - tcp 5: Remote Targets - enabled 6: Splunk Export - Splunk Export: [Disabled] 7: TLS Settings 1: TargetsPress 1 to select component syslog definition.
Press 2 for configuring forwarded logs.
Press 3 to set the level to any other desired level. By default, it is set to info.
Press 4 to select the protocol as tcp.
Press 5 to enable remote targets.
Press 6 to enable spunk export.
Press 7 to configure tls settings.
Press 1 to define targets for logs.
Press s to save syslog configuration.
Configuring syslog server to enable TLS encryption
You can enable TLS encryption for logs that are transmitted from your PX appliance to the syslog server to achieve additional security.
To enable TLS encryption for syslog communication:
Generate syslog certificates on the syslog server and save them in the appropriate locations. See Syslog certificates.
Upload certificates to the syslog collection. See Uploading client certificate to syslog collection.
Enable TLS for syslog communication. See Enabling TLS encryption for syslog.
Syslog certificates
To establish trust between the syslog client (Packet Capture appliance) and the syslog server, you need to generate the CA certificates for both server and client, copy the server certificates to the syslog server, and upload client certificates to your PX appliance.
Generate the following certificates on the syslog server:
CA certificate on syslog server
Certificates for client—rslclient-key.pem; rslclient-cert.pem; ca.pem
Certificates for rsyslog server—rslserver-key.pem; rslserver.cert; ca.pem
ca.pem
rslclient-cert.pem
rslclient-key.pem
Copy the ca.pem, rslserver.cert, and rslserver-key.pem certificates to the
/etc/pki/tls/private/path in the syslog server.Upload the ca.pem, rslclient-cert.pem, and rslclient-key.pem certificates to your Packet Capture appliance using the API. See Uploading Client Certificate to Syslog Collection.
Uploading client certificate to syslog collection
You can upload the syslog client certificates to your PX appliance using the following request:
POST https://<PX_IP_address>/api/4.0/config/certmgmt/syslog/uploadNote
To use this request, you must belong to the sudo group.
Required header:
--user npadmin:hammerheadRequest body:
{Options
ca :@ca.pem
}Response fields
Response Code—A standard HTTP response code.
Response Message—A standard HTTP response message.
Date—Standard HTML date format.
Example
HTTP/1.1 100 Continue
HTTP/1.1 200 OK
Date: Tue, 24 Jan 2017 18:38:24 GMT
[
"1b7c60e9327d5e67de7f381c1bab873d7494dd0b56cd6230253b18ba3cdd3698",
"987ab86dcf7879812e123f12bb8976cc8670a9870d987ee780134b76deadbeef"
]cURL Code Sample: Uploading client certificate
The code sample was run with cURL 7.57.0.
curl -k --user npadmin:hammerhead https://xxx.xxx.xxx.xxx/api/4.0/config/certmgmt/syslog/upload -X POST -F "ca=@ca.pem"This cURL sample includes the following options:
-k—This option explicitly allows cURL to perform insecure SSL connections and transfers, which allows you to test your SSL connection without installing a CA certificate.
--user npadmin:hammerhead—Replace npadmin with the user name of the administrator for your PX Series appliance. Replace hammerhead with the administrator password for your PX Series appliance.
https://xxx.xxx.xxx.xxx/api/4.0/config/certmgmt/syslog/upload—The request URL. Replace xxx.xxx.xxx.xxx with the IP address of your PX Series appliance.
-X POST—This option specifies using the POST method.
-F "ca=@ca.pem—This option specifies the certificate to be uploaded to the syslog collection. Replace ca.pem with the name of the certificate you want to upload.
Results
This example uploads ca.pem certificate to the syslog collection.
Similarly, you can upload rslclient-cert.pem and rslclient-key.pem certificates by replacing ca.pem with rslclient-cert.pem and rslclient-key.pem, respectively.
Enabling TLS encryption for syslog
To enable TLS encryption for syslog:
The syslog appears:
npadmin@px(config)# syslog1: Component syslog definition2: Forwarded Logs - Component syslog definition: {...}, Facilities: {...}3: Level - info4: Protocol - upd5: Remote Targets - Disabled6: TLS Settings - TLS: [Disabled], TCP Framing: [default], Verify Certificat...7: Targets - (empty)
SSH to the Packet Capture appliance as an administrator.
Enter the administrator password.
Enter the configure syslog menu:
npadmin@px> configure syslogSelect 6 for TLS Settings.
options listed: 1. TLS - Disabled 2. Verify Certificate - Yes 3. TCP Framing - default; bottom of the screen shows "C. Cancel" on left and "| S. Save" on right.
To edit the settings, enter the number corresponding to any displayed option to enable or disable it.
Select s to save the changes and exit.
System health
The appliance provides information about its health and performance.
System status and health
The PX Series appliance continuously gathers and reports data about its status, performance, and health.
You can view PX system status using the PX Web UI, and you can use the data for capacity planning. If your appliance continually or critically exceeds the rated limits, contact FireEye for guidance
System status and health are reported on the System, RAID, and Trends pages in the Web UI, where you can check the status of your appliance.
Checking your appliance's health
If your appliance is not running in a healthy state, any of these conditions might exist:
The disk is full.
Disk usage is greater than 90 percent.
Services are listed under "Services Not Running."
Time Sync is off.
Load time is 40 or longer.
The hard drive is missing.
The hard drive has failed.
If the PX Series appliance has any of these health warnings, contact FireEye Support ().
Viewing system status using the Web UI
View system statistics for the last hour, day, week, month, or year in the PX Series Web UI.
To view system status:
At the top of the Web UI, click SYSTEM.
The memory and load charts of your PX appliance are displayed. You can select the memory types and the load types to view the data corresponding to the selected options.
Under Show, select Past HOUR, Past DAY, Past WEEK, Past MONTH, or Past Year to view the data corresponding to the selected option.
Disk usage data for capture, index, end, and tmp are displayed on the page. Services that are not running are also displayed on the page.
Viewing capture status using the Web UI
Use the Capture section of the PX Series Web UI to view capture statistics for the last hour, day, week, month, or year.
To view capture status:
At the top of the PX Series Web UI, click CAPTURE.
In the list at the upper right, select the streams that you want to view.
In the table below the Capture graph, select which channels to show.
Viewing capture status using CLI
To view capture status via CLI:
SSH to the PX as npadmin. For example:
$ ssh npadmin@10.7.7.10or
$ ssh npadmin@<FQDN>Enter the npadmin password.
[sudo] password for npadmin: <password>
Open the capture statistics view,
user@hostname> show capstatsYou see the following:
22 absolute values 2020-10-13 03:45:45 Mbps Received MissedHW Filtered pether3-0 0.000 0 0 0 pether4-0 0.827 434474 0 0 collect PipeInErr ErrorsSec 0 0 InAlert InCapture InSuri EveRoute 0 7678 206316 Flow Active Dropped Exported 98 0 7668 R refresh Z zero T total X exit Q quit
Refresh - For refreshing the display and the timer starts from 30s.
Zero - For setting the counter as 0 and PX displays the delta from current time.
Total - Shows the accumulated values.
Press CTRL-C to exit the view.
RAID health
In the PX Web UI, you can view the PX Series appliance RAID health (if applicable). The RAID controller (if present), logical, and physical data is displayed for debugging.
Viewing and exporting RAID status using the Web UI
Use the RAID section of the PX Series Web UI to view and export RAID status.
To view and export RAID status:
At the top of the PX Series Web UI, click RAID.
To export RAID data to a JSON file, at the lower left of the window, click Export, and then click JSON.
Send the JSON file to FireEye support for troubleshooting.
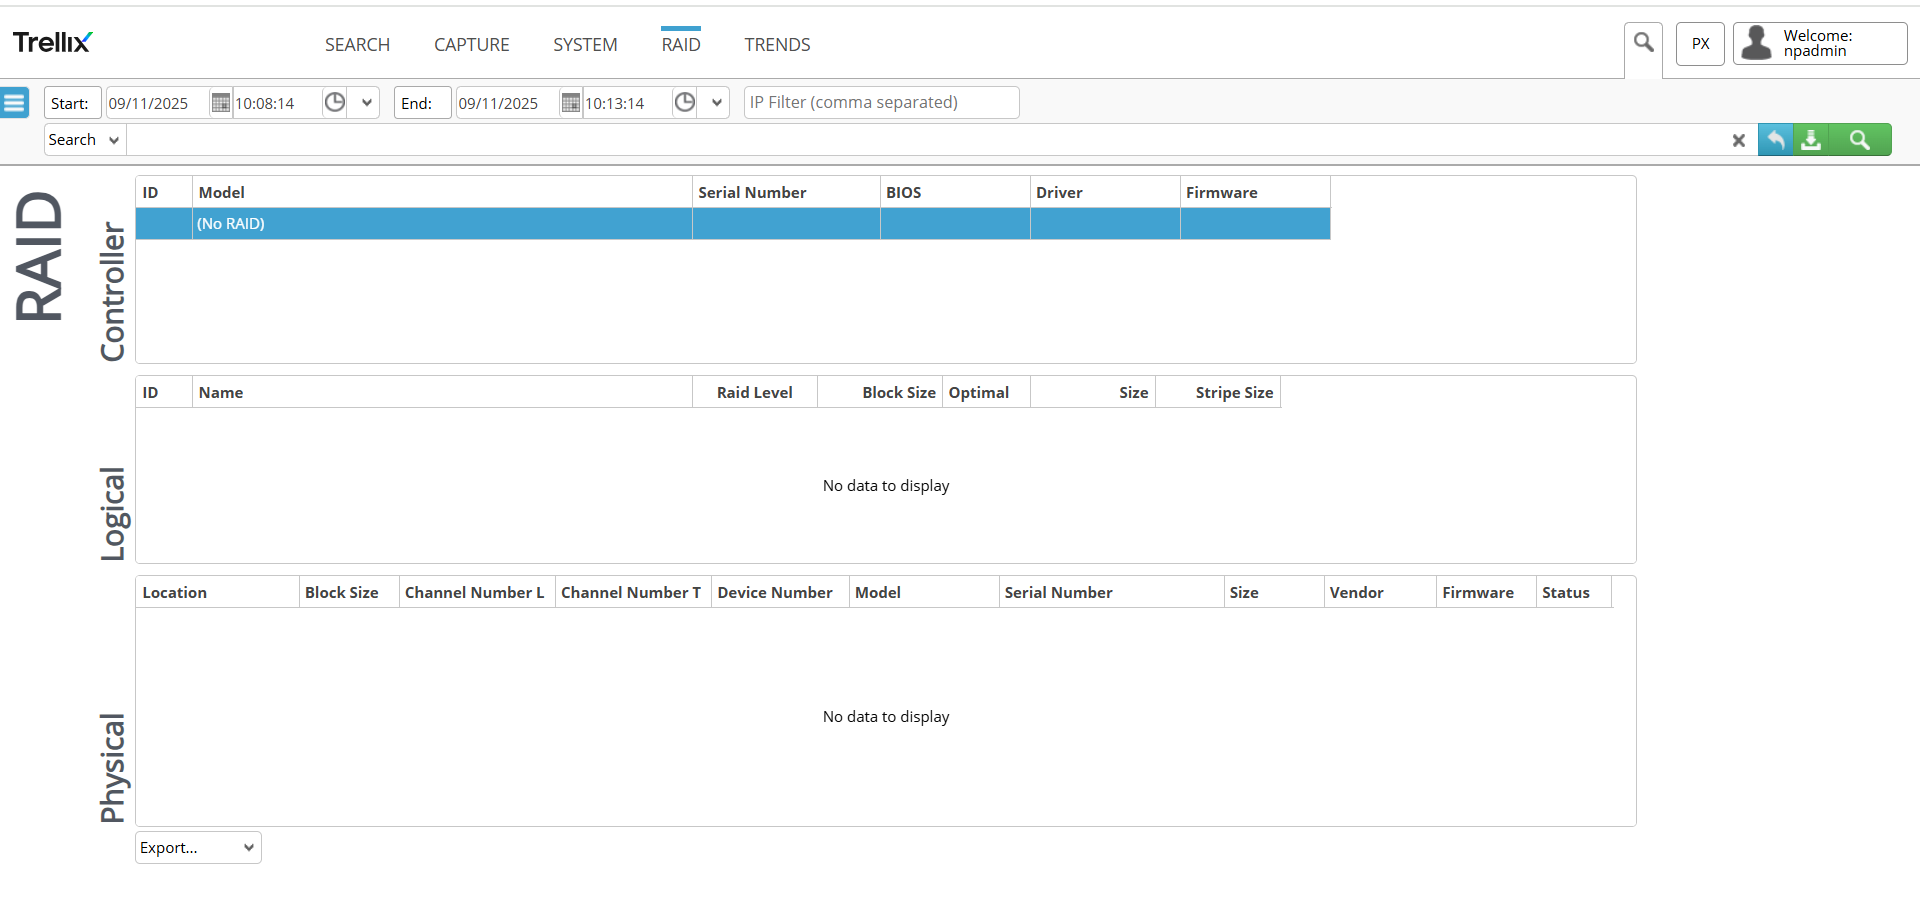
Managing disk space
You can delete system artifacts to manage disk space. You can delete log files, metadata records, capture, index, flow, and search directories. To delete this data, modify the purge configuration file based on partition space or on file age.
To delete files based on volume, set the fullness value to the percentage that you want, expressed as a decimal value. By default, the appliance deletes files when the partition is 90 percent full, or .9.
To delete files based on age, enter a value to set the period (in seconds) after which the old data will be automatically deleted.
With the default value set at -1, files are not deleted based on age until you enter a positive value.
Caution
Edit the purge configuration file carefully. If you change the settings so that system artifacts are not deleted, the partition fills, and you will be unable to record traffic. You also may be unable to use the Search function. Contact Trellix Support () for assistance.
Purge is triggered on fullness and age equally for non /flow/tmp/ folders. Purge deletes the oldest file in a folder and does not delete anything in the /var/log folder.
Prerequisites
SSH access
Elevated privileges using root access
Purging capture data
You can configure the PX appliance to automatically delete the older capture data after a specified period. You need to delete the older data to manage the disk space of your PX appliance effectively.
To purge data based on its age:
SSH to the PX as npadmin. For example:
$ ssh npadmin@10.7.7.10or
$ ssh npadmin@<FQDN>Enter the npadmin password.
[sudo] password for npadmin: <password>
Open the capture statistics view,
user@hostname> configure purge
Enter the npadmin password.
Enter 2 to configure the purge settings for the capture data.
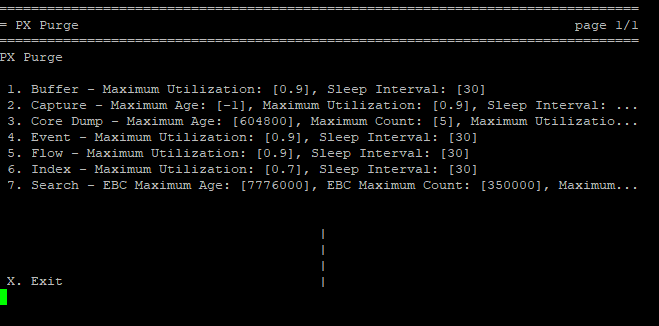
Enter 1 to set the maximum period after which the older capture data is deleted.
Enter a value to set the period (in seconds) after which the old data will be automatically deleted.
[IMAGE PLACEHOLDER: PX Purge > Capture > EDIT > Capture screen showing fields "1. Maximum Age - -1", "2. Maximum Utilization - 0.9", "3. Sleep Interval - 69" and action hints "C. Cancel" and "S. Save"]
The maximum value you can enter is 2147483647 seconds, which is equivalent to 24855 days.
The minimum value you can enter is -1, which disables the purge-by-age feature. This is the default setting.
Enter s to save the settings.
Checking disk mounts
The PX stores capture and flow data on separate mount points identified in the operating system. Before you can check disk mounts, you must verify the existence of the single capture mount and seven flow mount points.
SSH to the PX:
$ ssh npadmin@10.7.7.10Enter the password.
Enter shell mode:
hostname # shellRun the df command from the root shell to report file system disk space usage:
root@px:~# df -hOutput:
Filesystem
Size
Used
Avail
Use%
Mounted on
rootfs
89G
1.2G
83G
2%
/
udev
10M
0
10M
0%
/dev
tmpfs
3.2G
404K
3.2G
1%
/run
/dev/disk/by-label/ROOT
89G
1.2G
83G
2%
/
tmpfs
5.0M
0
5.0M
0%
/run/lock
tmpfs
7.6G
4.0K
7.6G
1%
/run/shm
/dev/sda1
461M
32M
406M
8%
/boot
/dev/sda4
8.3G
852M
7.0G
11%
/opt
/dev/sda3
7.4G
361M
6.7G
6%
/var
/dev/mapper/vgpx-lvcapture
1.5T
1.4T
151G
91%
/capture
/dev/mapper/vgpx-lvflowindex
187G
168G
19G
91%
/flow/index
/dev/mapper/vgpx-lvflowend
56G
591M
56G
2%
/flow/end
/dev/mapper/vgpx-lvflowtmp
38G
50M
38G
1%
/flow/tmp
/dev/mapper/vgpx-lvflowelastic
19G
224M
19G
2%
/flow/elastic
/dev/mapper/vgpx-lvflowevent
19G
33M
19G
1%
/flow/event
/dev/mapper/vgpx-lvflowbuffer 19G 33M 19G 1% /flow/buffertmpfs 32G 0 32G 0% /flow/scratch5. Check /capture and /flow/ output to ensure that neither is at 100% capacity or missing. The sizes may vary according to the platform.
If a mount point is not present, contact Trellix support ().
Monitoring SNMP Data
FireEye appliances send SNMP data to convey abnormal conditions to SNMP managers, which monitor and control them. SNMP data includes:
Information retrieved, or pulled, in response to requests that the SNMP manager sends to the appliance.
Events, known as traps, that are sent, or pushed, by the appliance to the SNMP manager. Traps typically report alarm conditions such as a disk failure, excessive temperature, or when the capture data speed drops to 0. They are not sent in response to requests from the SNMP manager.
Prerequisite
Admin access
To configure SNMP data:
SSH to the PX as npadmin. For example:
$ ssh npadmin@hostnameEnter the npadmin password.
Enter the configure snmp menu:
hostname# configure snmpThe SNMP Configuration menu appears.
1. SNMPv3 Users - (empty)2. Polling - Disabled3. Port - 1614. Read-Only Community - (empty)5. System Contact - None6. System Location - None
7. System Name - None
The second page appears if you enter N.
Trap Community - (empty)
Traps - Disabled
Trap Targets - (empty)
To configure SNMP users, press 1.
To specify a user name, press 1. Enter a value at the prompt and press Enter.
To specify a password, press 2. Enter a value at the prompt and press Enter.
To specify the user type, press 3 to toggle between the available options: read-only and read-write.
To specify the passphrase, press 4. Enter a value at the prompt and press Enter.
To select an encryption method, press 5. Select any one of the following supported encryption methods:
AES / SHA
DES / MD5
AES-256 / SHA-256
AES-256 / SHA-512
Press s to save the settings.
To enable or disable the SNMP polling, press 2.
To edit the SNMP port number, press 3. At the prompt, enter a value and press Enter, and then press s to save the changes.
Leaving the default SNMP community string is a security risk. To change the SNMP community string, press 4, add or edit the string, and then press s to save the settings.
The SNMP community string functions similar to a password.
To set the name of the administrator responsible for the PX appliance health, press 5. At the prompt, enter the contact name, and then press s to save the changes.
To set the physical location of the PX appliance, press 6, and then add or edit the physical or rack location. Press s to save the settings.
To set the PX appliance name, press 7 and enter the system name. Press s to save the settings.
To edit or add the community for trap reporting, press N to go to the next page. Press 1 to add or edit the community for trap reporting, and then press s to save the settings.
To enable or disable the SNMP traps, press N to go to the next page. Press 2 to change the status of SNMP traps, and then press s to save the settings.
To set the Trap Target, press N to go to the next page. Press 3 to define your trap collector in the host:port format, and then press s to save the settings.
Retrieving SNMP data using MIBs
A management information base (MIB) is a text file with the manageable features of a device arranged in a tree, with each branch containing a number and a name.
The path from the treetop to the point of interest forms the object identifier, or OID, a string of period-separated values, such as 1.3.6.1.2.1.1.3.0.
You can send requests for data on an object using the OID. However, using the symbolic name for the object instead might be easier. A MIB enables SNMP tools to translate the symbolic names into OIDs before sending the requests to the managed device.
This table lists the monitoring and status OIDs supported in PX 5.0.0 and later.
Object name | OID | Type | Description |
|---|---|---|---|
captureDropsTotal | 1.3.6.1.4.1.38885.1.1.1.2.1 | The number of dropped packets for this run of hhcapture | Counter64 |
captureErrorsTotal | 1.3.6.1.4.1.38885.1.1.1.2.2 | The number of packet errors for this run of hhcapture | Counter64 |
channelNumber | 1.3.6.1.4.1.38885.1.1.1.2.3.1.1 | The channel number of a row of the captureStatsPerChannel table | Integer32 |
channelLink | 1.3.6.1.4.1.38885.1.1.1.2.3.1.2 | The link status for the channel | Integer (0 link down, 1 link up) |
Object name | OID | Type | Description |
|---|---|---|---|
channelDrops | 1.3.6.1.4.1.38885.1.1.1.2 | The number of packets | Counter64 |
channelErrors | 1.3.6.1.4.1.38885.1.1.1.2 | The number of packet | Counter64 |
channelOctets | 1.3.6.1.4.1.38885.1.1.1.2 | The number of octets | Counter64 |
channelPackets | 1.3.6.1.4.1.38885.1.1.1.2 | The number of packets | Counter64 |
streamNumber | 1.3.6.1.4.1.38885.1.1.1.2 | Stream number of the | Integer32 |
streamMfps | 1.3.6.1.4.1.38885.1.1.1.2 | Mfps (multicast frames | Float number |
streamDfps | 1.3.6.1.4.1.38885.1.1.1.2 | Dfps (broadcast frames | Float number |
streamFrames | 1.3.6.1.4.1.38885.1.1.1.2 | Frame counter | Counter64 |
streamErrors | 1.3.6.1.4.1.38885.1.1.1.2 | Error counter | Counter64 |
streamSliced | 1.3.6.1.4.1.38885.1.1.1.2 | Sliced counter | Counter64 |
streamOctets | 1.3.6.1.4.1.38885.1.1.1.2 | Octet counter | Counter64 |
streamMbps | 1.3.6.1.4.1.38885.1.1.1.2 | Megabits per second | Float number |
Object name | OID | Type | Description |
|---|---|---|---|
streamDropped | 1.3.6.1.4.1.38885.1.1.1.2.4.1.9 | Number of drops for the stream | Counter64 |
streamViolations | 1.3.6.1.4.1.38885.1.1.1.2.4.1.10 | Number of violations for the stream | Counter64 |
captureSFPIndex | 1.3.6.1.4.1.38885.1.1.1.2.6.1.1 | The SFP that the temperature is for | Integer32 |
captureSFPTemperature | 1.3.6.1.4.1.38885.1.1.1.2.6.1.2 | The temperature of the Napatech SFP | Integer32 |
captureSFPAdapter | 1.3.6.1.4.1.38885.1.1.1.2.6.1.3 | Which adapter this SFP is in | Integer32 |
captureAdapterIndex | 1.3.6.1.4.1.38885.1.1.1.2.7.1.1 | The adapter that the temperature is for | Integer32 |
captureAdapterTemperature | 1.3.6.1.4.1.38885.1.1.1.2.7.1.2 | The temperature of the Napatech adapter | Integer32 |
systemTemperature | 1.3.6.1.4.1.38885.1.1.1.4.1 | The current system temperature | Integer32 |
systemPower | 1.3.6.1.4.1.38885.1.1.1.4.2 | Current power supply status: 1 if OK; 0 if problems exist | Integer (power fault 0, power ok 1, power unknown -1) |
fanNumber | 1.3.6.1.4.1.38885.1.1.1.4.3.1.1 | The numerical identifier of the fan | Integer32 |
fanRpms | 1.3.6.1.4.1.38885.1.1.1.4.3.1.2 | The current speed of the fan (in revolutions per minute) | Integer32 |
fanStatus | 1.3.6.1.4.1.38885.1.1.1.4 | The status of the fan: -1 | Integer (-1 error, |
Object name | OID | Type | Description |
|---|---|---|---|
.3.1.3 | if error; 0 if unknown; 1 if good | unknown 0, ok 1) | |
systemDiskName | 1.3.6.1.4.1.38885.1.1.1.5.1.1.1 | The device name of the disk | String |
systemDiskHealth | 1.3.6.1.4.1.38885.1.1.1.5.1.1.2 | The SMART status of the system disk | Integer (unhealthy 0, healthy 1) |
systemDiskSerial | 1.3.6.1.4.1.38885.1.1.1.5.1.1.3 | The serial number of the disk | String |
raidControllerIndex | 1.3.6.1.4.1.38885.1.1.1.5.2.1.1 | The index of the RAID controller | Integer32 |
raidControllerTemperature | 1.3.6.1.4.1.38885.1.1.1.5.2.1.2 | The RAID controller temperature | Integer32 |
raidControllerStatus | 1.3.6.1.4.1.38885.1.1.1.5.2.1.3 | Status of the RAID controller | Integer (nonoptimal 0, optimal 1) |
raidControllerBIOS | 1.3.6.1.4.1.38885.1.1.1.5.2.1.4 | The BIOS version of the RAID controller | String |
raidControllerFirmware | 1.3.6.1.4.1.38885.1.1.1.5.2.1.5 | The firmware version of the RAID controller | String |
raidControllerDriver | 1.3.6.1.4.1.38885.1.1.1.5.2.1.6 | The driver version for the RAID controller | String |
raidControllerSerial | 1.3.6.1.4.1.38885.1.1.1.5.2.1.7 | The RAID controller serial number | String |
raidVolumeController | 1.3.6.1.4.1.38885.1.1.1.5.3.1.1 | The controller index this volume belongs to | Integer32 |
Object name | OID | Type | Description |
|---|---|---|---|
raidVolumeName | 1.3.6.1.4.1.38885.1.1.1.5.3.1.2 | The logical volume name | String |
raidVolumeStatus | 1.3.6.1.4.1.38885.1.1.1.5.3.1.3 | RAID logical volume status | String |
raidVolumeLevel | 1.3.6.1.4.1.38885.1.1.1.5.3.1.4 | RAID level of the logical volume | String |
raidVolumeStripeErrors | 1.3.6.1.4.1.38885.1.1.1.5.3.1.5 | Failed stripes of the RAID volume | Integer (no 0, yes 0) |
raidVolumeSize | 1.3.6.1.4.1.38885.1.1.1.5.3.1.6 | The size of the RAID volume | String |
raidDiskController | 1.3.6.1.4.1.38885.1.1.1.5.4.1.1 | The controller that this disk belongs to | Integer32 |
raidDiskVolume | 1.3.6.1.4.1.38885.1.1.1.5.4.1.2 | The logical volume this disk belongs to | Integer32 |
raidDiskState | 1.3.6.1.4.1.38885.1.1.1.5.4.1.3 | State of the raid disk (for example: online) | String |
raidDiskSmartStatus | 1.3.6.1.4.1.38885.1.1.1.5.4.1.4 | SMART health status of the disk | Integer (unhealthy 0, healthy 1) |
raidDiskSmartWarnings | 1.3.6.1.4.1.38885.1.1.1.5.4.1.5 | Number of SMART warnings reported by the RAID controller for the disk | Integer32 |
raidDiskSerialNumber | 1.3.6.1.4.1.38885.1.1.1.5.4.1.6 | The serial number of the disk | String |
systemLoadAvg1 | 1.3.6.1.4.1.38885.1.1.1.6 | System load average for | Float number |
3 | Getting started
Object name | OID | Type | Description |
|---|---|---|---|
.1 | the last minute | ||
systemLoadAvg5 | 1.3.6.1.4.1.38885.1.1.1.6 | System load average for | Float number |
systemLoadAvg15 | 1.3.6.1.4.1.38885.1.1.1.6 | System load average for | Float number |
systemSerial | 1.3.6.1.4.1.38885.1.1.1.7 | The PX serial number | String |
systemBIOSVersion | 1.3.6.1.4.1.38885.1.1.1.7 | The BIOS version | String |
systemBIOSVendor | 1.3.6.1.4.1.38885.1.1.1.7 | BIOS vendor | String |
systemBIOSDate | 1.3.6.1.4.1.38885.1.1.1.7 | BIOS build date | String |
systemBaseboardManu | 1.3.6.1.4.1.38885.1.1.1.7 | System motherboard | String |
systemBaseboardProdu | 1.3.6.1.4.1.38885.1.1.1.7 | System motherboard | String |
systemChassisManufact | 1.3.6.1.4.1.38885.1.1.1.7 | Manufacturer of the | String |
systemChassisType | 1.3.6.1.4.1.38885.1.1.1.7 | System chassis type | String |
systemProcessorSocket | 1.3.6.1.4.1.38885.1.1.1.7 | The number of installed | Integer32 |
systemProcessorCoreC | 1.3.6.1.4.1.38885.1.1.1.7 | The number of CPU | Integer32 |
Object name | OID | Type | Description |
|---|---|---|---|
ount | .10 | cores among all installed CPUs | |
systemProcessorCoresEnabled | 1.3.6.1.4.1.38885.1.1.1.7 .11 | The number of enabled CPU cores | Integer32 |
systemProcessorThreadCount | 1.3.6.1.4.1.38885.1.1.1.7 .12 | The number of threads of execution for the system | Integer32 |
systemProcessorVersion | 1.3.6.1.4.1.38885.1.1.1.7 .13 | The systems processor version | String |
systemManufacturer | 1.3.6.1.4.1.38885.1.1.1.7 .14 | The system manufacturer | String |
systemProduct | 1.3.6.1.4.1.38885.1.1.1.7 .15 | The system model | String |
systemVersion | 1.3.6.1.4.1.38885.1.1.1.7 .16 | The system version | String |
licenseIssueDate | 1.3.6.1.4.1.38885.1.1.1.8 .1 | The license issue date | String |
licenseExpirationDate | 1.3.6.1.4.1.38885.1.1.1.8 .2 | The license expiration date | String |
licenseMajorVersion | 1.3.6.1.4.1.38885.1.1.1.8 .3 | The major version of PX that the license is valid for | Integer32 |
licenseValidForProducts | 1.3.6.1.4.1.38885.1.1.1.8 .4 | Which products are licensed for this PX | String |
Accessing MIBs
The PX MIB is available on the appliance. A typical SNMP browser can retrieve the values that the appliance supports and then display them in a hierarchy, so you can navigate to the value that you need to include in the request.
To access MIBs:
SSH to the PX as npadmin. For example:
$ ssh npadmin@10.7.7.10Enter the npadmin password.
Enter the shell:
npadmin@px# shellThe MIBs for PX-specific traps are on the PX Series appliance in /usr/share/mibs/site. The MIB of interest is NPULSE-PX-MIB.
Copy the MIB to ~npscp, and then pull the MIB from the PX using an SCP client.
or
Use the scp command to copy the MIB to your SNMP manager.
In your monitoring system, upload them or copy them to the MIB file directory.
Sending requests for SNMP information
Two commands retrieve SNMP information:
snmpget retrieves the value of an object.
snmpwalk examines the object hierarchy, retrieving the values of objects for the subtree or for the node that you specified.
Enter commands from the SNMP manager application:
snmpwalk -v 2c -c wheeler 10.7.7.10 NPULSE-PX-MIB::systemPowerNPULSE-PX-MIB::systemPower = INTEGER: powerOk(1)Generating an SNMP test trap
You can generate an SNMP test trap and send it to any receiving host to verify the connectivity between your PX appliance and the receiving host. The SNMP trap contains the system uptime.
Prerequisites
Admin access
Enable the SNMP port for access through the firewall. See Configuring the firewall.
To generate SNMP trap:
SSH to the PX as npadmin. For example:
$ ssh npadmin@hostnameEnter the npadmin password.
Enter
snmptrap [ip|ipv6] <IP address> [<port>].
Parameters
ip (Optional) – Lets you specify the IPv4 address of a receiving host.
ipv6 (Optional) – Lets you specify the IPv6 address of a receiving host.
IP address – IPv4 or IPv6 address of a receiving host.
port (Optional) – The network port over which the SNMP trap is transmitted to the receiving host. If you don't specify the port, the SNMP trap is sent over port 162 by default.
Example
npadmin@px# snmptrap ip 10.128.58.100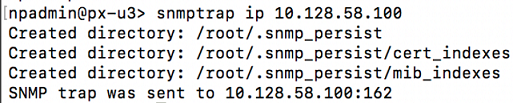
Generating a system dump
When a problem exists on a PX appliance, a system dump captures disk status and time-sensitive system data.
Generate a system dump to send to Trellix Support () for review and troubleshooting. The system dump includes:
RAID levels
Memory usage
Disk usage
System information
Note
A system dump does not include capture data or sensitive data.
To generate a system dump:
SSH to the PX as npadmin:
$ ssh npadmin@hostnameEnter the npadmin password.
Start the system dump:
hostname# sysdumpThe system dump file can be located at home/npscp/transfer/{sysdump-filename} and is now owned by the npscp user.
Send the file to Trellix Support ().
PX secure copy
To move files to and from the PX, use PX secure copy (SCP), known as npscp user. To maintain PX security, npscp user is put in chroot jail and does not allow access to the PX file system.
npscp user cannot write to the home directory. To copy files to and from the PX, use the transfer subdirectory.
For example:
scp my_file.txt npscp@my.px.example.com:transfer/or
scp npscp@my.px.example.com:transfer/my_px_settings.txtSecurely wiping appliance storage
You can securely erase, or wipe, the PX storage to remove sensitive or confidential information from your appliance by using the storage wipe command in KLISH. You can select which file systems to erase, the number of times to overwrite the data, and whether or not to write zeroes over the entire file system when finished wiping storage. You can also rebuild all storage using the storage rebuild command or rebuild only the FSTAB file using the storage fstab command. For information, see Rebuilding Storage.
Note
The
raid-wipe,raid-rebuild, andraid-fstabcommands have been replaced bystorage wipe,storage rebuild, andstorage fstab.
To wipe your Packet Capture storage:
SSH to the PX as npadmin. For example:
$ ssh npadmin@10.7.7.10or
$ ssh npadmin@<FQDN>Enter the npadmin password.
[sudo] password for npadmin: <password>Enter the Wipe configuration menu.
npadmin@hostname> storage wipeEnter the npadmin password.
npadmin@hostname>
You see the following:
=============================================================
= Wipe
=============================================================
Securely remove collected data
1. Filesystems :
2. Iterations : 3
3. Verbose execution : N
4. Final zero write : N
Select a option to modify by number or an action by letter
A - Apply (wipe drive) |
|
|
X - Exit menu |
>5. Enter 1 to select which file systems to wipe.
===============================================================
= Wipe > Filesystems
===============================================================
Select file systems to wipe
1. BUFFER [DELETE]
2. CAPTURE [skip]
3. EVENT [skip]
4. FLOW [skip]
5. INDEX [skip]
6. SEARCH [skip]
7. STATS [skip]
Select a file system to toggle by number or an action by letter
X - Exit menu
>
Use the numbers to toggle file systems between [DELETE] and [skip] then press X to return to the Wipe configuration menu.
6. In the Wipe configuration menu, enter 2 to change overwrite iterations. You can choose between 1 and 9 times.
Important
For storage wiping to be NIST-88 compliant, you must enable data to be overwritten at least once. An iteration equals one full overwrite of the target data.
7. Enter 3 to enable Verbose execution, which displays detailed logs on the screen during the wipe.
8. Press 4 to enable the Final zero write option. If enabled, the system performs a final pass of writing zeros over the disk after all specified iterations are complete.
Note
For storage wiping to be NIST-88 compliant, you must enable this option.
9. When configuration is complete, enter A.
===============================================================
= Confirm wipe partitions
===============================================================
Confirm action should be taken
!!!!!!!!!!!!!!!!!!!!!!!!!!!!!!!!!!!!!!!!!!!!!!!!!!!!!!!!!!!!!!!
!! !!!! This action will permanently remove all data from the selected !!
!! drives. It will prevent any retroactive investigation. !!
!! !!
!!!!!!!!!!!!!!!!!!!!!!!!!!!!!!!!!!!!!!!!!!!!!!!!!!!!!!!!!!!!!!!!!!!!!!!!
Are you sure you want to wipe partitions? [y/N]:
When prompted to confirm the permanent data removal, enter Y.
Rebuilding storage
You can rebuild all the storage erased with the storage wipe command, or rebuild the file systems table (FSTAB) storage only.
The storage rebuild <location> command lets you rebuild all storage to its former location or a location you select. You can provision a partition disk with rebuilt storage to the same location as it was before, a physical disk, a RAM disk, or a specific RAID level.
Parameters
auto
provision scratch partition disk the same as it currently is.
physical
Provision scratch partition on physical disk.
RAM
Provision scratch partition on RAM disk.
String
RAID level (0, 10, 5, 50, 6, 60), default is device dependent.
To rebuild all your Packet Capture storage:
SSH to the PX as npadmin. For example:
$ ssh npadmin@10.7.7.10
or
$ ssh npadmin@<FQDN>
Enter the npadmin password.
[sudo] password for npadmin: <password>To rebuild only your PX FSTAB file storage:
SSH to the PX as npadmin. For example:
$ ssh npadmin@10.7.7.10or
$ ssh npadmin@<FQDN>
Enter the npadmin password.
[sudo] password for npadmin: <password>
Expanding storage on a virtual PX
You can expand the existing storage on a virtual PX by adding new disks without losing any data present on the PX appliance. The storage update command lets you expand the storage for virtual PX. You can expand storage only on virtual PX and not on a physical appliance.
Note
Disk encryption and expanded storage are not compatible.
The storage update command fails on virtual PX appliances that have disk encryption enabled.
Disk encryption cannot be enabled after performing a storage update.
To expand the storage on virtual PX:
SSH to the PX as npadmin. For example:
$ ssh npadmin@10.7.7.10or
$ ssh npadmin@<FQDN>Enter the npadmin password.
[sudo] password for npadmin: <password>Add the additional storage from the Management console of the virtual deployment server.
Run the following command after adding a new disk to the virtual PX appliance.
npadmin@hostname> storage updateEnter the npadmin password.
npadmin@hostname> <password>Run the following command to verify that the storage is updated.
show disk
Configuring credit card data redaction
The Credit Card Data Redaction feature automates the protection of sensitive financial information within network traffic captured by Trellix PX Series appliances. This functionality identifies credit card details within raw packet data and prevents their storage in full packet captures. Specifically, it redacts the credit card number, and additionally, any associated information such as the cardholder's name, CVV, and expiration date, if present within the same packet.
The feature is equipped with a default set of rules designed to detect a broad range of credit card number patterns. By preventing the storage of unencrypted credit card information, this feature minimizes the risk of data breaches and aids in compliance with industry standards such as PCI DSS. A command-line interface (CLI) command allows administrators to enable or disable the credit card redaction functionality.
To configure redaction:
SSH to the PX as npadmin. For example:
$ ssh npadmin@10.7.7.10or
$ ssh npadmin@<FQDN>Enter the npadmin password.
[sudo] password for npadmin: <password>Enter configure PX-capture mode.
npadmin@hostname> configure captureType N to view the next page.
Type 3 to enable PII Redaction.
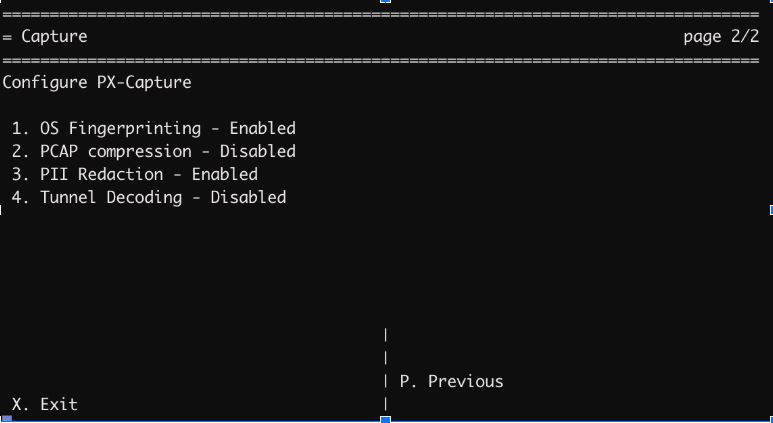
6. Type S to save the configuration.
7. If you want to disable PII Redaction type 3 and then type S to save the configuration.
Product integrations
Your PX Series appliance can integrate with the IA Series appliance, the FireEye Threat Intel platform, the Trellix NX appliance, and TrellixHelix. You can also connect your PX appliance to a remote host through an SSH connection initiated by the PX.
This section discusses these topics:
Network visibility data
The PX platform can generate network visibility data for use with Trellix and third-party products. The network traffic metadata is produced on the PX platform by the open source network security monitoring protocol analyzer, Suricata. Enabling Suricata allows the generation of network traffic metadata, the use of event-based capture (EBC) rules, and advanced intelligent capture filters. Note that enabling Suricata does have an impact on system performance based on both traffic type and volume. The protocol analyzer understands a multitude of network protocols and can extract data specific to those protocols. The generated data can be exported to a Trellix Network Detection and Response appliance, to the Trellix Helix security operations platform, or to third-party SIEM products.
This chapter contains information on the following:
Enabling network metadata generation
Network metadata generation is enabled and configured through the CLI.
To enable generation of network metadata:
SSH to the PX as npadmin. For example:
$ ssh npadmin@10.7.7.10or
$ ssh npadmin@<FQDN>Enter the npadmin password.
[sudo] password for npadmin: <password>Enter configure suricata mode.
npadmin@px#> configure suricataSelect 1 to enable or disable Suricata.
Select 2 to enable or disable EBC.
Select 4 to configure the DNS logging output. A sub menu is displayed.
Select 1 to choose the format of generated DNS metadata.
Select 2 to enable or disable the generation of metadata about DNS requests.
Select 3 to enable or disable the generation of metadata about DNS responses.
Select S to save your selections
Select 5 to manage extra packet decoders. Select the number (1-3) to enable or disable the corresponding decoder. "Yes" means that the decoder is enabled. Select S to save your selections.
Select 6 to choose the protocols for which metadata will be generated. The first page of the list of protocols is displayed. There are 4 pages altogether.
Select the number (1-7) of a protocol to enable metadata generation. "Yes" means that metadata will be generated for that protocol. Select N to go to the next page. Select P to return to a previous page. When you have finished selecting protocols, select S to save your protocol selections.
Select 7 to enable or disable the recording of the VLAN ID number.
Select N to continue to page 2 of the Suricata configuration menu.
On page 2, select 1 to dump HTTP headers. This option dumps HTTP headers as configured. The following options are displayed. Choose the relevant option to proceed with the dump.
1. none - dump no headers
2. both - dump both request and response headers
3. request - dump request headers only
4. response - dump response headers only
Select 2 to enable Assymetric traffic analysis. Enabling this option allows you to inspect network traffic where only one direction of the flow is visible to Suricata. By default, this option is disabled.
Select 3 to set the EVE JSON output for different event types. By default, EVE JSON output is enabled. You can disable EVE JSON output for all event types except alerts.
Select 4 to enable file hashes to be updated in suricata.yaml. The available options are md5, sha1, and sha256.
Select 5 to set the SMB stream depth in megabytes (MB).
Select 6 to enable Community flow IDs. Suricata shall use these generated IDs for searching
Select X to exit from the configure surricata screen.
Exporting network metadata to Network Detection and Response
To export the network metadata from a Packet Capture appliance to an Network Detection and Response appliance, you need to pair the Packet Capture appliance with the Network Detection and Response appliance and enable the export using the IA Web UI or the CLI. See the chapters Configuring PX Metadata Through Web UI and Synching PX and IA Metadata in the IA System Administration Guide.
You can also pair a Packet Capture appliance with multiple Network Detection and Response appliances and configure the metadata settings to export the network metadata from the Packet Capture appliance to all the paired Network Detection and Response appliances. To pair a Packet Capture appliance with multiple IAs using the PX API, see the Create IA Export Output—Request topic in the IA API Reference Guide. You can also pair a Packet Capture appliance with multiple IA appliances through the Web UI of each IA appliance individually.
For information on the Network Detection and Response appliances that are paired with your Packet Capture appliance and the metadata settings configured for each IA export, see Connected Appliances.
Connected Network Detection and Response Appliances
You can view all the Network Detection and Response appliances that are paired with your Packet Capture appliance. You can also view the associated event types and the filters applied to the network metadata that is exported to any paired IA appliance.
To view the Network Detection and Response appliances connected to your Packet Capture appliance:
SSH to the PX as npadmin. For example:
$ ssh npadmin@10.7.7.10
or
$ ssh npadmin@<FQDN>2. Enter the npadmin password.
[sudo] password for npadmin: <password>3. List the Network Detection and Response appliances paired with your Packet Capture appliance:
npadmin@hostname> show connected-IAs4. Enter the npadmin password.
npadmin@hostname>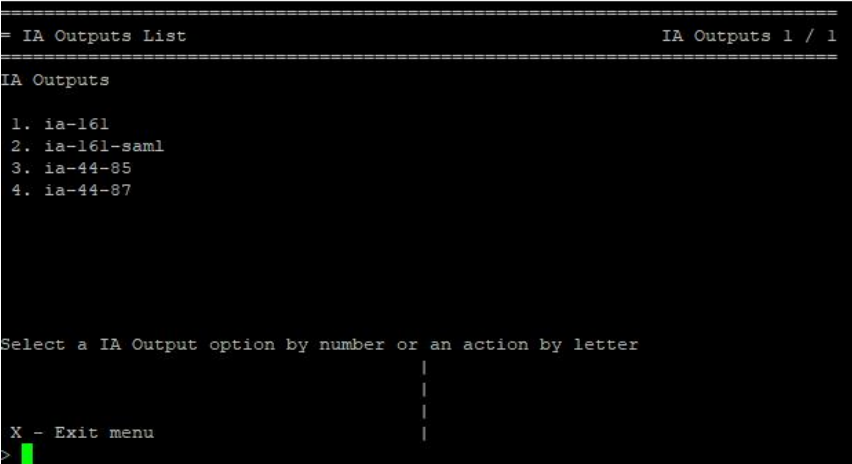
5. To view the associated event types and the filters applied to the network metadata that is exported to any paired Network Detection and Response appliance, select the number corresponding to the Network Detection and Response appliance.
The following screen is displayed when you select a paired IA appliance or an Network Detection and Response export:
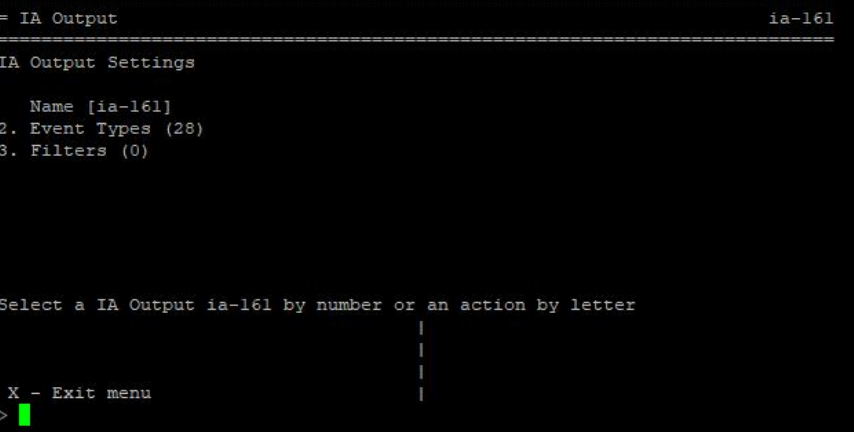 ", "Event Types (28)", "Filters (0)" and a prompt at the bottom.]
Exporting network metadata to Helix
The PX can send network metadata to Trellix’s Helix security operations platform. You configure the export through the Helix interface, the PX CLI and the PX API.
To export the network metadata, follow these steps:
From the Helix Web UI, go to the operations dashboard and choose ‘Download Certificate’.
The downloaded certificate file is named after your Helix instance ID followed by ‘_bootstrap.zip’. This file contains the certificate that will be used by your PX to communicate with Helix.
In the PX CLI Interface:
SSH into the PX
Enter configure helix to enter the Helix configuration menu.
Select 1 and enter the host name of the Helix receiver. Typically this will be your Helix ID followed by ‘.receiver.apps.fireeye.com’.
For example: hexabc123.receiver.apps.fireeye.com
Select ‘2’ to toggle Helix export on and off.
Select 3 to choose the event types to send to Helix. The first page of the list of event type is displayed. There are 4 pages altogether.
Select the number (1–7) to enable or disable selected event type. "Yes" means that metadata will be generated for that protocol. Select N to go to the next page. Select P to return to a previous page.. When you have finished selecting protocols, select s to save your protocol selections.
Note
: You can only export events that you have already enabled in
configure suricata.
Note
: You can only export events that you have already enabled in
configure suricata.
If you wish to filter the types of data exported from the PX to Helix, select option 4. Instructions for creating metadata export filters can be found in Creating filters for exported metadata.
To change the time between data transmissions between the PX and Helix, choose option 5. The default interval is 60 seconds and do not change the interval unless instructed by FireEye.
By default, the PX will send the first 50,000 records as a batch each time it communicates with Helix. If your generated events per second are greater than 50,000, increase the batch size by selecting option 6.
If you wish to forward third-party logs to Helix by using your PX appliance as a Helix Communications Broker, select option
7. When enabled, syslog events that the PX receives from other devices on your network will be sent to Helix.
By default, the ether1 management interface receives syslog data from other network devices to change the interface, choose option 8, and enter the interface you wish to use.
Use the PX API Interface to transfer the certificate we downloaded in the first step to the PX . The following example uses curl to transfer the file:
curl -vvv -k --user npadmin:password https://address/api/4.0/config/export/helix/uploadcerts -X POST --data-binary @/path/to/helixid_bootstrap.zip
To see the exported events in the Helix interface, search for class=fireeye_px
Exporting network metadata via rsync
The PX can be configured to accept rsync connections from other devices in order to retrieve network metadata. Rsync export is highly configurable, allowing multiple unique clients to retrieve datasets configured specifically for them. For instance, you can export only DNS events to client A, while exporting DNS, HTTP, and TLS events to client B. Each client is assigned a specific username to use for the rsync connection, and each rsync user can specify the types of events, as well as any filters that need to be applied.
To make PX data available to other systems, perform these actions:
Generate an SSH key.
Create an rsync user account.
Apply the SSH key to the rsync user account.
Performing these steps enables you to sync metadata between the PX Series appliance and other Trellix appliances, such as the IA Series appliance. See the IA System Administration Guide.
Note
: For information on exporting network metadata to a Splunk instance via rsync, see the FireEye Community article.
Prerequisites
Access to port 22 for SSH for rsync
SSH key generation
Note
Trellix recommends using PuTTYgen to generate an SSH key on your Windows device.
Open the command-line interface (CLI) on your local machine.
At the prompt, use the ssh-keygen program below to create an RSA key. Replace your_email@example.com with your email address to create an SSH key using your email as a label.
ssh-keygen -t rsa -b 4096 -C your_email@example.comAt the Enter file prompt, type the full path and file name where you want to save the RSA key. The path and file name must include your HOME directory and the .ssh subdirectory.
Enter file in which to save the key (/Users/<your_home_directory>/.ssh/id_rsa): /Users/<your_home_directory>/.ssh/rsync_rsaClick Enter at the Enter passphrase prompts:
Enter passphrase (empty for no passphrase): Enter same passphrase again:
Important
If you enter a unique passphrase at the passphrase prompts, you must enter your passphrase each time you use the SSH key.
5. Copy and paste your private key in a secure location.
Note
Your identification and public key are saved in the file location that you provided in step 3.
6. To view your public key, enter this command at the prompt:
cat /Users/<your_home_directory>/.ssh/rsync_rsa.pubAdding an rsync User to the PX appliance
SSH to the PX appliance:
$ ssh npadmin@10.7.7.10Enter the npadmin password:
[sudo] password for npadmin: <password>Enter configure rsync mode:
npadmin@px#> configure rsyncAt the Rsync configuration menu, select A to configure an rsync exporter. Each exporter will have an rsync user assigned to it.
Enter the username for the new exporter. This is also the directory name in which events destined for this rsync client resides.
At the next menu, select 2 to enter a full name for this rsync user. It’s helpful to use this space to provide some kind of description of the rsync client for this connection, such as "SecOps Splunk."
Select 3 to add the ssh public key generated in the previous SSH key generation process.
Select 0 to add a new output. When prompted for a directory for new output, assign a unique directory name for each exporter’s output, i.e. secops_splunk
In the Add target menu, select 2, to choose the event types to send to this target. You will be presented with 4 pages of choices. Enter N to advance a page, and P to return to the previous menu page.
10. If you wish to filter the types of data exported from the PX to an rsync client, select option 3. Instructions for creating metadata export filters can be found in the section of this chapter entitled Creating Filters for Exported Metadata.
Exporting layer-7 network metadata over HTTP to Splunk
You can export the layer-7 network metadata generated on your PX to Splunk over HTTP. You can filter the Layer-7 metadata that is exported to the Splunk server.
Prerequisite: Generate an HEC token on the Splunk server to which you wish to export the metadata.
To enable network metadata export to Spunk:
SSH to the PX as npadmin. For example:
$ ssh npadmin@10.7.7.10or
$ ssh npadmin@<FQDN>Enter the npadmin password.
[sudo] password for npadmin: <password>Open the Export Metadata to SIEM menu.
npadmin@host> configure siemEnter the npadmin password.
Press 1 to configure customers. Customers are the targets to which you wish to export the layer-7 metadata.
Press 1 to configure Splunk.
In the Configure Splunk menu, press A to add a Splunk target.
You can add multiple Splunk targets based on your requirement.
In the Add Splunk Customer menu, press the number corresponding to an option you want to configure for the target Splunk server:
Press 1 to specify the host HTTP address of the target Splunk server.
Press 2 to specify the port to which the export request is sent.
Press 3 to set the status of the export. If set to true, the export is enabled; If set to false, the export is disabled.
Press 4 to enter the HEC token that you had generated in the Splunk server.
Press 5 to specify the number of events you wish to batch and export to the target at once.
Press 6 to set the interval between consecutive exports.
Press 7 to specify a name for the splunk target.
Press N to access the next page and press 1 to enable verify HTTPS request option. When enabled, the target's SSL certificates are validated during the export.
Press N to access the next page and press 2 to specify the name of the filter that you wish to apply to the Splunk export. This is optional. To configure a filter see the next step.
Press 2 to configure filters to the layer-7 metadata that is exported to the Splunk target. Filters enable you to block metadata matching the specified parameters in the selected event types.
Press A to add filters.
Press 1 to edit event types and press a number corresponding to any event type to set the status to Y or N.
The metadata corresponding to the event types whose status is set to Y are not included in the metadata exported to Splunk. By default, the status of all the event types are set to N. Hence, all the event types are included in the metadata exported to Splunk.
Press 2 to set the filter.
Specify the packet filter attribute to filter the metadata that matches the specified info. To know more about filter configuration, see the Packet Capture System Administration Guide.
Press 3 to set the status of the filter: pass or block.
Note
We suggest you to set the status of the filter to block. When you set the status of the filter to "block", the selected events that matches the specified parameter in the filter are not exported.
Press 4 to specify the name for the filter.
Press S to save and exit the menu.
Exporting network metadata over HTTP
You can export network metadata generated by the PX to a target device over HTTP if your PX Series appliance is running software version 5.1.0 or higher.
Important
Metadata is exported as gzipped json file containing the metadata records, not be a stream of individual records.
To enable network metadata export via HTTP:
SSH to the PX as npadmin. For example:
$ ssh npadmin@10.7.7.10or
$ ssh npadmin@<FQDN>Enter the npadmin password.
[sudo] password for npadmin: <password>Open the HTTP metadata export configuration menu.
npadmin@host> configure http-exportEnter the npadmin password.
Press A and enter a name for the appliance you will export metadata to.
The Add Exporter configuration menu appears.
Press 2 to toggle between enabled and disabled.
Press 3 to open the Configure Webhook menu.
Enter information about the target appliance:
Press 1 to enter the HTTP address of the target appliance.
Press 2 to select the method used to export metadata.
Press 3 to enable TLS verification. TLS verification is disabled by default.
Press 4 to configure authentication credentials.
Press 5 to add headers.
Important
Verify the information you enter in the Configure Webhook menu. The connection between the Packet Capture appliance and the target appliance will fail if you provide incorrect information.
Press S to save and exit the menu.
Press 4 to open the Configure Metadata menu.
Press 1 to create a new HTTP output.
Press A to add a new output.
When prompted for a directory name, provide a unique name for this output, for instance, http-siem.
If you wish to enable filters for the types of data exported from the Packet Capture to an HTTP endpoint, select option 2.
Note
For information, see Creating Filters for Exported Metadata on the facing page.
15. Enter 3 to choose the types of metadata records to be exported via HTTP.
Viewing metadata export statistics
You can view a table of capture statistics to monitor your Packet Capture appliance performance through KLISH.
To view capture statistics:
SSH to the PX as npadmin. For example:
$ ssh npadmin@10.7.7.10or
$ ssh npadmin@<FQDN>Enter the npadmin password.
[sudo] password for npadmin: <password>
Configuring metadata export to Elasticsearch
You can export the layer-7 network metadata generated on your Packet Capture to Elasticsearch over HTTP. You can filter the Layer-7 metadata that is exported to the Elasticsearch server.
To configure metadata export to Elasticsearch server:
Generate public key client certificates on the Elasticsearch server and upload them to your PX appliance using the following API endpoint: POST https://<PX_IP_address>/api/4.0/config/certmgmt/syslog/upload. For more information about making this API request, see Uploading Client Certificate to Syslog Collection.
Enable metadata export to the Elasticsearch server. See Enabling Layer-7 Network Metadata Export Over HTTP to Elasticsearch.
Configure the Elasticsearch server to add the following configurations to the elasticsearch.yml file:
xpack.security.enabled: true xpack.security.http.ssl: enabled: true keystore.path: certs/http.p12
Enabling layer-7 network metadata export over HTTP to Elasticsearch
Prerequisite: Generate the API Key and the API ID on the Elasticsearch server to which you wish to export the metadata.
To enable network metadata export to an Elasticsearch target:
SSH to the PX as npadmin. For example:
$ ssh npadmin@10.7.7.10or
$ ssh npadmin@<FQDN>Enter the npadmin password.
[sudo] password for npadmin: <password>Open the Export Metadata to SIEM menu:
npadmin@host> configure siemEnter the npadmin password.
= Export Metadata to SIEM ========================================================= ===== ===== Configure SIEMs to export metadata 1. Configure Consumers 2. Configure FiltersPress 1 to configure consumers. consumers are the targets to which you wish to export the layer-7 metadata.
Press 2 to configure an Elasticsearch consumer.
In the Configure elasticsearch menu, press A to add an Elasticsearch target.
You can add multiple Elasticsearch targets based on your requirement.
In the
Add elasticsearch consumermenu, press the number corresponding to an option you want to configure for the target Elasticsearch serverPress 1 to specify the host HTTP address of the target Elasticsearch server.
Press 2 to specify the port to which the export request is sent.
Press 3 to set the status of the export. If set to true, the export is enabled; If set to false, the export is disabled.
Press 4 to enter the filter name that you wish to apply to the configured metadata export.
Press 5 to specify the number of events you wish to batch and export to the target at once.
Press 6 to set the interval (in seconds) between consecutive exports.
Press 7 to specify a name for the Elasticsearch target.
Press N to access the next page and press 1 to enable verify HTTPS request option. When enabled, the target's SSL certificates are validated during the export.
Press N to access the next page and press 2 to add the API ID generated in the Elasticsearch server for authentication.
Press N to access the next page and press 3 to add the API Key generated in the Elasticsearch server for authentication.
Press N to access the next page and press 4 to add the name of the Elasticsearch index to which the metadata will be exported.
Press 2 to configure filters to the layer-7 metadata that is exported to the Elasticsearch target. Filters enable you to block metadata matching the specified parameters in the selected event types.
Press A to add filters.
Press 1 to edit event types and press a number corresponding to any event type to set the status to Y or N.
The metadata corresponding to the event types whose status is set to Y are excluded from the metadata exported to the Elasticsearch server. By default, the status of all the event types are set to N. Hence, all the event types are included in the metadata exported to the Elasticsearch server.
Press 2 to set the filter.
Specify the packet filter attribute to filter the metadata that matches the specified info. To know more about filter configuration, see the Packet Capture System Administration Guide.
Press 3 to set the status of the filter: pass or block.
Note
We suggest you to set the status of the filter to block. When you set the status of the filter to "block", the selected events that matches the specified parameter in the filter are not exported.
Press 4 to specify the name for the filter.
Press s to save and exit the menu.
Viewing SIEM export statistics
You can view the statistics of filters and targets configured for SIEM export of your PX appliance.
To view the SIEM export statistics:
SSH to the PX as npadmin. For example:
$ ssh npadmin@10.7.7.10or
$ ssh npadmin@<FQDN>Enter the npadmin password.
[sudo] password for npadmin: <password>Open the Show SIEMs export metadata and filter stats menu:
user@hostname> show siem-export-statsDo the following to view the statistics:
Specific filter statistics: Press 1 to list the available filters and then press a number corresponding to the filter whose stats you wish to display. Stats for the selected filter are displayed for the last 10 minutes, last 1 hour, and last 1 day along with an option to view stats for a custom time interval. Press 1 to set the custom period. The maximum value the custom option can take is 120 minutes or 48 hours or 60 days.
Specific consumer statistics: Press 2 to view the stats of a specific consumer on Splunk or Elasticsearch server for the last 10 minutes, last 1 hour, and last 1 day. You also have an option to view stats for a custom time interval. The maximum value the custom option can take is 120 minutes or 48 hours or 60 days.
Press 1 to view the configured consumers on Splunk and then press a number corresponding to the consumer whose stats you wish to view.
Press 2 to view the configured costumers on Elasticsearch and then press a number corresponding to the customer whose stats you wish to view.
Press 3 to view the quick stats of all the filters together for the last 10 minutes, last 1 hour, and last 1 day.
Press 4 to view the quick stats for all consumers together for the last 10 minutes, last 1 hour, and last 1 day.
Creating filters for exported metadata
You can filter each event type that is exported using the metadata fields. Metadata exported from the PX may be filtered to reduce volume. The filter creation syntax is the same for all the export methods.
Metadata filters can be applied to one or more event types (pxflow, dns, http and so on) that include the specified metadata fields. For instance, the field httpHost will be present in http and fileinfo event types but not present in dns event types.
Matching conditions are written in the form of METADATA_FIELD RELATIONAL_OPERATOR MATCH_VALUE and must include spaces between each part. Multiple matching conditions are included using the operators AND and OR. The operators must be in uppercase.
The following relational operators are valid in matching conditions:
Relational operator | Meaning |
|---|---|
= | Equal to. Matching records will be dropped |
!= | Not Equal to. Only matching records will be included |
> | Greater than. Matching records will be dropped |
< | Less than. Matching records will be dropped |
>= | Greater than or equal to. Matching records will be dropped |
<= | Less than or equal to. Matching records will be dropped |
~ | Contains. Matching records will be dropped |
!~ | Does not contain. Only matching records will be included |
Follow these guidelines when you create filters:
Do not use quotes around numerals
Use single quotes around hostnames, domain names, and IP addresses.
The '~' relational operator does not work with dotted-quad IP addresses
Do not use CIDR notation.
Examples
Exclude records with a port 80 destination | destinationTransportPort = 80 |
Exclude records with a port 80, or port 443 destination | destinationTransportPort = 80 OR destinationTransportPort = 443 |
Include ONLY records with a port 80 destination | destinationTransportPort != 80 |
Include ONLY records with a port 80 or port 443 destination | destinationTransportPort != 80 AND destinationTransportPort != 443 |
Exclude records that match any of three IP addresses | sourceIPv4Address = "10.5.19.103" OR sourceIPv4Address = "10.5.19.104" OR sourceIPv4Address = "10.5.19.106" |
Exclude records that contain a specific domain name in a DNS lookup request | dns.dnsQName ~ "mycompany.com" |
Filterable metadata fields
Note
The metadata fields in the "common" event category is present in all event types. The following list is broken down by the type of events in which the field is present.
Event Type | Filterable Metadata Fields |
|---|---|
common | |
pxflow | |
pxflow.fragmentFlags pxflow.fragmentFlagsReverse pxflow.ingressInterface pxflow.ipClassOfService pxflow.ipVersion pxflow.mplsId pxflow.octetDeltaCount pxflow.octetDeltaCountReverse pxflow.packetDeltaCount pxflow.packetDeltaCountReverse pxflow.portId pxflow.protocolIdentifier pxflow.protocolIdentifierName pxflow.sortedHashValue pxflow.sourceEtherAddress pxflow.sourceIPv4Address pxflow.sourceIPv6Address pxflow.sourceTransportPort pxflow.tcpControlBits pxflow.tcpControlBitsReverse pxflow.typeOfService pxflow.vlanId | |
dhcp | dhcp.id dhcp.request dhcp.response |
dns | dns.dnsFlags dns.dnsId dns.dnsIsResponse dns.dnsQName dns.dnsQRType dns.dnsTTL dns.dnsTXTData dns.rcode dns.tx_id dns.type doc_values_type |
fileinfo | fileinfo.fileMagic fileinfo.fileMD5 fileinfo.fileName fileinfo.fileSize fileinfo.fileState fileinfo.fileStored fileinfo.fileSuffix email.attachment email.from email.status email.to email.url http.httpContentLength http.httpContentType http.httpGet http.httpHost http.httpMethod http.httpReferer http.httpResponse http.httpURL http.http_user_agent |
| |
ftp | |
http | |
tls | |
smb2 | |
smtp | |
Trellix threat intel configuration
To provide real-time monitoring of Trellix Threat Intel indicators of compromise (IOCs), PX integrates with Trellix Threat Intel.
Use the CLI to configure your PX and Trellix Threat Intel connection.
Use Trellix Threat Intel API to issue download requests of intel rulesets to your PX appliance.
See the PX Series API Reference. For Trellix Threat Intel API documentation, go to https://docs.trellix.com/docs/index.html#IS.
Your Trellix Threat Intel subscription provides the API keys that enable you to connect to the Trellix Threat Intel portal and download intel indicators.
Contact Trellix support (https://www.trellix.com/en-us/support.html) for guidance on the Trellix Threat Intel subscription level that might be best for your organization.
If you do not have a Trellix Threat Intel subscription, contact Trellix Support.
To configure your PX and Trellix Threat Intel connection:
npadmin@px#> configure isightImportant
To obtain Trellix Threat Intel API keys, you must have a Trellix Threat Intel subscription.
SSH to the PX:
$ ssh npadmin@10.7.7.10Enter the npadmin password.
Enter configure Trellix Threat Intel mode:
Select 1 to paste the API key provided with your Trellix Threat Intel subscription.
Select 4 to paste the private key provided with your Trellix Threat Intel subscription.
Select 3 to enable the Trellix Threat Intel rule loader.
Select 2 to enter the number of rule retention days. The default is 15.
Note
After the initial configuration between your PX appliance and Trellix Threat Intel is complete, it takes about 12 hours for your PX appliance to receive the first download of Trellix Threat Intel IOCs. (NETF-1817)
To download Trellix Threat Intel IOCs before the 12-hour initialization time completes, run this command from the shell:
python /opt/npulse/scripts/isight/isight-rule-loader.py --verbose all
Integrating an NX appliance and PX appliance using IA
The IA Series appliance can import L7 metadata from the NX. The IA uses Network Security event metadata to request event-specific PCAP from the PX and provide critical forensic data to the paired Network Security.
This chapter contains information on the following:
Exporting NX L7 metadata
You can configure your Network Security to export L7 metadata to your Network Detection and Response Series appliance.
To enable the export of L7 metadata from your Network Security to your Network Detection and Response:
Log in to the Network Security Series CLI.
Enter privileged mode:
enableEnter configuration mode:
configure terminalEnter the metadata export configuration menu:
show l7metadata-export configVerify that the authorization header value equals the unique token ID displayed in the Network Detection and Response appliance's Network Security pairing configuration menu.
If the authorization header value does not match the unique token ID:
Enter l7metadata-export protocol https <ia-appliance-ip-address> port 443 authorization header <unique-token-id>Enter show l7metadata-export config to verify your changes.
Enter the following to enable the export of L7 metadata from the NX appliance to the Network Detection and Response:
l7metadata-export enable
Important
Enter the command
l7metadata-export disableto disable exporting of metadata from the Network Security to the Network Detection and Response.
Requesting PCAP from PX using NX L7 metadata
A PX appliance stores only PCAP while connected to an NX appliance. L7 metadata from the NX appliance can be used by the Network Detection and Response to identify PCAP from the PX.
To retrieve PCAP from an NX-paired PX appliance:
Log in to the Network Detection and Response Web UI.
In the Query bar:
Enter the search query
"sensor_type: nx".Select a window of time to search for event metadata ingested from the PX.
Click the search button.
The PX event table loads with PX events that correspond to events on the paired NX appliance. Information in the event table can be used to determine which NX event the PCAP pertains to.
Connecting to PX using a reverse tunnel for SSH and HTTPS traffic
The PX appliance typically relies on other Trellix devices to initiate connections for integration. Firewall rules are required for the PX to integrate with any external entity. Instead of relying on external devices to initiate a connection, you can create a reverse tunnel from your PX that forwards SSH and HTTPS traffic between your PX appliance and the external host. Creating a reverse tunnel avoids the need to create specific firewall rules. You can use the configure reverse-tunnel CLI menu or the PX API to set up tunnels. For information on specific endpoints, see the PX API Reference.
Important
Trellix recommends you only create the minimum number of tunnels required to integrate with your other Trellix devices.
This section includes the following:
Adding a tunnel user on the IA
Before you can connect your PX to the Network Detection and Response Series appliance using a reverse tunnel, you must create a user on the IA specifically for the reverse tunnel use. The default shells used by Network Detection and Response users are not supported by the reverse tunnel system.
To add a tunnel user for the Network Detection and Response Series appliance:
Log in to the Network Detection and Response as the root user using the IP address or FQDN.
Create a new user:
[root]$ useradd -m -G klish -s /bin/bash <tunneluser>Create a new password for the tunnel user:
[root]$ passwd <tunneluser>Enter, then reenter, the new password.
The credentials you created can be used in step 5 of Adding a reverse tunnel through the CLI.
Creating a reverse tunnel through the CLI
Prerequisites
An external device that connects to a PX through a reverse tunnel must meet the following requirements:
An SSH server running on port 22.
A user with a standard log in shell, such as bash, zsh, csh, or ksh.
Tip
Test if the command
ssh-copy-idis supported on the external device user you want to use for reverse tunnel connectivity. If the command is not supported, a different user with a standard shell is required.
Important
If the external device is an IA Series appliance, you must create a new user specifically for reverse tunnel use. See Adding a tunnel user on the IA for more information.
To create a reverse tunnel connecting to an external device:
SSH to the PX as npadmin. For example:
$ ssh npadmin@10.7.7.10or
$ ssh npadmin@<FQDN>Enter the npadmin password.
[sudo] password for npadmin: <password>Open the Reverse Tunnel Configuration menu.
configure reverse-tunnelPress A to add a new tunnel.
Enter the required settings:
Select 1 to enter a name for the tunnel. The name provided must be unique.
Select 3 to enter the hostname or IP address of the external device.
Select 4 to enter the username of an administrative user on the external device.
Select 5 to enter the password for the administrative user you provided.
Select 6 to specify which port on the external device will be used for tunneling SSH data. Trellix recommends using the first available port at 55022 (22) or above.
Select 7 to specify which port on the external device will be used for tunneling HTTPS data. Trellix recommends using the first port available at 55443 (43) or above.
(Optional) The new tunnel is enabled by default. To disable the tunnel, select 2 in the Configure Reverse Tunnel Settings menu.
Press S to save the tunnel configuration. The following message appears: The new configuration was successfully created.
Note
If you see the message
{"error":"Process exited with status 255"}, the user you are trying to initiate the tunnel connection with has an unsupported shell. You need to create a new user on the external device that you can use for the reverse tunnel connection.
Appendices
This part discusses these topics:
Common Access Card (CAC) for certificate authentication
This section covers the following information:
Enabling or Disabling the Policy Settings of the Web UI for Certificate Authentication on page 1
Configuring the User Attributes for Certificate Authentication on page 1
Logging in to the Web UI with Certificate Authentication on page 1
About CAC for certificate authentication
A Common Access Card (CAC) or a Personal Identity Verification (PIV) is a smart card that is used by many government employees for all user authentications. Both CAC and PIV use the X.509 standard for a Public Key Infrastructure (PKI) as an authentication mechanism to manage certificates.
The keys and the certificates are stored on the CAC card. CAC satisfies a two-factor authentication (2FA) requirement because you must place a physical card in a CAC reader and know a Personal Identification Number (PIN). The CAC card stores the public certificates and the corresponding private keys that belong to the user.
The certificate is automatically uploaded from the CAC card to the browser, and the user selects an installed certificate to log in. The user is prompted to enter a PIN. If the PIN is validated, the card unlocks a private key that is used to set up a TLS connection with the appliance. The certificate identifies the user and it is used to set up a TLS connection. If the certificate is verified and signed by a trusted Certificate Authority (CA) and has not been revoked, the user is authenticated and can log in to the Web UI. The private key never leaves the CAC card.
CAC for certificate authentication performs the following functions:
Authentication—Verifies the certificate date, obtains the revocation status of the X.509 certificate through the Online
Certificate Status Protocol (OCSP) or the Certificate Revocation List (CRL), and verifies the CA certificate chain.
Authorization—Maps the X.509 certificate fields to match an entry in the Active Directory (AD) or to match locally configured rules to permit or deny access to the Web UI.
⚠️Caution
When you enable certificate authentication on the Packet Capture appliance, Managed Defense integration with the appliance may not operate as expected. The Managed Defense service may not have access to the appliance through the Web UI or API if the
fe_servicesuser is required to use a certificate to log in for user authentication.
Task List for Configuring the Appliance to Use CAC for Certificate Authentication
Complete the steps for configuring the appliance to use CAC for authentication in the following order:
Log in to the configuration menu.
(Optional) Configure the LDAP settings if you intend to configure the LDAP server to authorize users. For details about how to configure an LDAP server, see User Management.
Download a CA certificate bundle or add an imported certificate to an existing bundle from a specified URL.
Enable policy settings to allow, require, or prohibit for certificate authentication. For details about how to enable policy settings of the Web UI, see Enabling or Disabling the Policy Settings of the Web UI for Certificate Authentication.
Configure user attributes for certificate authentication. For details about how to configure the user attributes for certificate authentication, see Configuring the User Attributes for Certificate Authentication.
(Optional) Configure OCSP so that the appliance can validate certificate revocation. For details about how to configure OCSP for certificate validation, see Adding the OCSP URL Using the Configuration Menu.
(Optional) Refresh the local Certificate Revocation List (CRL) file by downloading a new file from a specified remote location so that the Packet Capture appliance can validate certificate revocation. For details about how to refresh a local CRL file for certificate validation, see Refreshing a CRL File Using the Configuration Menu.
Configure LDAP mappings for authorization if you use an LDAP server to authorize users. For details about how to configure LDAP mappings for authorization, see Configuring LDAP for Authorization.
The user can log in to the Web UI for certificate authentication by entering the user name and password provided by the administrator, using a certificate, or both. For details about how to log in to the Web UI, see Logging in to the Web UI with Certificate Authentication.
Configuring a CA certificate bundle
You can configure Certificate Authority (CA) certificate bundles that are used to validate client certificates by using the appliance configuration menu.
Adding a CA Certificate to a Bundle Using the Configuration Menu
Deleting a CA Certificate From a Bundle Using the Configuration Menu
The Packet Capture appliance supports single PEM-encoded certificates. A set of intermediate and root CA certificates are used to validate the certificates from the CAC card before they are presented to the appliance. You can download a certificate bundle from a remote URL, import all the certificates to the appliance, and add the certificates to the specified bundle list.
The following important attributes are provided in the certificate:
Subject
Public Key
Serial Number
Valid to (expiration date)
Key Usage
Subject Alternative Name
Prerequisites
Admin access to the appliance.
(Optional) LDAP servers have been configured to authorize users. For details about how to configure an LDAP server, see User Management.
Adding a CA certificate to a bundle using the configuration menu
Use the menu options in this section to add a CA certificate to a bundle.
Note
The certificate name must already exist in the system.
To add a CA certificate to a bundle:
npadmin@px> configure cac
[sudo] password for npadmin: <password>========================================================
= CAC/PIV Manage CA Bundle CA
========================================================
Manage Client CA Bundles
1. Install Client CA Bundle
2. View Current Client CA Bundle
.........Press Enter to return CAC/PIV Manage CA Bundle configuration menu.
-----BEGIN CERTIFICATE-----
MIIG7DCCBNSgAwIBAgITIwAAAAlyrdyh37meTAAAAAAAjANBgkqhkiG9w0BAQsF
ADAOMTIwMAYDVQQDEyIGaXJlRXllVudGVycHJpc2UgRm9yZW5zaWNlIFRlY2cQ
Um9vdCBDQTAeFw0xOTAyMjAxMzUyMDAaFw0yOTAyMjAyMzUyMDAaMIGvMRMwEQYK
CZImiZPyLGQBGRYDY29tMRcwFQYKCZImiZPyLGQBG RYHZmlyZWV5ZTETMBEGCgmS
JomT8ixkARkwA2VuZzEWMBQGCgmSJomT8ixkARkwBnRlc3RhZDE6MDgGIAUEAxMx
RmlyZUVSZBFbnRlcnByaXJlZvc2ljyBUZXN0IEtldGVyMF0ZSB D
.........
-----END CERTIFICATE-----Enter configuration CAC mode.
Enter the default password for this appliance as provided by your administrator.
In the CAC/PIV configuration menu, select 6 to access the Manage Client CA Bundles menu. Press Enter.
Select 1 to add a certificate that already has been configured to the bundle.
Enter the name of the certificate bundle (for example, ca-chain.pem).
Select 2 to view the Privacy Enhanced Email (PEM) encrypted ASCII string of the certificate bundle.
Select X to exit the menu.
Deleting a CA certificate from a bundle using the configuration menu
Use the menu options in this section to delete a CA certificate from a bundle.
To delete a CA certificate from a bundle:
[sudo] password for npadmin: <password>========================================================
= CAC/PIV Manage CA Bundle CA
========================================================
Manage Client CA Bundles
.......................
3. Delete Client CA BundleEnter configuration CAC mode.
npadmin@px> configure cacEnter the default password for this appliance as provided by your administrator.
In the CAC/PIV configuration menu, select 6 to access the Manage Client CA Bundles menu. Press Enter.
Select 3 to delete a CA certificate from a bundle.
In the confirmation message, enter y to delete a CA certificate, and then press Enter.
Select X to exit the menu.
Enabling or disabling the policy settings of the Web UI for certificate authentication
The administrator can make certificate authentication optional, required, or disabled.
Optional—The user can log in to the Web UI using the user name and password provided by the administrator or using a certificate. For details, see Logging in to the Web UI for Certificate Authentication.
Required—The user must use a certificate to log in to the Web UI. For details, see Logging in to the Web UI for Certificate Authentication.
Disabled—The user cannot log in using a certificate.
Note
You cannot use other authentication methods that are already configured to log in to the Web UI.
Note
Certificate authentication settings are disabled by default.
Prerequisites
Admin access to the appliance.
(Optional) LDAP servers have been configured to authorize users. For details about how to configure an LDAP server, see User Management.
A Certificate Authority (CA) certificate bundle has been downloaded, and an imported certificate has been added to an existing bundle from a specified URL.
Enabling or Disabling the Policy Settings of the Web UI for Certificate Authentication Using the Configuration Menu
Use the menu options in this section to allow or require certificate authentication in the Web UI.
To enable or disable the policy settings of the Web UI for certificate authentication:
[sudo] password for npadmin: <password>Enter configuration CAC mode.
npadmin@px> configure cacEnter the default password for this appliance as provided by your administrator.
In the CAC/PIV configuration menu, select 1 and select an option:
Optional—Users can log in to the Web UI either using the user name and password provided by their administrator or using an optional X.509 certificate.
Required—Users must log in using a client X.509 certificate for user authentication.
Disabled—The appliance does not accept a client X.509 certificate. Users must log in with user name and password.
Select S to save your settings and exit the menu.
Checking for revoked certificates
You can enable the Packet Capture appliance to check for revoked certificates and reject them by using the appliance configuration menu:
Both the Online Certificate Status Protocol (OCSP) and the Certificate Revocation List (CRL) protocol are used to validate whether an X.509 certificate has been revoked. If the CRL is configured on the Packet Capture appliance, the CRL is used first for certificate verification and then OCSP. By default, OCSP is enabled so that the appliance can verify the status of the certificate.
OCSP servers are also referred to as OCSP responders. OCSP allows the appliance to check if a certificate has been revoked without downloading and searching the entire list. If an OCSP URL is found in the certificate, the OCSP responder is queried to determine the status of the certificate revocation. If an OCSP URL is not found in the certificate or the appliance cannot communicate with the OCSP responder from the certificate, a configured default URL is used.
A CRL contains a list of certificates that have been revoked or can no longer be trusted. When a TLS connection is set up with the appliance, part of the authentication process is to validate that the certificate is not listed in the CRL. Each entry in the list corresponds to the certificate number and the date the certificate was revoked.
Prerequisites
Admin access to the appliance.
(Optional) LDAP servers have been configured to authorize users. For details about how to configure an LDAP server, see User Management.
A Certificate Authority (CA) certificate bundle has been downloaded, and an imported certificate has been added to an existing bundle from a specified URL.
Certificate authentication has been enabled. For details about how to enable policy settings of the Web UI, see Enabling or Disabling the Policy Settings of the Web UI for Certificate-Based Authentication.
A CRL file has already been installed.
Configuring local CRL file updates using the configuration menu
Use the menu options in this section to configure local Certificate Revocation List (CRL) file updates. You can configure how often the Packet Capture appliance downloads a new local or remote CRL file and specify the remote location of a CRL file.
To configure local CRL file updates:
[sudo] password for npadmin: <password>
==================================================================
= CAC/PIV Config CRL CRL
==================================================================
Configure Cert Revocation List
1. Enable CRL Retrieval [true]
2. Retrieval URL []
3. Retrieval interval (hours) [0]
Provided by user [false]The URL is specified with remote server Administrator credentials (<username> and <password>), the remote server (<hostname>), the path and filename in which to save the certificate bundle (<path/filename>) in the following format:
scp://<username>[:<password>]@<hostname>/<path/filename>Note
If you do not include the password, the configuration menu prompts for the password and obfuscates the keyboard input as you type it.
Enter configuration CAC mode.
npadmin@px> configure cacEnter the default password for this appliance as provided by your administrator.
In the CAC/PIV configuration menu, select 4 to access the
Configure Certificate Revocation Listmenu. Press Enter.Select 1 to enable the Packet Capture appliance to automatically download a local CRL file.
Select 2 to download a local CRL file from a specified URL to the appliance.
Enter the URL of the direct path to the certificate file.
Select 3 to set the time interval in hours for how often the appliance downloads a new CRL file.
Select X to exit the menu.
Adding the OCSP URL using the configuration menu
Use the menu options in this section to add the verification OCSP URL so that the appliance can validate certificate revocation.
To add the verification OCSP URL:
[sudo] password for npadmin: <password>The configuration of the OCSP URL is displayed in the CAC/PIV configuration menu.
Enter configuration CAC mode.
npadmin@px> configure cacEnter the default password for this appliance as provided by your administrator.
In the CAC/PIV configuration menu, select 2 to add the verification OCSP URL. Press Enter.
Enter the verification OCSP URL so that certificate revocation can be validated. Press Enter.
Select S to save your settings and exit the menu.
Adding a local CRL file using the configuration menu
Use the menu options in this section to add a local Certificate Revocation List (CRL) file to the Packet Capture appliance. Only one
CRL file can be present on the system.
To add a local CRL file:
[sudo] password for npadmin: <password>===========================================================================
= CAC/PIV Manage CRL CRL
===========================================================================
Manage Cert Revocation List
1. Install CRL
2. View Current CRL
........-----BEGIN X509 CRL-----
MIIC3jCBxwIBATANBgkqhkiG9w0BAQsFADA0MTIwMAYDVQQDEylGaXJlRXlIEVu
dGVycHJpc2UgRm9yZW5zaW5nIFrlc3QgUm9vdCBDQ0cNMTkwMjE5MjIxMDM2WhcN
Mzk wMjIwMTAzMDIxWqBfMF0wHwYDVROjBBgwFoAUKxsMtzoR3wEUm7DBjnOOW8y9
wpYwEAYJKwYBBAGCNxUBBAMCAQAwCgYDVVR0UBAMCAQIwHAYJKwYBBAGCNxUEBA8X
DTM5MDIxOTIyMjAzSEl8g9k5YgXg0UH7ouRR41S006XIFJIlmfQyJS/x1Es+dy5M
CPqvV9s3vOpPoRW+CkIEWbmYYdUT5gh3jCahyhIGQDVb/89pThW+QO/qW52yzu6g
0yL+PjLfa1PSTLyNJWtLhKjwzzMqwzWZp
-----END X509 CRL-----Enter configuration CAC mode.
npadmin@px> configure cacEnter the default password for this appliance as provided by your administrator.
In the CAC/PIV configuration menu, select 7 to access the Manage Certificate Revocation List menu. Press Enter.
Select 1 to add the local CRL file to the appliance.
Enter the name of the local CRL file that was installed previously on the appliance.
Select 2 to verify the content of the CRL file.
Select X to exit the menu.
Deleting a CRL file using the configuration menu
Use the menu options in this section to delete a specified Certificate Revocation List (CRL) file from the appliance.
To delete a local CRL file:
[sudo] password for npadmin: <password>===========================================================================
= CAC/PIV Manage CRL CRL
===========================================================================
Manage Cert Revocation List
........3. Delete CRL
........Enter configuration CAC mode.
npadmin@px> configure cacEnter the default password for this appliance as provided by your administrator.
In the CAC/PIV configuration menu, select 7 to access the Manage
Certificate Revocation Listmenu. Press Enter.Select 3 to delete a CRL file from the appliance.
In the confirmation message, enter y to delete a CRL file, and then press Enter.
Select X to exit the menu.
Refreshing a CRL file using the configuration menu
Use the menu options in this section to refresh a local Certificate Revocation List (CRL) file by downloading a new file from a specified remote location so that the Packet Capture appliance can validate certificate revocation. Only one CRL file can be present on the system. When you download a new CRL file, the existing CRL file is automatically deleted.
Note
You must specify the URL of the direct path to the certificate file.
To refresh a local CRL file:
[sudo] password for npadmin: <password>
==========================================================================
= CAC/PIV Manage CRL CRL
==========================================================================
Manage Cert Revocation List
........
4. Refresh CRL
Enter configuration CAC mode.
npadmin@px> configure cacEnter the default password for this appliance as provided by your administrator.
In the CAC/PIV configuration menu, select 7 to access the Manage
Certificate Revocation Listmenu. Press Enter.Select 4 to refresh a CRL file by downloading a new file from a specified URL to the appliance.
Select X to exit the menu.
Configuring the user attributes for certificate authentication
An administrator uses the information from the X.509 certificate to identify the user and assign user roles that allow the user to perform certain operations on the appliance. The following table describes the user attributes that are used for certificate authentication.
Attribute | Description |
|---|---|
x509-cert-subject | The Distinguished Name (DN) in the Subject field in the certificate. Each entry has a unique identifier. The following example shows the DN format for CAC: |
x509-cert-subject-cn | Common Name (CN) entry from the DN attribute in a certificate. For example, CN=Test Cardholder. |
x509-cert-san-email | The email address in the Subject Alternative Name (SAN) field of the certificate. You are allowed to have multiple subfields for SAN. |
x509-cert-san-email-username | The user name of the email address without the domain name in the certificate. |
x509-cert-san-upn | User Principal Name (UPN) encoded in the Other Name field of the SAN field in the certificate. |
x509-cert-san-upn-username | Username of the UPN attribute in the certificate. |
Prerequisites
Admin access to the appliance.
(Optional) LDAP servers have been configured to authorize users. For details about how to configure an LDAP server, see User Management.
A Certificate Authority (CA) certificate bundle has been downloaded, and an imported certificate has been added to an existing bundle from a specified URL.
Certificate authentication has been enabled. For details about how to enable policy settings of the Web UI, see Enabling or Disabling the Policy Settings of the Web UI for Certificate-Based Authentication.
Configuring the user attributes for certificate authentication using the configuration menu
Use the menu options in this section to configure the user attributes for certificate authentication.
To configure the user attributes for certificate authentication:
[sudo] password for npadmin: <password>
Enter configuration CAC mode.
npadmin@px> configure cacEnter the default password for this appliance as provided by your administrator.
In the CAC/PIV configuration menu, select 3 to configure one of the following user attributes:
x509-cert-subject— Specifies the name in the subject field in the certificate.x509-cert-subject-cn— Specifies the Common Name (CN) from the DN attribute in the certificate.x509-cert-san-email— Specifies an email address in the Subject Alternative Name (SAN) field of the certificate. You are allowed to have multiple subfields for SAN.x509-cert-san-email-username— Specifies the user name of the email address without the domain name in the certificate.x509-cert-san-upn— Specifies the User Principal Name (UPN) that is encoded in the "Other Name" field of the SAN field in the certificate.
Select S to save your settings and exit the menu.
Configuring LDAP for authorization
If you configured an LDAP server to authenticate users, you can configure LDAP mappings for authorization by using the appliance configuration menu:
Selecting the Authorization Type Using the Configuration Menu on page 1
Configuring an Active Directory Server Using the Configuration Menu on page 1
Configuring User Mapping Groups for Authorization Using the Configuration Menu on page 1
When the appliance needs to determine the identity of the user, the Subject Alternative Name (SAN) extension with the User Principal Name (UPN) extension in the certificate can be used as an identifier when matching the certificate to an entry in the Active Directory (AD), which is supported by the LDAP protocol.
When the certificate is validated, the AD server uses the Principal Name field (Principal Name=user@fully.qualified.domain.name) in the SAN with the UPN of the certificate to search for the user in the Active Directory. The server permits or denies access to the Web UI based on the matched fields.
The user schema name and login name for the LDAP attribute are used to match the configured certificate authorization field. An administrator can configure the LDAP record to map the login name. An administrator can define an LDAP search filter in the configuration that controls which users can log in using a certificate and then can be authorized using LDAP.
Prerequisites
Admin access to the appliance.
LDAP servers have been configured to authorize users. For details about how to configure an LDAP server, see User Management on page 1.
A Certificate Authority (CA) certificate bundle has been downloaded, and an imported certificate has been added to an existing bundle from a specified URL.
Certificate authentication has been enabled. For details about how to enable policy settings of the Web UI, see Enabling or Disabling the Policy Settings of the Web UI for Certificate-Based Authentication on page 1.
User attributes for certificate authentication have been configured. For details about how to configure the user attributes for certificate authentication, see Configuring the User Attributes for Certificate Authentication on page 1.
Online Certificate Status Protocol (OCSP) has been configured so that the appliance can validate certificate revocation. For details about how to configure OCSP for certificate revocation, see Adding the OCSP URL Using the Configuration Menu on page 1.
Selecting the authorization type using the Configuration menu
Use the menu options in this section to select a specific authorization method.
To select the authorization type:
[sudo] password for npadmin: <password>
==================================================================
= CAC/PIV Config Authorization Auth
==================================================================
Configure CAC Authorization
1. Authorization mapping type [LDAP]
........
Press Enter.
Enter configuration CAC mode.
npadmin@px> configure cacEnter the default password for this appliance as provided by your administrator.
In the CAC/PIV configuration menu, select 5 to access the
Configure CAC Authorizationmenu.Select 1 to choose the LDAP or Default - UIAPI authorization methods.
Select S to save your settings and exit the menu.
Configuring an Active Directory server using the Configuration menu
Use the menu options in this section to configure Active Directory authentication. Because Active Directory (AD) supports the LDAP protocol, the Packet Capture appliances can also authenticate through an AD server.
The binding user or bind-dn in the Packet Capture configuration is a read-only user that is used to query the directory structure starting from the base-dn.
To configure Active Directory authentication:
[sudo] password for npadmin: <password>================================================================
= CAC/PIV Config Authorization Auth
================================================================
Configure CAC Authorization
........
2. Configure LDAP server
........================================================================
= CAC/PIV Config Authorization LDAP Server LDAP
================================================================
Configure LDAP Server
1. Host type []
2. Host:Port[:0]
3. Encryption type []
4. Verify server certificate [false]
5. Base DN []
6. Bind DN []
7. Bind password [.........]Press Enter.
Press Enter.
Press Enter.
Press Enter.
Press Enter.
Press Enter.
Enter configuration CAC mode.
npadmin@px> configure cacEnter the default password for this appliance as provided by your administrator.
In the CAC/PIV configuration menu, select 5 to access the Configure CAC Authorization menu.
Select 2 to configure an Active Directory server. The Configure LDAP Server menu displays.
Select 1 to set the host type (for example,
active-directory).Select 2 to configure the host to send LDAP authentication requests. Use the hostname or IP address of the AD server.
Select 3 to choose the type of encryption (TLS or STARTTLS) for secure connections between the appliance and the Web browser running the Web UI, and to verify remote servers for various client applications. STARTTLS takes an existing insecure connection and upgrades it to a secure connection using SSL/TLS.
Press Enter.
Select 4 to verify a server certificate from a public certificate authority (CA).
Select 5 to configure the LDAP user search base (for example, [DC=testad,DC=eng,DC=fireeye,DC=com]).
Select 6 to set the Distinguished Name used to bind to the server (for example, [CN=eng-pxbind,OU=UtilityAccounts,OU=Engineering,DC=testad,DC=eng,DC=fic=com]). Press Enter.
Select 7 to configure the credentials used to bind to the server (for example, P2ssw0rd!).
Select S to save your settings and exit the menu.
Configuring user mapping groups using the Configuration menu
Use the menu options in this section to configure user mapping groups for authorization.
To configure user mapping groups:
[sudo] password for npadmin: <password>================================================================
= CAC/PIV Config Authorization Auth
================================================================
Configure CAC Authorization
.........
3. Configure LDAP mapping================================================================
= CAC/PIV Config Authorization LDAP Mapping LDAP
================================================================
Configure LDAP Mapping1. UIAPI group mapping field []
2. SUDO group mapping field []
3. Username schema attribute []Press Enter.
Press Enter.
Press Enter.
Enter configuration CAC mode.
npadmin@px> configure cacEnter the default password for this appliance as provided by your administrator.
In the CAC/PIV configuration menu, select 5 to access the Configure CAC Authorization menu.
Select 3 to configure LDAP mappings for authorization. The Configure LDAP Mapping menu displays.
Select 1 to add the user attributes for the X.509 certificates to the uiapi group mapping field for authorization (for example, [CN=eng-pxuiapi,OU=AdminGroups,OU=Engineering,DC=testad,DC=eng,DC=fireeye,DC=com]).
Select 2 to add the user attributes for the X.509 certificates to the sudo group mapping field for authorization (for example, [CN=eng-pxadmin,OU=AdminGroups,OU=Engineering,DC=testad,DC=eng,DC=fireeye,DC=com]).
Select 3 to add the user schema name and login name for the LDAP attribute.
Select S to save your settings and exit the menu.
Logging in to the Web UI with certificate authentication
You can log in to the Web UI with certificate authentication by entering your account name and password provided by the administrator, using a certificate, or both.
To log in to the Web UI when a certificate is mandatory for user authentication:
Go to
https://<appliance>in the browser, where<appliance>is the IP address or hostname of the appliance. For example, if the configured IP address of the appliance is 10.1.0.1, enterhttps://10.1.0.1.On the login page, click Log in with CAC/PIV.
To log in to the Web UI when a certificate is optional for user authentication:
Go to
https://<appliance>in the browser, where<appliance>is the IP address or hostname of the appliance. For example, if the configured IP address of the appliance is 10.1.0.1, enterhttps://10.1.0.1.On the login page, choose one of the following options:
Enter the account name and password your administrator provided and click Log in.
Click Log in with CAC/PIV.