The Pie Chart widget is similar to the Bar Graph except it displays the data in the form of a pie graph.
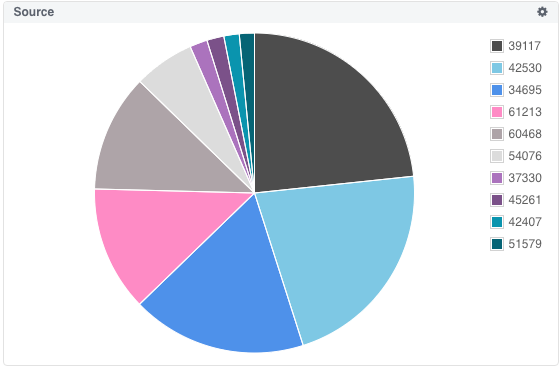
To add a pie chart to your dashboard:
From the selected dashboard, click the Add Component button and select Pie Chart.
Name the widget.
Select the field filter from the Field drop-down menu.
Click Add Component to save the pie chart to your dashboard.
Click the search icon in the Query Bar to run your query and display the results.