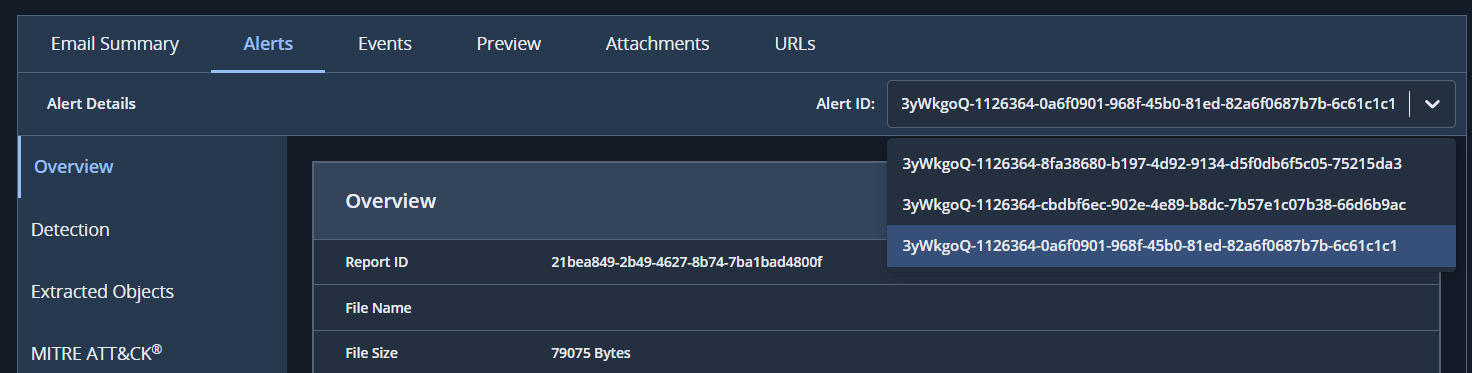
The Alerts page contains all the details about the alert, file details, signatures and execution dates and times. This page also displays rules triggered, extracted objects and samples mapped to the MITRE ATT&CK® matrix. You can use the dropdown menu to view all the related alert IDs.
The Alerts tab includes the following sections:
Overview
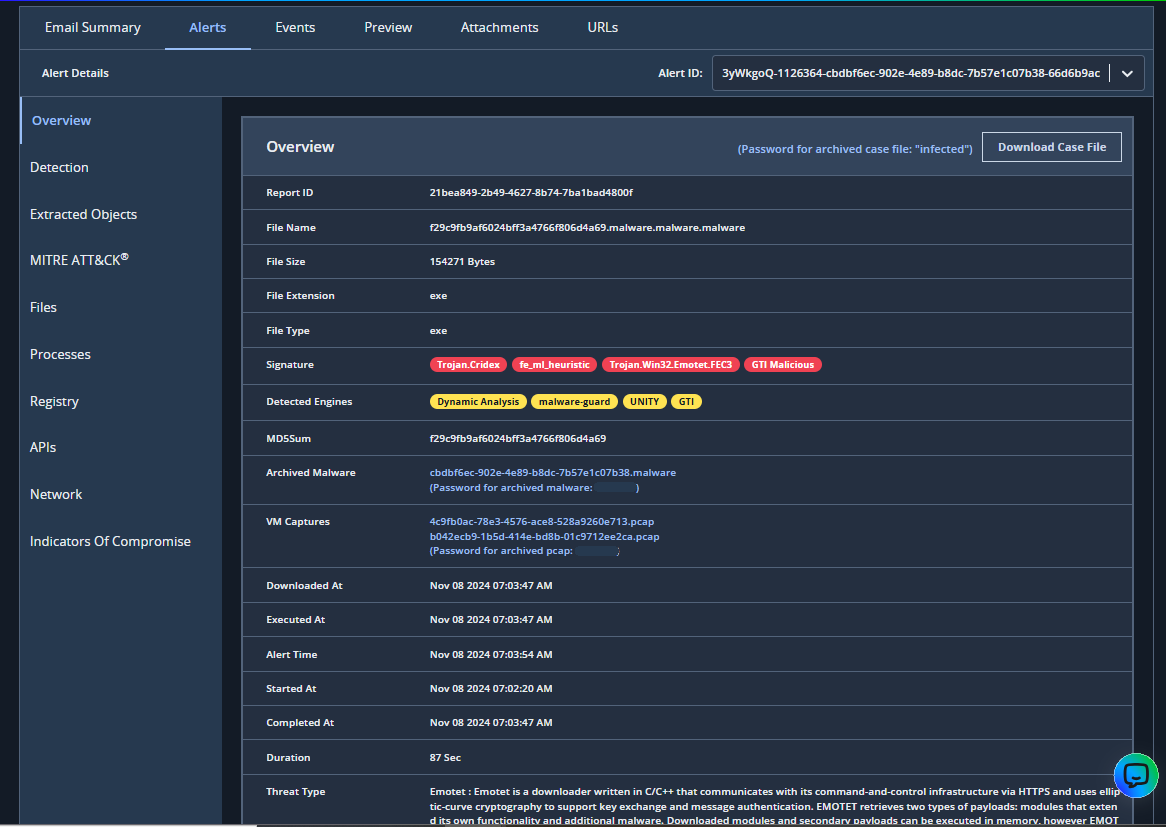
The Overview page shows the basic information like file details, signature, detected engines, MD5SUM, archived malware, VM captures and time periods.
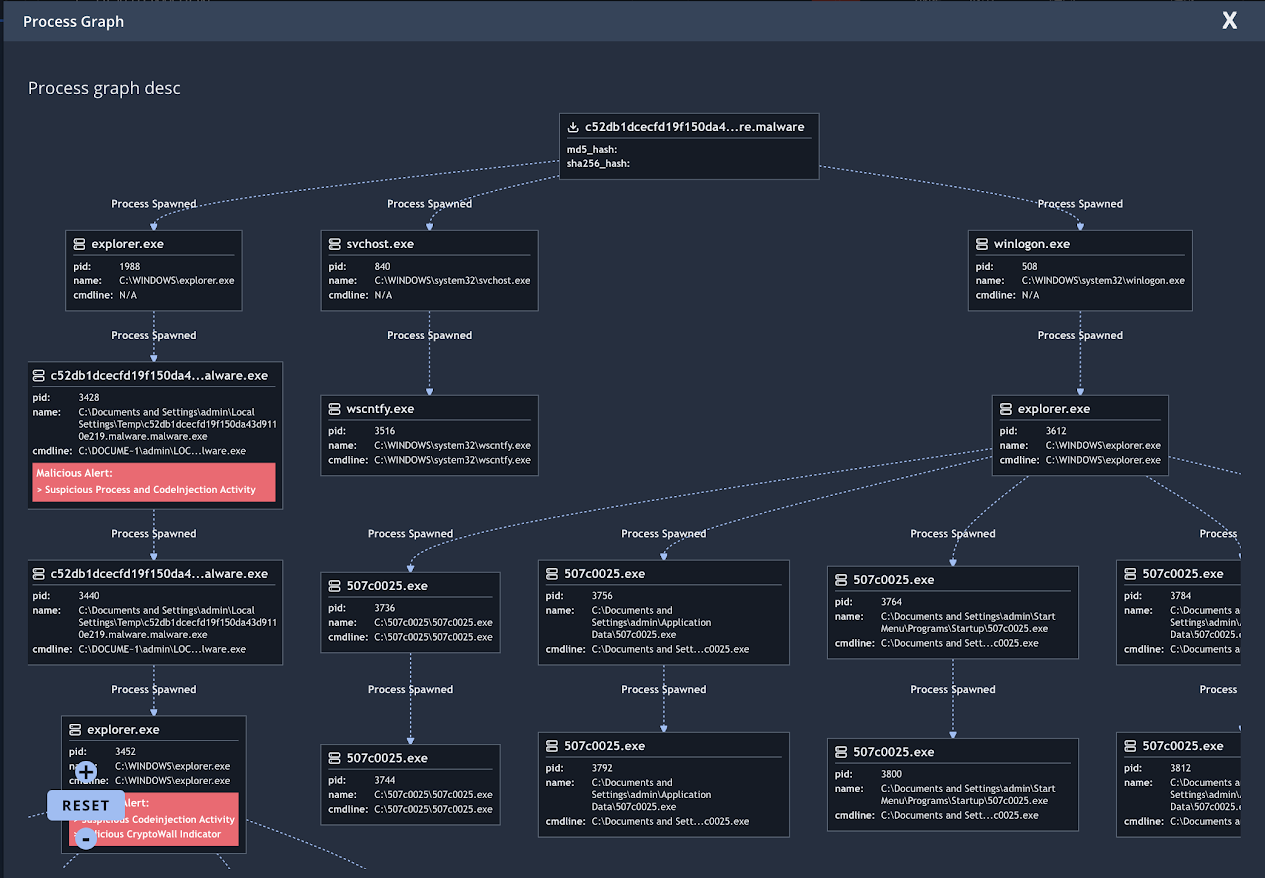
Scroll further down to view the URL analysis section and the process graph. You can access the FAUDE analysis screenshot in this section.

The process graph displays the graph of the URL or attachment found in the email and any processes that it spawned. For each spawned process, the graph displays the process ID, process name, and command line. Click the .png) button on the top-right to expand the window.
button on the top-right to expand the window.
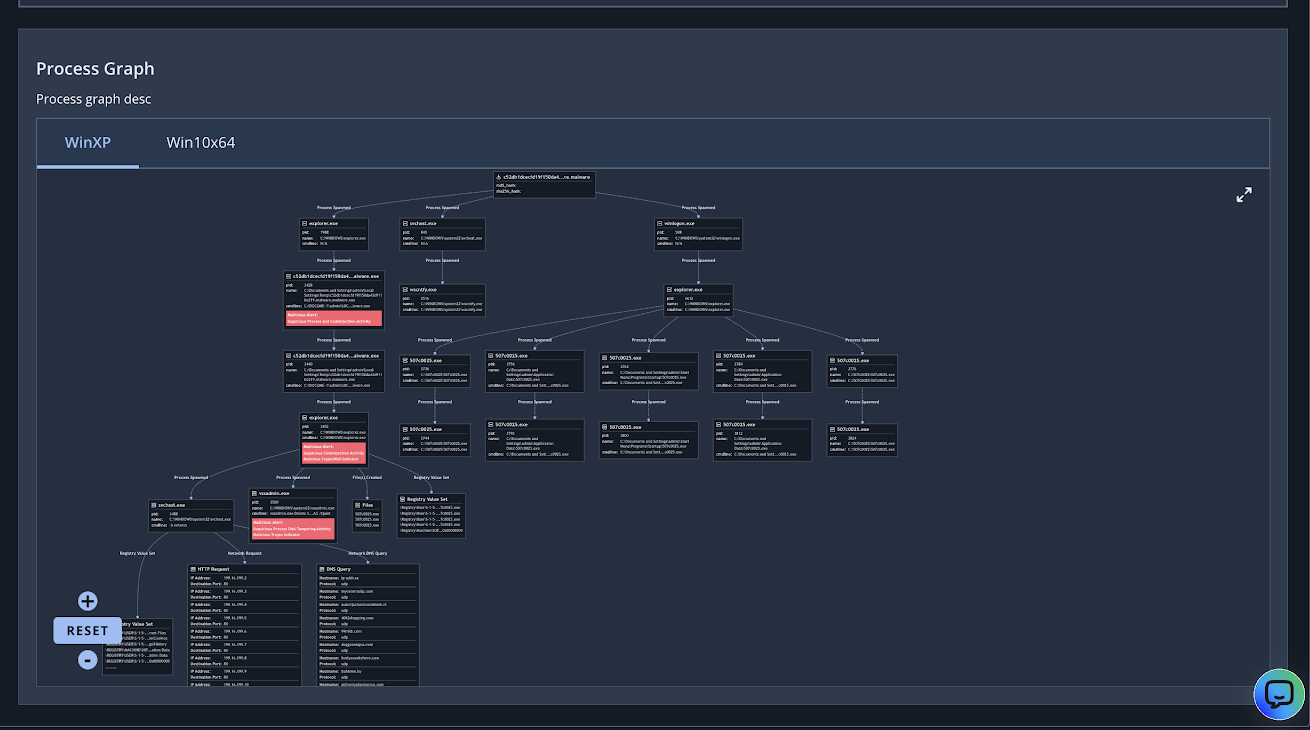
Use the + and - buttons to zoom in and zoom out the process graph respectively. Left click and hold the mouse button to pan/move around the graph. Use the Reset button to reset the zoomed view of the graph. Use the X button on the top-right to exit the expanded view.
Detection
The Detection page lists all the rules that were triggered by the sample.
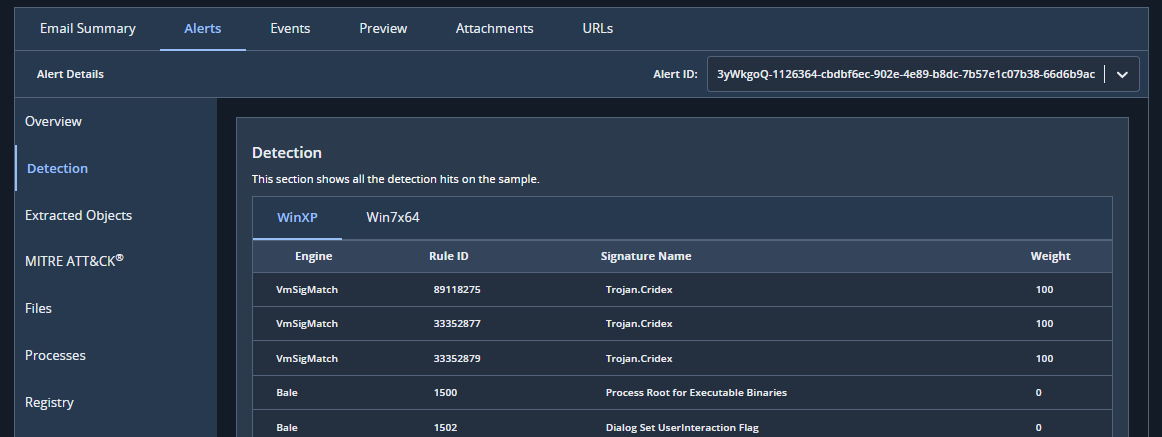
The following table describes the information on the Detection page:
Column | Description |
|---|---|
Engine | The name of the engine that detected the sample. |
Rule ID | The number of the rule triggered during analysis of the sample. |
Signature Name | The name of the threat group associated with the sample. |
Weight | The score assigned to the signature. If the score is greater than or equal to 100, the sample is malicious. |
Extracted objects
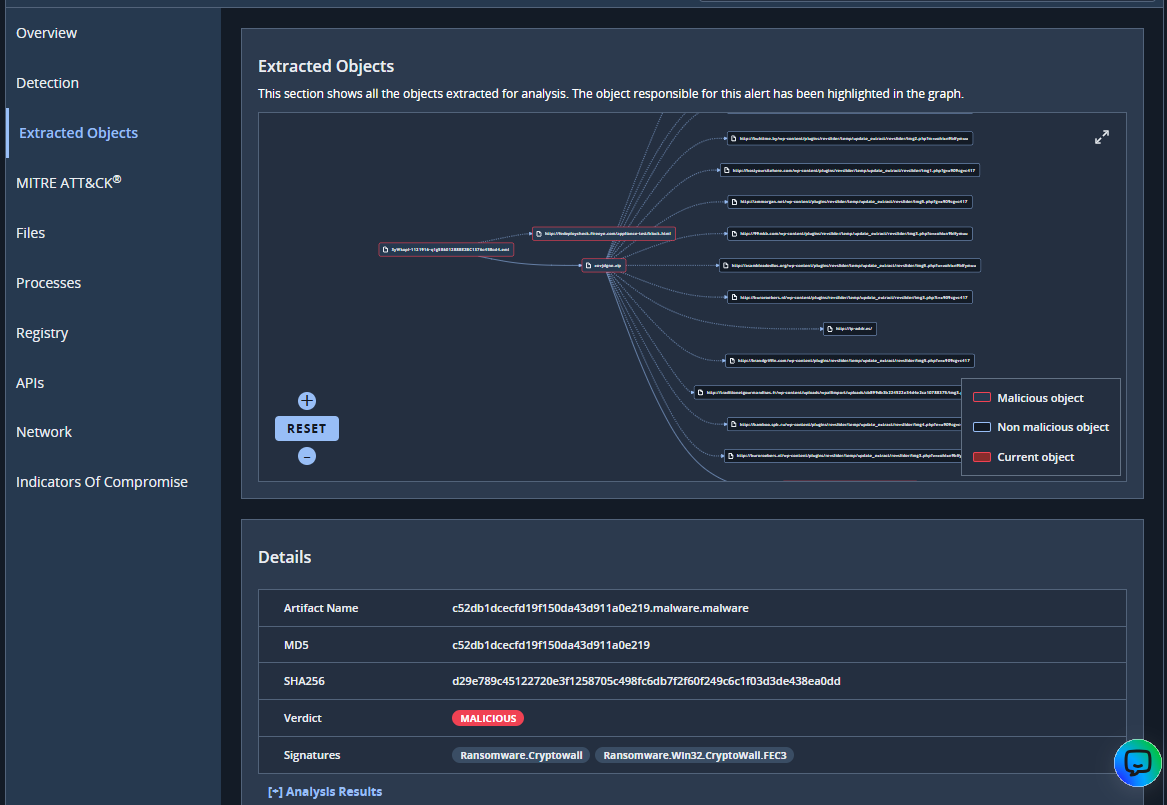
The Extracted Objects page is divided into two sections: Graph and Details.
Graph
This section displays a graphical representation of the objects extracted from the sample during analysis.
Details
This section displays detailed analysis results of each extracted object. The object name, hash values, verdict, and any associated signatures are listed. For any sample with a verdict of Custom Riskware, Malicious, or Riskware, you can expand the plus icon to view the Analysis Results. This provides more information, such as the detection engine that analyzed the sample, the weight, and the signature.
MITRE ATT&CK®
On the MITRE ATT&CK® Mapping page, any rules triggered by the sample are mapped to the MITRE ATT&CK® matrix. The MITRE ATT&CK® matrix contains a set of techniques used to accomplish specific objectives, or tactics, from gathering information about the target person or group, to extracting information from that target.
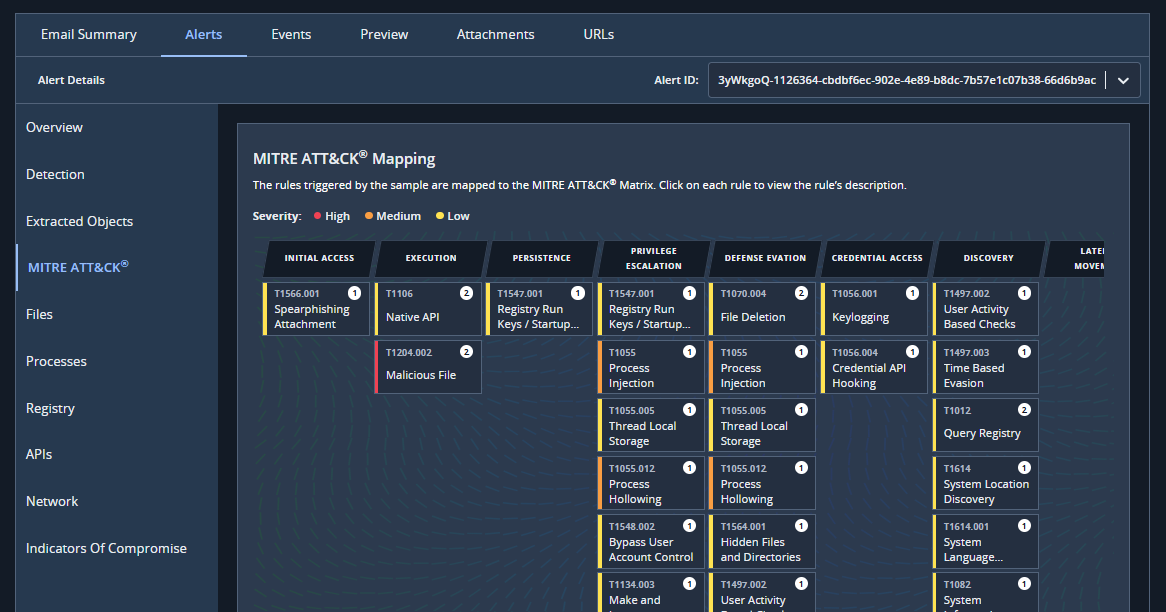
For more information, click on a rule. The following table gives more information on each tactic:
Tactic | Description |
|---|---|
Initial access | Attempting to gain access to your system. For example, using a phising campaign. |
Execution | Running malicious code on your system. |
Persistence | Attempting to maintain access to your system. |
Privilege execution | Attempting to gain higher level permissions on your system |
Defense evasion | Attempting to avoid detection on your system. |
Credential access | Attempting to gain access to user names and passwords, for example by key logging. |
Discovery | Exploring your system to see what can be accessed and controlled. |
Lateral movement | Using legitimate credentials to move through your system. |
Collection | Gathering information of interest to the attacker. |
Command and control | Communicating with compromised systems to control them. |
Exfiltration | Stealing data from your system. |
Impact | Manipulating, interrupting, or destroying systems and data. For example, using ransomware to encrypt data. |
Files
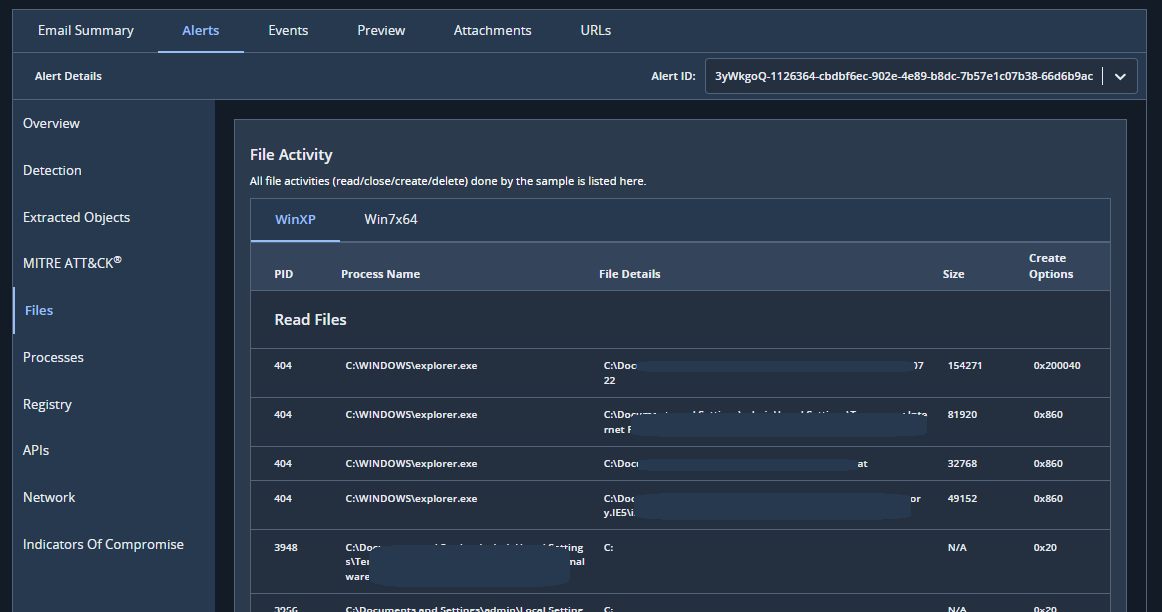
The Files pages lists all files that were accessed by the sample. All files that were read, edited, created, or deleted are shown in separate tables. The following table describes the information on the Files page:
Column | Description |
|---|---|
PID | The unique number assigned to identify the process. |
Process Name | The name of the process accessed by the sample. |
File Details | The path name of the file that was read, edited, created, or deleted. |
Size | The size of the file that was read, edited, created, or deleted. |
Create Options | The options applied when the file was read or created. |
Processes
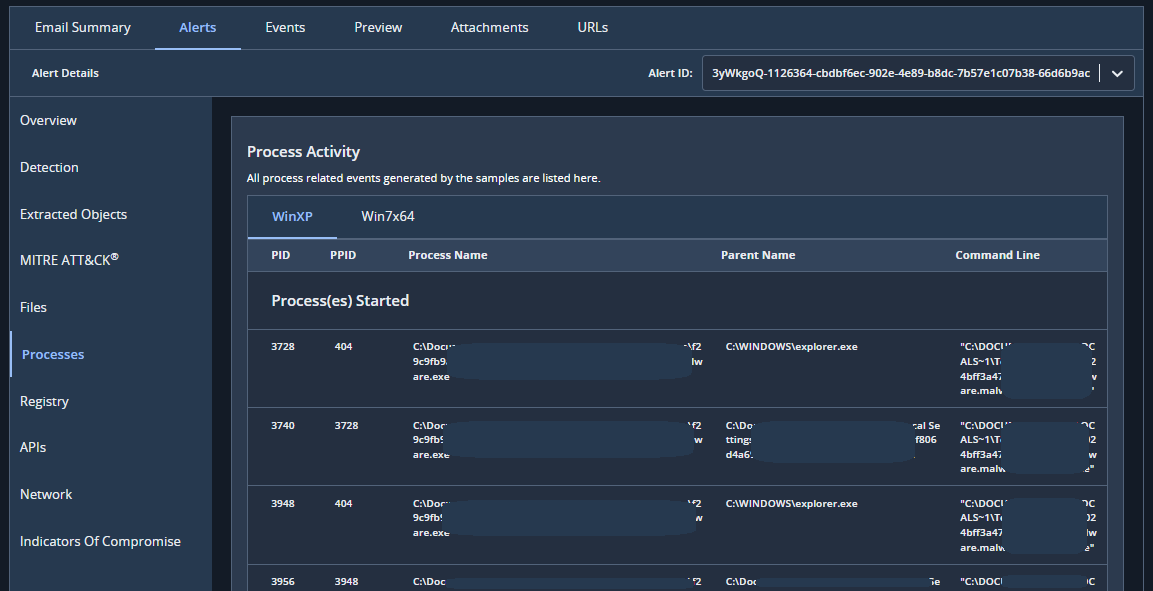
The Processes pages lists all process started or terminated by the sample. The following table describes the information on the Processes page:
Column | Description |
|---|---|
PID | The unique number assigned to identify the process. |
PPID | The unique number assigned to identify the parent process. |
Process Name | The name of the process accessed by the sample. |
Parent Name | The name of the parent process accessed by the sample. |
Command Line | The command, and the parameters used, to run the operation on the process. |
Registry
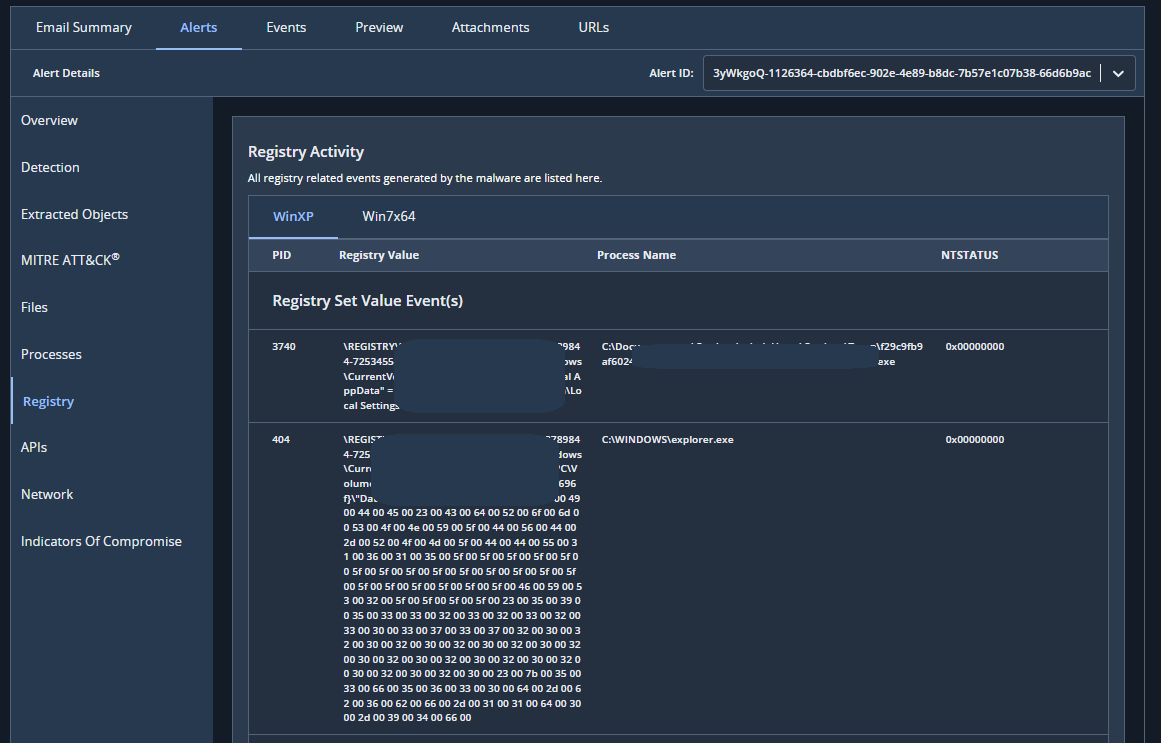
The Registry page shows all queries to registry events and changes to registry events. The following table describes the information on the Registry page:
Column | Description |
|---|---|
PID | The unique number assigned to identify the process. |
Registry Value | The registry value that was queried or changed. |
Process Name | The name of the process associated with the registry value. |
NTSTATUS | These values communicate system information. |
APIs
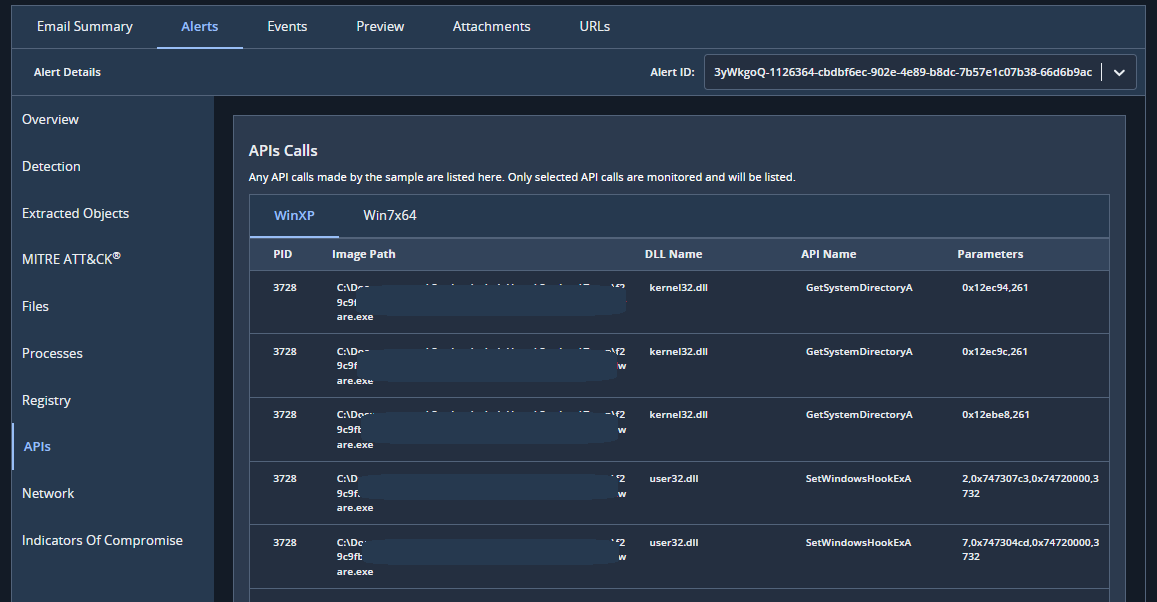
The APIs page shows selected API calls made by the sample. The following table describes the information on the API page:
Column | Description |
|---|---|
PID | The unique number assigned to identify the process |
Image Path | The file path to the process run by the sample. |
DLL Name | The name of the library accessed by the API call. |
API Name | The name of the API called by the sample |
Parameters | The parameters applied to the API. |
Network
The Network page is split into three sections: Callbacks, Network Anomalies, and Network Events.
Callbacks
A network callback is sent by a threat to collect data and control a system remotely.
Network anomalies
A network anomaly is a sudden, but short-lived, change from the expected operation of the network. This may indicate that your system has been infected with malware.
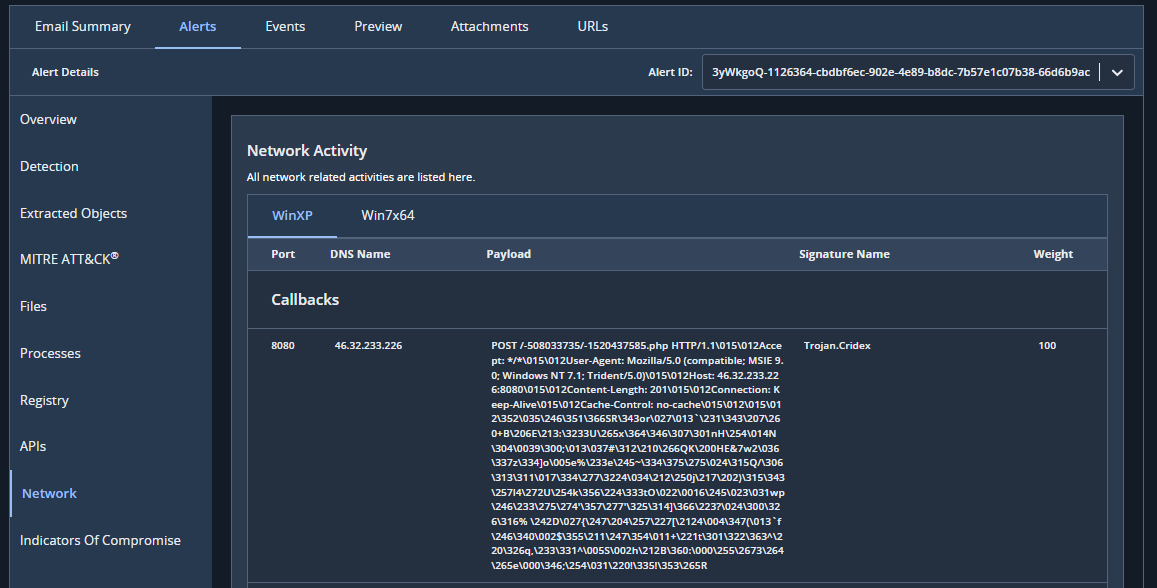
The following table describes the information on the Callbacks and Network Anomalies section:
Column | Description |
|---|---|
Port | The port number of the network process. |
DNS Name | The Domain Name System name. |
Payload | The data embedded in the network call. |
Signature Name | The name of the threat group behind a malicious attack. |
Weight | The score assigned to the signature. If the score is greater than or equal to 100, the sample is malicious. |
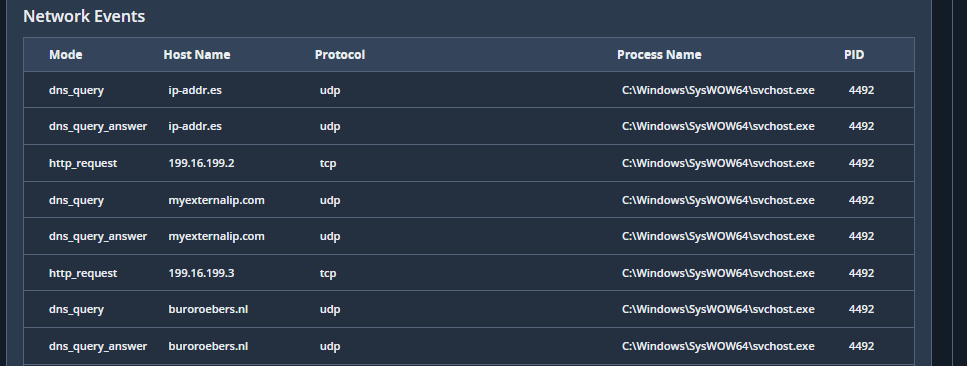
The following table describes the information on the Network Events section:
Column | Description |
|---|---|
Mode | The type of network event, such as DNS query, listen, and so on. |
Host Name | IP address or host name of the destination. |
Protocol | The type of network event. |
Process Name | The name of the process accessed by the sample. |
PID | The unique number assigned to identify the process. |
Indicators Of Compromise
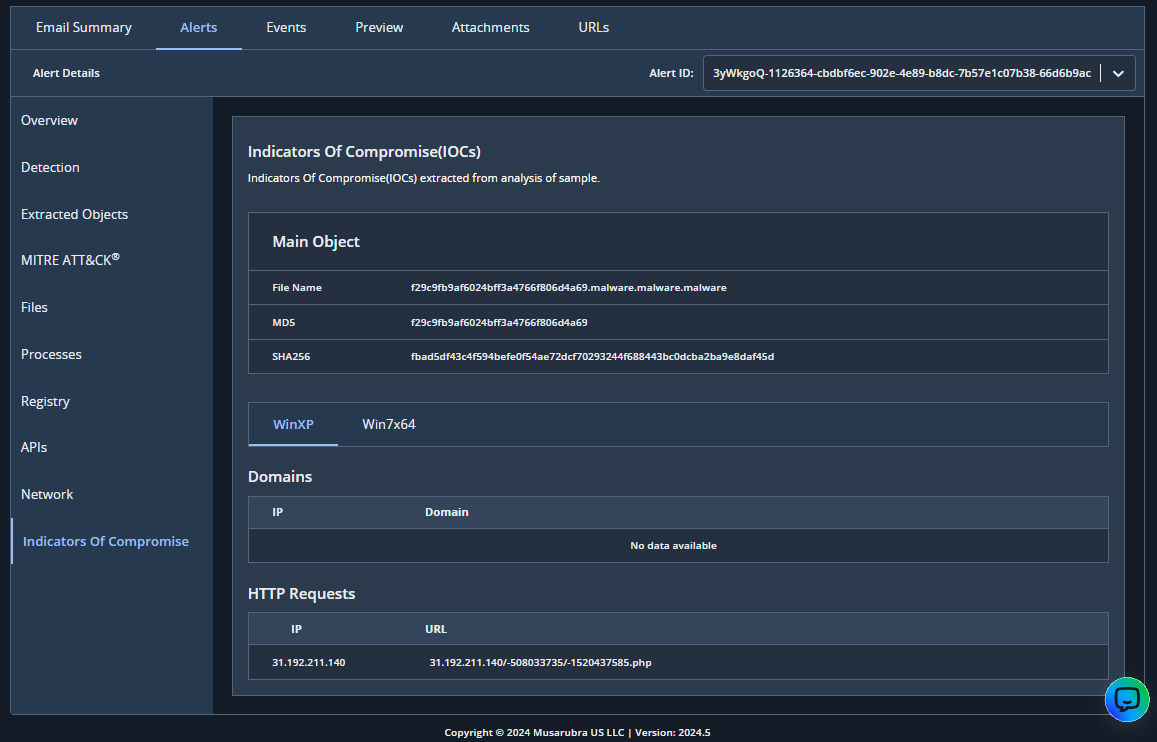
All Indicators of Compromise that were extracted during the analysis are shown on the IOCs page. If an IOC is extracted during analysis, then your system may have been compromised. The name, MD5 hash, and SHA256 hash are displayed for the main object and any associated files.
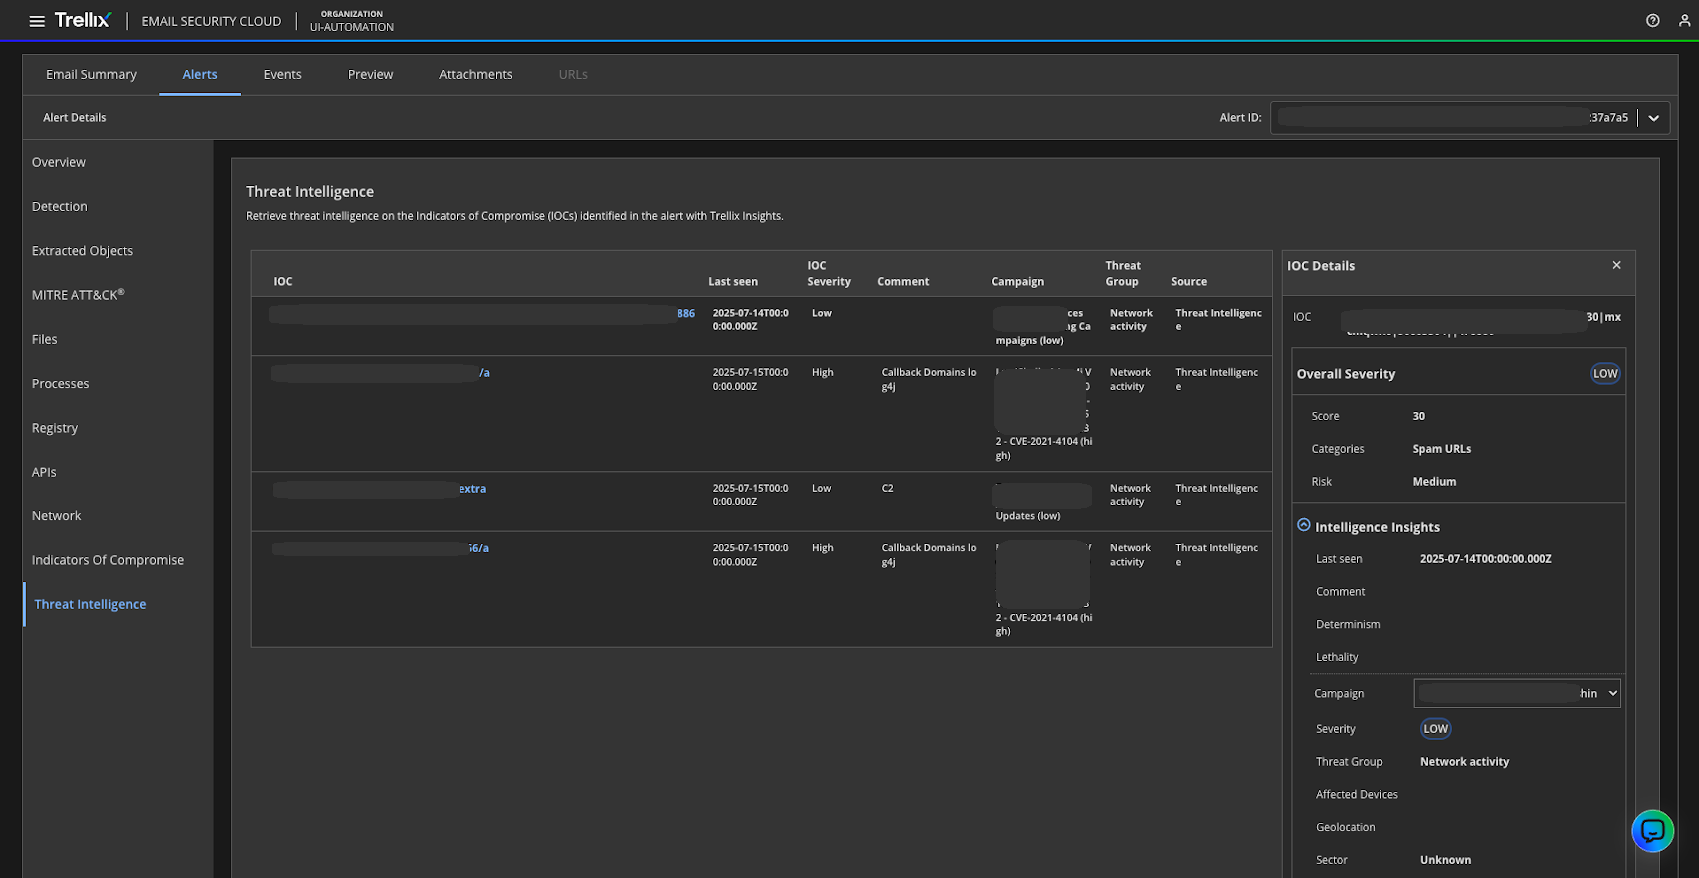
Threat Intelligence
This page displays the threat intelligence identified on the Indicators of Compromise (IOCs) in the alert using Trellix Insights. You can also view last seen, severity, campaign details and source for each IOC. To know more, click on any of the IOC in the first column to open the IOC Details side panel. The side panel shows the overall severity, a list of campaigns. Select a campaign from the drop-down menu for the campaign details in the Description section.