The Email Security - Cloud homepage has two tabs: Dashboard and Exec Summary.
The dashboard tab provides a range of email threat information at a glance. Data is collected from the ongoing defense of your organization's email and aggregated for you to view. The dashboard provides an overview of malicious email attacks against your organization and includes system information such as mail traffic and metrics on the types of alerts that the system has detected.
The exec summary tab displays your executive summary report. For more information, see Email executive summary.
If you have the Trellix Email Security for Microsoft O365 license for both Email Security - Cloud and IVX Cloud products, your dashboard will also have a tab for IVX Cloud.
The IVX Cloud tab provides a broad overview of files submitted for analysis, as well as the status of your subscription for the selected date range. It displays information such as the active submission quota, total number of malicious or suspicious files and the number of submissions received. For more information, see IVX Cloud overview.
You can also view the IVX Cloud Alerts page and the sample analysis reports in your Email Security - Cloud portal.
To access the dashboard tabs, select Dashboard in the top navigation bar, then select the Dashboard , IVX Cloud, or Exec Summary tab. You can view information from the last day, week, or month. In the IVX Cloud tab, you can view information from last day, week, month, or year.
The following is an example of how the Dashboard appears in Outbound view:
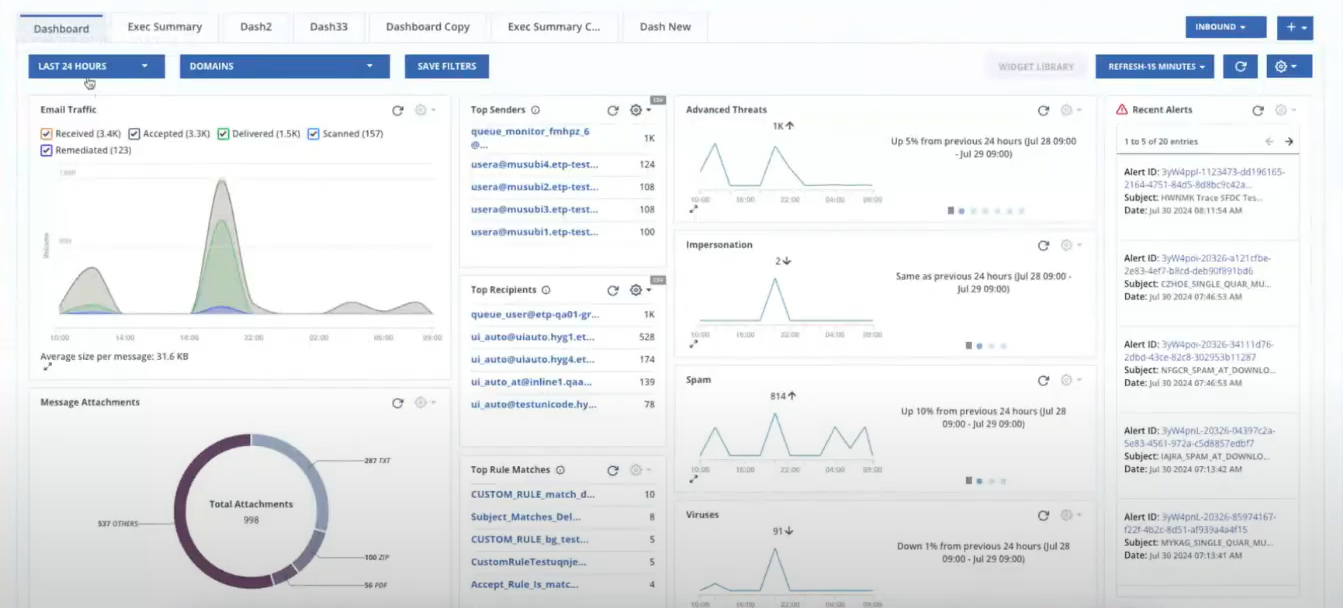
The information shown covers a specified time range and set of domains. You can specify what data is displayed using the choices at the top of the page. You can also customize how often the dashboard or exec summary report refreshes using the drop down menu at the top of the page.
Time
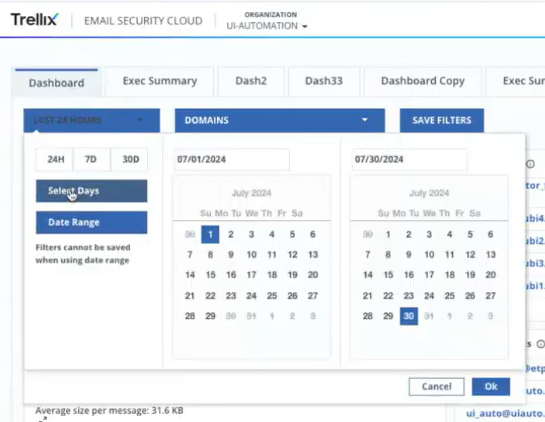
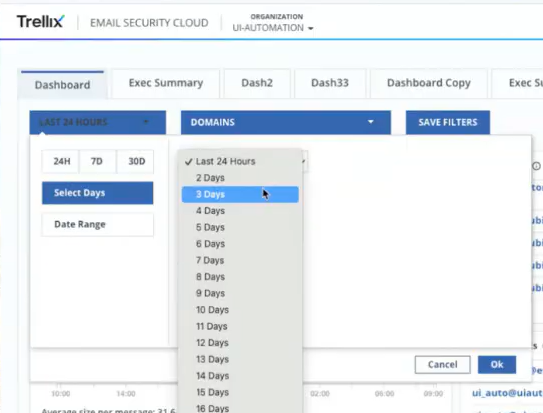
The dashboard and exec summary display data acquired over a specific time range. You can select a preset time range of 24 hours, 7 days, or 30 days at the top-left of the page.
You can also use the Date Range option to select a range of dates from the calendar provided or use the Select Days option to select a specific number of days (out of 30 days) from the drop-down menu. In the Select Days option, the selection for a specific number of days can be saved for future use.
Domains
The Domains drop down menu lets you search for a domain or select a subset of available domains.
To filter dashboard data based on domains:
Select the Domains menu and enter a search term, or select up to 5 of the listed domains by clicking the check boxes.
Click OK.
Refresh
The data is refreshed according to the specified interval.
From the refresh menu, select either 5 minutes, 10 minutes, 15 minutes, or Never.
To refresh manually, click the refresh
 icon.
icon.To refresh the data for an individual widget, click the
icon in the top right corner of the widget.
Note
Click Save Filters to save your time, domain, and refresh settings.