Endpoint Security Server Health Module User Guide Release 1.0.7
Last Updated: September 17, 2023

Contents
Module Overview .............................................................. 3
Supported Platforms ............................................................. 3
Role-Based Access for Server Health Module ................................... 3
Installing the Server Health Module ..................................... 5
Installing the Server Health Server Module .................................. 5
Verifying the Installation ................................................... 6
Uninstalling the Module .................................................. 7
Configuring the Module .................................................. 8
Enabling the Server Health Module ........................................... 8
Disabling the Server Health Module .......................................... 8
Using the Module ........................................................ 9
Viewing Server Health Monitors .............................................. 9
Process Monitor Details .................................................. 13
Setting the Logging Levels ................................................ 14
Configuring Appliance Health Service Email Notification .................... 15
Configuring Event Notifications Using the CLI ............................. 15
1 | Module Overview
Module Overview
The module enables FireEye Endpoint administrators to monitor critical service failures and identify potential issues in the product. The module collects historical data of the server's health and suggests possible remediation actions to reduce reliance on FireEye support for assistance.
The Server Health module monitors the following services:
- Application Processor
- Enterprise Search
- Lighthouse
- Policy Service
- Generic Alert Processor
- Malware Alert Processor
The Server Health module monitors the following health statistics:
- Kyoto DB Casket File Status
- Concurrent Host Limit and Sysinfo Interval
- Hits Count vs. Condition
- Orphan Condition Count
- Messagebus
- Database Table Bloat Status
- Store and Forward Cluster Connectivity
- TaskingStatus
Supported Platforms
This release of Server Health Module 1.0.7 is supported on Endpoint Security Server 5.1.1 and later.
Role-Based Access for Server Health Module
Role-based access is managed for the module and the table provides more information about the access allowed to each user role.
1 | Module Overview
|
User Roles |
Server Health Accessibility |
Module Admin Accessibility |
|---|---|---|
|
Admin |
Yes |
Yes |
|
Investigator |
Yes |
Yes |
|
Analyst |
Yes |
No |
|
Senior Analyst |
Yes |
No |
|
Operator |
Yes |
No |
|
Monitor |
No |
No |
|
Auditor |
No |
No |
4
Endpoint Security Server Health Module User Guide Release 1.0.7
2 | Module Overview
Installing the Server Health Module
Server Health is an optional module available for Endpoint Security Server 5.1.1 and above. It is installed using your Endpoint Security Web UI. The module installer package .cms file is downloaded from the FireEye Market and then installed on your Endpoint Security Web UI. Initially, the module is disabled by default and must be enabled before using it. For more information on how to enable the module, see the Enabling the Server Health Module (Server) section.
After the module is installed successfully, it is displayed on the Modules menu. The configuration properties for the module appear on the Endpoint Module Administration Module Configuration page.
Installing the Server Health Server Module
Select one of the following options to install the module:
To install the Server Health Module using the Endpoint Security Web UI:
-
Log in to the Endpoint Security Web UI as an administrator.
-
From the Modules menu, select Endpoint Module Administration.
-
Click the Available Modules tab and locate Server Health in the Module list.
-
In the Actions column, click the gear icon, and click Install.
-
Click Install on the dialog box.
To download the module installer CMS package, go to the FireEye Market, then upload the module CMS file in your Endpoint Security Web UI.
Note
Note down the navigation path to the directory where you have downloaded the .cms file.
Perform the following steps to upload the CMS file in your Endpoint Security Web UI:
-
On the Endpoint Security Web UI, click Install Modules to upload the module .cms file from your local drive to the Endpoint Security Console. The .cms file includes a server module and an agent module of the Server HealthModule.
-
In the Upload Module dialog box, navigate to the downloaded module .cms file, select the .cms file, and click Open. The selected .cms file appears in the Upload Module dialog box.
-
Click Upload.
The module is disabled by default. When the module is installed successfully, it is displayed on the Modules menu.
Endpoint Security Server Health Module User Guide Release 1.0.7
2 | Module Overview
Verifying the Installation
To verify that the Logon Tracker module is installed and running:
-
Go to Modules > Endpoint Module Administration > Installed Modules and check if the Server Health module is displayed in the list.
-
Verify the status of the module using the Endpoint Server through API.
6
Endpoint Security Server Health Module User Guide Release 1.0.7
3 | Module Overview
Uninstalling the Module
To uninstall the Server Health Module using the Endpoint Security Web UI, complete the following steps:
-
Log in to the Endpoint Security Web UI as an administrator.
-
From the Modules menu, select Endpoint Module Administration.
-
Click the Installed Modules tab and locate Server Health in the Module list.
-
On the Modules page, locate the Server Health module and click the Actions icon.
-
Select Uninstall and click Uninstall in the confirmation window.
A message at the top of the page tells you that module uninstallation succeeded.
Endpoint Security Server Health Module User Guide Release 1.0.7
7
4 | Module Overview
Configuring the Module
The Server Health Module consists of a server module and an agent module. The agent module is installed and enabled on agents using the Server Health policy. If you disable the server module, this will automatically disable the agent module for all policies.
Enabling the Server Health Module
- Log in to the Endpoint Security Web UI.
- From the Modules menu, select Endpoint Module Administration.
- On the Modules page, click Installed Modules.
- Locate the Server Health module in the list.
- In the Actions column, click the gear icon, and select Enable.
Disabling the Server Health Module
- Log in to the Endpoint Security Web UI as an administrator.
- From the Modules tab, select Endpoint Module Administration.
- On the Modules page, click Installed Modules.
- Locate the Server Health module in the list.
- In the Actions column, click the gear icon, and select Disable.
5 | Module Overview
Using the Module
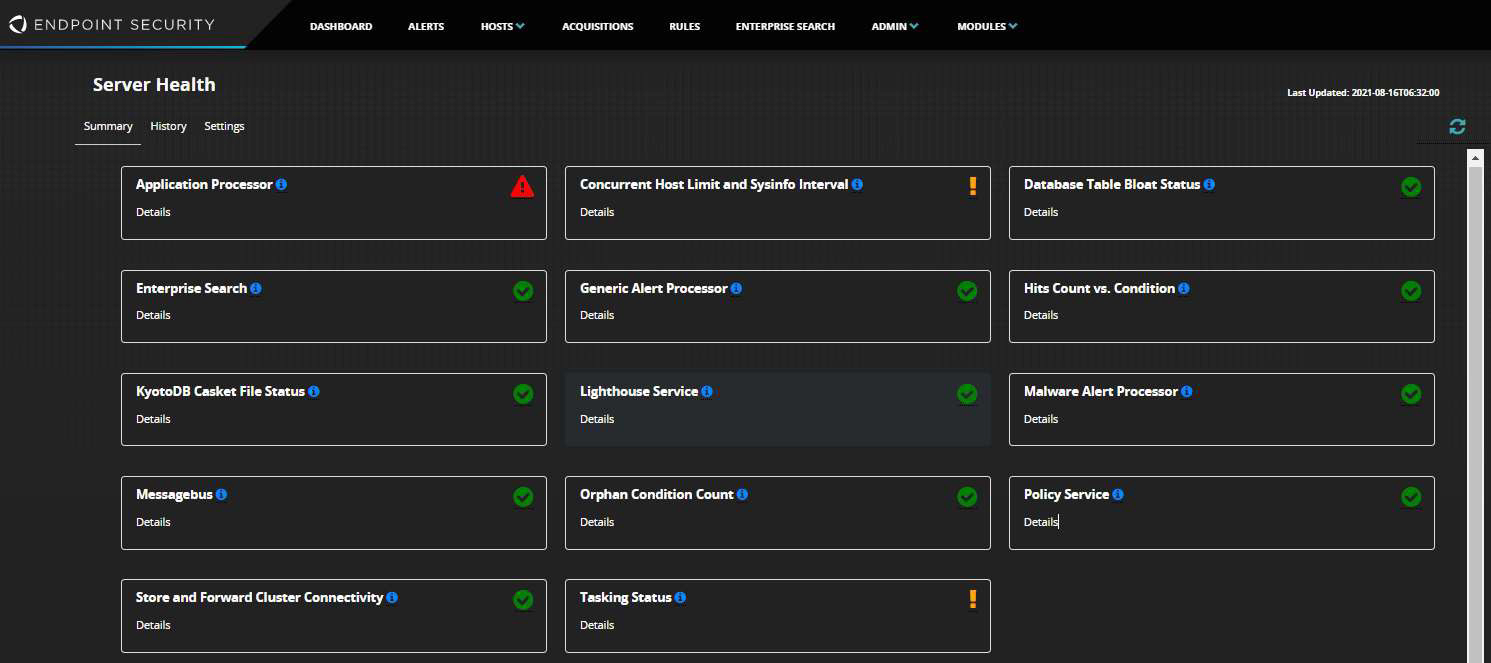
Server health statistics are captured as health monitors in Module page.
Viewing Server Health Monitors
The table indicates the time it takes for the Server Health monitors to update the current status of the processes and other health statistics.
Health Monitor | Process Name | Monitoring Interval | Recovery Steps |
|---|---|---|---|
Process Monitoring | Application Processor | app_processor | 5 mins Visit KB Article page for recovery steps |
Enterprise Search | app_search_processor or | ||
Lighthouse | lighthouse | ||
Policy Service | policy_service |
Endpoint Security Server Health Module User Guide Release 1.0.79
5 | Module Overview
|
Health Monitor |
Process Name |
Monitoring |
Recovery Steps | |
|---|---|---|---|---|
|
Generic Alert |
alert_service | |||
|
Malware Alert |
am_service |
|
Health Monitor |
Monitoring |
Decision Making |
Recovery Steps | |
|---|---|---|---|---|
|
Health Statistics |
Kyoto DB Casket |
15 mins |
CRITICAL: if casket file size is greater than 10 GB |
Visit KB Article page for recovery steps |
|
Concurrent Host Limit and Sysinfo |
1 Hour |
WARNING: if CHL is set below 25% of agent population |
5 | Module Overview
|
Health Monitor |
Monitoring Interval |
Decision Making Logic |
Recovery Steps | |
|---|---|---|---|---|
|
Count 2. If Agent 3. If Agent Count 4. If Agent Count | ||||
|
Hits Count vs. |
1 Hour |
Minimum agent count - 100 | ||
Endpoint Security Server Health Module User Guide Release 1.0.7
11
5 | Module Overview
|
Health Monitor |
Monitoring |
Decision Making |
Recovery Steps | |
|---|---|---|---|---|
|
Orphan Condition |
1 Hour |
CRITICAL: if orphaned conditions are more than 200k | ||
|
Messagebus |
5 mins |
CRITICAL: if we get any error in the response of fetching list of topics | ||
|
Database Table |
12 Hour |
WARNING: if table size is over 500 MB, bloat size is over 200 MB, bloat ratio is over 40. | ||
|
Store and Forward Cluster |
5 mins |
CRITICAL: if sfServer or sfTasker is not running |
5 | Module Overview
|
Health Monitor |
Monitoring |
Decision Making |
Recovery Steps | |
|---|---|---|---|---|
|
responds with | ||||
|
Tasking Status |
1 hour |
Warning: if
|
Process Monitor Details
When the server process stops running, service health monitor reports its health status as Critical or Warning on the Module
Endpoint Security Server Health Module User Guide Release 1.0.713
5 | Module Overview
page.
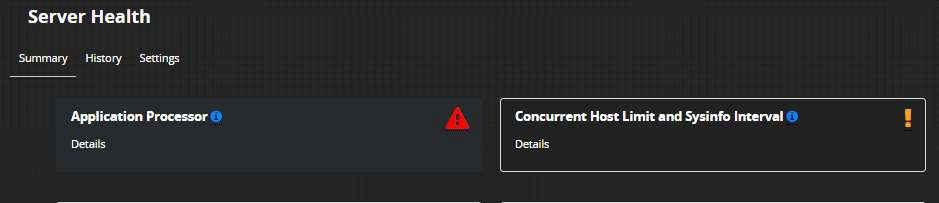
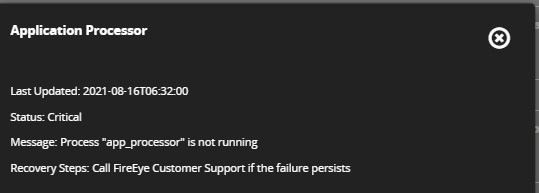
You can click the health monitor to view additional details about the failure and the suggested recovery steps.
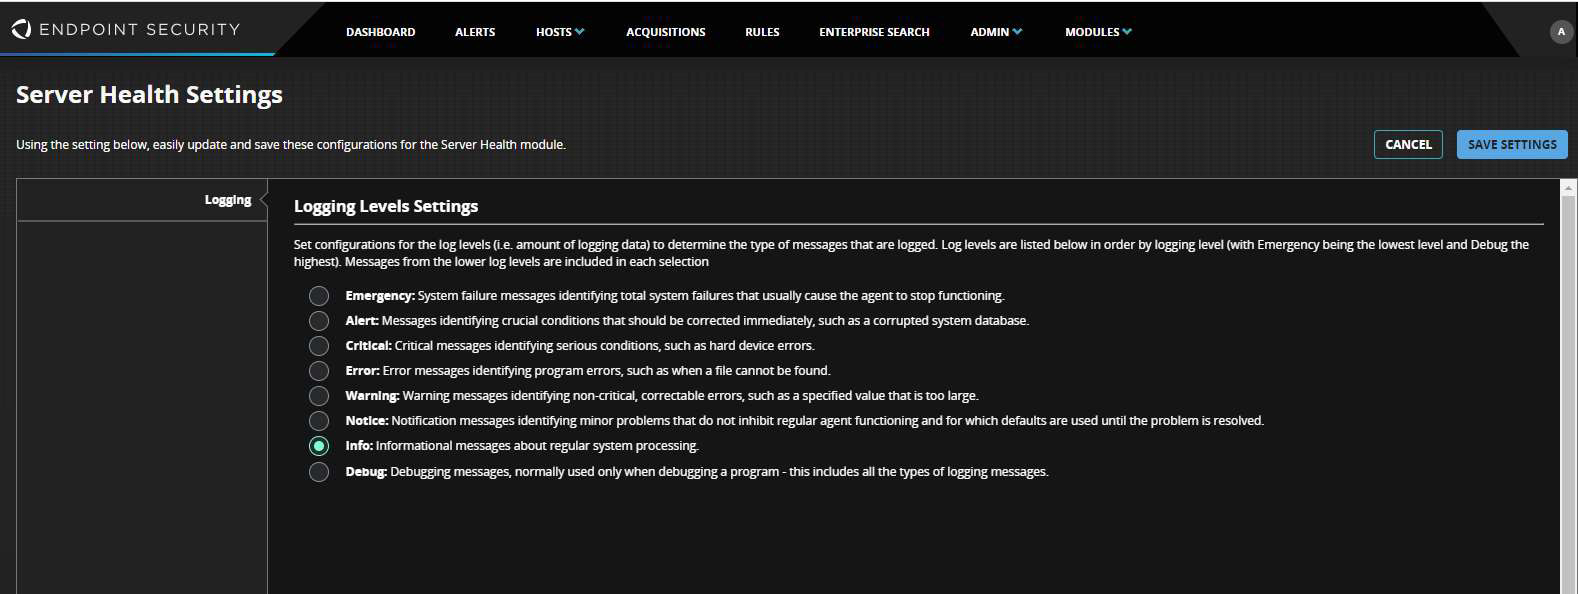
Setting the Logging Levels
On the Endpoint Module Administration page, click Configure to set the logging level of the module for debugging.
5 | Module Overview
Note
The log files are created under /var/log/supervisor/server_health*.log
Configuring Appliance Health Service Email Notification
You can receive email notifications about your system's health changes with your Endpoint Security appliance. Before configuring email notifications for the Endpoint Security appliance, ensure the following Prerequisites is met:
- The Endpoint Security appliance has an established connection to the Internet.
- You have an "Admin" or "Operator" access to the Endpoint Security appliance.
- Email recipients have been configured. For more information, see the "Configuring Email Notifications" section in “Event Notifications” chapter of the Endpoint Security System Administration Guide.
Configuring Event Notifications Using the CLI
Use the CLI commands to configure appliance health service email notifications.
To configure event notifications using the CLI:
-
Enable the CLI configuration mode.
hostname > enable hostname # configure terminal -
Enable Email notifications about the health of an appliance service.
hostname(config)# health configuration service notify enable -
Configure the failure wait time threshold. An email notification is sent after the service has been in failed state for the specified number of minutes.
hostname (config) # health configuration service notify failure-threshold <minutes> -
Configure the recovery time threshold. An email notification is sent after the service recovers and stays in recovered or healthy state for the specified number of minutes. This recovery threshold time prevents multiple notifications if the service changes state intermittently.
hostname (config) # health configuration service notify recovery-threshold -
Configure the time of day when the email notification to be sent about the health of appliance services.
hostname (config) # health configuration digest notify daily at <hour:minute> -
Configure the backoff time. If the service changes its state to degraded, then an email notification will not be sent until the
Endpoint Security Server Health Module User Guide Release 1.0.7 15
5 | Module Overview
configured backoff time is reached.
hostname # health configuration service notify backoff <hours>7. View the configuration for appliance service email notifications.
hostname # show health configurationCOPYRIGHT
Copyright © 2026 Musarubra US LLC.
Trellix and FireEye are the trademarks or registered trademarks of Musarubra US LLC, FireEye Security Holdings US LLC, and their affiliates in the US and /or other countries. Other names and brands are the property of these companies or may be claimed as the property of others.